Abstract
DsRed is a recently cloned 28-kDa fluorescent protein responsible for the red coloration around the oral disk of a coral of the Discosoma genus. DsRed has attracted tremendous interest as a potential expression tracer and fusion partner that would be complementary to the homologous green fluorescent protein from Aequorea, but very little is known of the biochemistry of DsRed. We now show that DsRed has a much higher extinction coefficient and quantum yield than previously reported, plus excellent resistance to pH extremes and photobleaching. In addition, its 583-nm emission maximum can be further shifted to 602 nm by mutation of Lys-83 to Met. However, DsRed has major drawbacks, such as strong oligomerization and slow maturation. Analytical ultracentrifugation proves DsRed to be an obligate tetramer in vitro, and fluorescence resonance energy transfer measurements and yeast two-hybrid assays verify oligomerization in live cells. Also, DsRed takes days to ripen fully from green to red in vitro or in vivo, and mutations such as Lys-83 to Arg prevent the color change. Many potential cell biological applications of DsRed will require suppression of the tetramerization and acceleration of the maturation.
The green fluorescent protein (GFP) from the bioluminescent jellyfish Aequorea victoria has revolutionized many areas of cell biology and biotechnology, because it provides direct genetic encoding of strong visible fluorescence. Emission colors other than green have long been valued to permit multicolor tracking of separate genes or fusion proteins simultaneously or to create pairs of donors and acceptors for fluorescence resonance energy transfer (FRET). GFP mutants with blue, cyan, and yellowish green emissions are now available, but none with emission maxima longer than 529 nm (1). A breakthrough in the quest for longer wavelength naturally fluorescent proteins was the cloning by Matz et al. (2) of six anthozoan fluorescent proteins all with 26–30% identity to Aequorea GFP. Despite this modest degree of sequence identity, enough crucial motifs were conserved to suggest that the coral proteins would form 11-stranded β-barrels similar to that of GFP. Also the two most crucial residues contributing to the chromophore of GFP, Tyr-66 and Gly-67, and some of the important polar residues contacting the chromophore such as Arg-96 and Glu-222 were conserved in the coral proteins, most of which had emission maxima within the range covered by GFP or its mutants. However, one protein, drFP583 or DsRed as it is now known commercially, was from a red portion of a Discosoma species and had excitation and emission maxima at 558 and 583 nm, respectively, the longest yet reported for a wild-type spontaneously fluorescent protein (2). In DsRed, the amino acids corresponding to the above GFP residues are numbered Tyr-67, Gly-68, Arg-95, and Glu-215, respectively. The origin and function of the broad color diversity among coral proteins are of considerable intrinsic interest, although most scientists today probably are more concerned with these proteins' utility as tracers in heterologous expression systems.
Although the original report of DsRed's cloning showed an in vivo application marking the fates of Xenopus blastomeres after 1 week of development (2), it remains to be seen how generally useful DsRed will be as an alternative for GFP and its mutants. For example, we need to know how long the red fluorescence takes to appear, how pH sensitive the chromophore is, how strongly the chromophore absorbs light and fluoresces, how readily the protein photobleaches, and whether the protein is normally an oligomer or a monomer in solution. This report provides answers to these important questions. We also report some mutants that are nonfluorescent or that are blocked or slowed in converting from green to red emission. In some of the latter mutants, the eventual fluorescence is substantially red-shifted from wild-type DsRed. In the accompanying paper (3), careful mass spectral comparison of wild-type DsRed with a nonripening mutant reveals the structure of the chromophore.
Materials and Methods
Mutagenesis and Screening.
The coding sequence for DsRed was amplified from pDsRed-N1 (CLONTECH) with PCR primers that added an N-terminal BamHI before the starting Met codon and a C-terminal EcoRI after the stop codon. After restriction digestion, this PCR product was cloned between the BamHI and EcoRI sites of pRSETB (Invitrogen), and the resulting vector was amplified in DH5α bacteria. This plasmid was used as a template for error-prone PCR (4) with primers that were immediately upstream and downstream of the DsRed coding sequence, theoretically allowing mutation of every coding base, including the starting Met. The resulting mutagenic PCR fragment then was digested with EcoRI and BamHI and recloned into pRSETB. Alternatively, the Quick-Change mutagenesis kit (Stratagene) was used to make directed mutations on the pRSETB–DsRed plasmid. In both random and directed mutagenesis studies, the mutagenic plasmid library was electroporated into JM109 bacteria, plated on LB plates containing ampicillin, and screened on a digital imaging device (5). This device illuminated plates with light from a 150-W xenon arc lamp, filtered through bandpass excitation filters, and directed onto the plates with two fiber optic bundles. Fluorescence emission from the plates was imaged through interference filters with a cooled charge-coupled device camera. Images taken at different wavelengths could be digitally ratioed by using metamorph software (Universal Imaging, Media, PA) to allow identification of spectrally shifted mutants. Once selected, the mutant colonies were picked by hand into LB/ampicillin medium, after which the culture was used for protein preparation or for plasmid preparations. The DsRed mutant sequences were analyzed with dye-terminator dideoxy sequencing by the Molecular Pathology Shared Resource, University of California, San Diego Cancer Center.
Protein Production.
DsRed and its mutants were purified as described (5) by using the N-terminal polyhistidine tag MRGSHHHHHHGMASMTGGQQMGRDLYDDDDKDP provided by the pRSETB expression vector. The proteins were microconcentrated and buffer exchanged into 10 mM Tris, pH 8.5 by using a Microcon-30 (Amicon) for spectroscopic characterization. Alternatively, the protein was dialyzed against 10 mM Tris, pH 7.5 for oligomerization studies, as microconcentration was found to create large protein aggregates. To test for light sensitivity of protein maturation, the entire synthesis was repeated in the dark, with culture flasks wrapped in foil, and all purification done in a room dimly lit with red lights. No difference in protein yield or color was found when the protein was prepared in light or dark.
Our numbering of amino acids conforms to the wild-type sequence of drFP583 (2), in which residues 66–68, Gln-Tyr-Gly, are homologous to the chromophore-forming residues (65–67, Ser-Tyr-Gly) of GFP. The extra amino acid introduced by CLONTECH after the starting Met therefore is numbered 1a, and the amino-terminal polyhistidine tag is numbered −33 to −1.
Spectroscopic Studies.
Fluorescence spectra were taken with a Fluorolog spectrofluorimeter (Spex Industries, Edison, NJ). Absorbance spectra of proteins were taken with a Cary UV-Vis spectrophotometer. For quantum yield determination, the fluorescence of a solution of DsRed or DsRed K83M in PBS was compared with equally absorbing solutions of rhodamine B and rhodamine 101 in ethanol. Corrections were included in the quantum yield calculation for the refractive index difference between ethanol and water. For extinction coefficient determination, native protein absorbance was measured with the spectrophotometer, and protein concentration was measured by the BCA method (Pierce).
Biochemical Studies.
The pH sensitivity of DsRed was determined in a 96-well format by adding 100 μl of dilute DsRed in a weakly buffered solution to 100 μl of strongly buffered pH solutions in triplicate (total 200 μl per well) for pHs from 3 to 12. The fluorescence of each well was measured by using a 525- to 555-nm bandpass excitation filter and a 575-nm long pass emission filter. After the 96-well fluorimeter measurements were taken, 100 μl of each pH-buffered DsRed solution was analyzed on the spectrofluorimeter to observe pH-dependent spectral shape changes. For time trials of DsRed maturation, a dilute solution of freshly synthesized and purified DsRed was made in 10 mM Tris, pH 8.5, and this solution was stored at room temperature in a stoppered cuvette (not airtight) and subjected to periodic spectral analysis. For mutant maturation data, fluorescence emission spectra (excitation at 475 nm or 558 nm) were taken directly after synthesis and purification, and then after >2 months storage at 4°C or room temperature.
Bleach Measurements.
Quantum yields for photodestruction were separately measured on a microscope stage or in a spectrofluorimeter. Microdroplets of aqueous DsRed solution were created under oil on a microscope slide and bleached with 1.2 W/cm2 of light through a 525- to 555-nm bandpass filter. Fluorescence over time was monitored by using the same filter and a 563- to 617-nm emission filter. For comparison, enhanced GFP (containing mutations F64L, S65T) and enhanced yellow fluorescent protein (S65G, V68L, Q69K, S72A, T203Y) microdroplets were similarly bleached with 1.9 W/cm2 at 460–490 nm while monitoring at 515–555 and 523–548 nm, respectively. For the spectrofluorimeter bleaching experiment, a solution of DsRed was prepared in a rectangular microcuvette and overlaid with oil so that the entire 50 μl of protein solution resided in the 0.25 cm × 0.2 cm × 1 cm illumination volume. The protein solution was illuminated with 0.02 W/cm2 light from the monochromator centered at 558 nm (5-nm bandwidth). Fluorescence over time was measured at 558-nm excitation (1.25-nm bandwidth) and 583-nm emission. Quantum yields Φ for photobleaching were deduced from the equation Φ = (ɛ ⋅I⋅t90%)−1, where ɛ is the extinction coefficient in cm2mol−1, I is the intensity of incident light in einsteins⋅cm−2⋅s−1, and t90% is the time in seconds for the fluorophore to be 90% bleached (6).
SDS/PAGE.
Polyhistidine-tagged DsRed, DsRed K83M, and wild-type Aequorea GFP were run on a 15% polyacrylamide gel without denaturation. To prevent denaturation, protein solutions (in 10 mM Tris⋅HCl, pH 7.5) were mixed 1:1 with 2× SDS sample buffer (containing 200 mM DTT) and loaded directly onto the gel without boiling. A broad range prestained molecular weight marker (Bio-Rad) was used as a size standard. The gel then was imaged on a flatbed scanner.
Analytical Ultracentrifugation.
Purified, recombinant DsRed was dialyzed extensively against PBS, pH 7.4 or 10 mM Tris, 1 mM EDTA, pH 7.5. Sedimentation equilibrium experiments were performed on a Beckman Optima XL-I analytical ultracentrifuge at 20°C measuring absorbance at 558 nm as a function of radius. One hundred twenty five-microliter samples of DsRed at 3.57 μM (0.25 absorbance units) were loaded into six channel cells. The data were analyzed globally at 10K, 14K, and 20K rpm by nonlinear least-squares analysis using the origin software package supplied by Beckman. The goodness of fit was evaluated on the basis of the magnitude and randomness of the residuals, expressed as the difference between the experimental data and the theoretical curve and also by checking each of the fit parameters for physical reasonability.
FRET Between Immature Green and Mature Red DsRed in Mammalian Cells.
DsRed in the vector pcDNA3 was transfected into HeLa cells using Lipofectin. Twenty four hours after transfection, the cells were imaged on a fluorescence microscope. The fluorescences of the immature green species (excitation 465–495 nm, 505 nm dichroic, emission 523–548 nm) and mature red protein (excitation 529–552 nm, 570 nm dichroic, emission 563–618 nm) were measured with a cooled charge-coupled device camera. These measurements were repeated after selective photobleaching of the red component by illumination with light from the xenon lamp, filtered only by the 570-nm dichroic, for cumulative durations of 3, 6, 12, 24, and 49 min. By the final time, about 95% of the initial red emission had disappeared, whereas the green emission was substantially enhanced.
Yeast Two-Hybrid Analysis.
The DsRed coding region was cloned in-frame downstream of the Gal4 activation domains (the “bait”) (amino acids 768–881) and DNA binding domains (the “prey”) (amino acids 1–147) in the pGAD GH and pGBT9 vectors, respectively (CLONTECH). These DsRed two-hybrid plasmids were transformed into the HF7C strain of Saccharomyces cerevisiae, which cannot synthesize histidine in the absence of interaction between the proteins fused to the Gal4 fragments. Yeast containing both DsRed-bait and DsRed-prey plasmids were streaked on medium lacking histidine and assayed for growth by visually inspecting the plates. Alternatively, the yeast were grown on filters placed on plates lacking tryptophan and leucine to select for the bait and prey plasmids. After overnight growth, the filters were removed from the plates, frozen in liquid nitrogen, thawed, and incubated in 5-bromo-4-chloro-3-indolyl β-d-galactoside overnight at 30°C and 2 days at 4°C to test for β-galactosidase activity (assayed by blue color development). In both the β-galactosidase and histidine growth assays, negative controls consisted of yeast containing bait and prey plasmids, but only the bait or the prey was fused to DsRed.
Results
Maturation Kinetics.
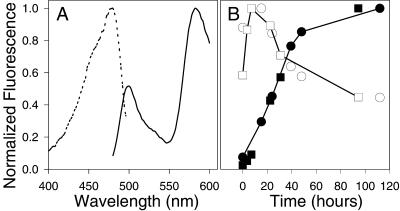
DsRed surprisingly takes days at room temperature to reach full red fluorescence. At room temperature, a sample of purified protein initially shows a major component of green fluorescence (Fig. 1A, excitation and emission maxima at 475 and 499 nm, respectively), which peaks in intensity around 7 h and decreases to nearly zero over 2 days (Fig. 1B). Meanwhile the red fluorescence reaches half its maximal fluorescence after approximately 27 h and requires >48 h to reach >90% of maximal fluorescence.
Figure 1.
DsRed maturation proceeds through a green intermediate. (A) Excitation spectrum (dashed line, emission collected at 500 nm) and emission spectrum (solid line, excitation at 475 nm) of bacterially expressed DsRed taken immediately after purification. (B) Time course of green to red conversion. Open symbols indicate green fluorescence (475-nm excitation, 500-nm emission). Filled symbols indicate red fluorescence (558-nm excitation, 584-nm emission). Squares and circles denote two separate trials. Each curve has been normalized by its maximum value to permit comparison of the time courses. The maximum green fluorescence is <1% of the maximum red fluorescence.
Optical Properties.
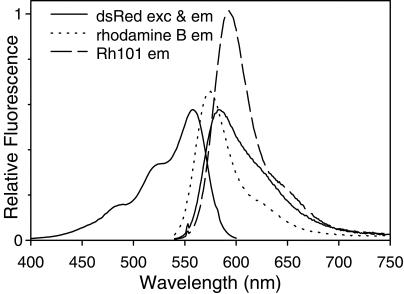
Fully matured DsRed in our hands has an extinction coefficient of 75,000 M−1⋅cm−1 at its 558-nm absorbance maximum and a fluorescence quantum yield of 0.7, much higher than the values of 22,500 M−1⋅cm−1 and 0.23 previously reported (2). These properties make mature DsRed quite similar to rhodamine dyes in wavelength and brightness (Fig. 2). We have no explanation for the difference except that the lower values might have been measured on incompletely matured protein.
Figure 2.
Excitation and emission spectra of DsRed (solid lines), as well as emission spectra of rhodamine B (dotted line) and rhodamine 101 (dashed line). All emission spectra were taken from solutions with equal absorbances at the excitation wavelength, 551.5 nm. Emission was monitored at 583 nm for the DsRed excitation spectrum. DsRed was in an aqueous solution buffered with 10 mM Tris, pH 8.5; rhodamines were in ethanol.
pH Insensitivity and Photobleach Resistance.
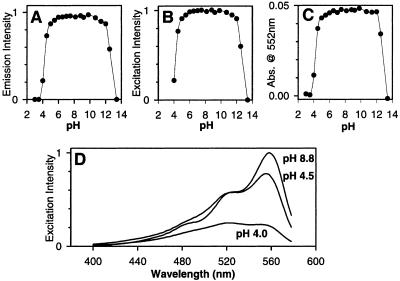
Unlike most GFP variants (1, 7), DsRed displays negligible (<10%) pH dependence of absorbance or fluorescence from pH 5 to 12 (Fig. 3 A–C). However, acidification to pH 4–4.5 depressed both the absorbance and excitation at 558 nm relative to the shorter wavelength shoulder at 526 nm (Fig. 3D), whereas the emission spectrum was unchanged in shape.
Figure 3.
pH dependence of DsRed fluorescence and absorbance. (A) 583-nm emission monitored with 558-nm excitation. (B) 558-nm excitation monitored with emission at 583 nm. (C) Absorbance at 552 nm. (D) Excitation spectra of DsRed (emission monitored at 583 nm) at pH 8.8, 4.5, and 4 showing spectral shape change.
DsRed was also relatively resistant to photobleaching. When exposed to a beam of 1.2 W/cm2 of ≈540-nm light in a microscope stage, microdroplets of DsRed under oil took 1 h to bleach 90%, whereas 20 mW/cm2 of 558-nm light in a spectrofluorometer microcuvet required 83 h to bleach 90%. The microscope and fluorometer measurements, respectively gave photobleach quantum efficiencies of 1.06 × 10⁻⁶ and 4.8 × 10⁻⁷, the mean of which is 7.7 × 10⁻⁷. Analogous microscope measurements of enhanced GFP and enhanced yellow fluorescent protein (including Q69K) gave 3 × 10⁻⁶ and 5 × 10⁻⁵, respectively.
Initial Mutagenesis of DsRed.
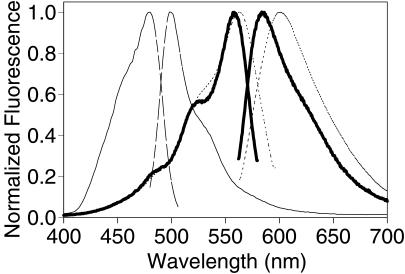
To gain further understanding about the nature of the red chromophore, and to find faster maturing variants for use as biological indicators, we began mutagenizing DsRed both randomly and at specific sites predicted by sequence alignment with GFP to be near the chromophore. We found many mutants that matured more slowly or not at all, but unfortunately none that were faster than DsRed. Screening of random mutants produced mutants that appeared green or yellow and were caused by substitutions K83E, K83R, S197T, and Y120H. The green fluorescence was caused by a species with excitation and emission maxima at 475 and 500 nm, respectively, whereas the yellow was the result of a mixture of this green species with DsRed-like material rather than a single species at intermediate wavelengths. K83R had the lowest percentage conversion to red and proved very useful as a stable version of the immature green-fluorescing form of DsRed (Fig. 4 and lane C of Fig. 5). Further directed mutagenesis of K83 yielded more green and yellow mutants impaired in chromophore maturation. Interestingly, in many of the K83 mutants that matured slowly and incompletely, the red peak was at longer wavelengths than DsRed. K83M was the most interesting because its final red-fluorescing species showed a 602-nm emission maximum (Fig. 4), with relatively little residual green fluorescence and a respectable quantum yield, 0.44. Unfortunately, its maturation was even slower than that of wild-type DsRed. Y120H had a red shift similar to that of K83M and seemed to give brighter bacterial colonies but maintained much more residual green fluorescence, so it did not represent a clear improvement.
Figure 4.
Excitation and emission spectra of DsRed (heavy solid line) and mutants K83R (thin solid line) and K83 M (dotted line). For each excitation spectrum, emission was monitored at the emission maximum, and vice versa.
Figure 5.
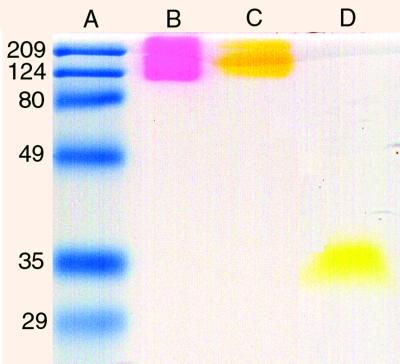
Oligomerization of unboiled, polyhistidine-tagged fluorescent proteins monitored by electrophoresis in 15% polyacrylamide gels. Lane A: Broad range prestained protein standard (Bio-Rad). Lane B: DsRed. Lane C: K83R mutant of DsRed. Lane D: Wild-type Aequorea GFP.
To test the possibility that Lys-70 or Arg-95 might form imines with the terminal carbonyl of a GFP-like chromophore (8), we made the mutants K70M, K70R, and R95K. K70M remains entirely green with no red component, whereas K70R matures slowly to a slightly red-shifted red species. We consider the spectral similarity of K70R to wild-type DsRed to argue against covalent incorporation of either amino acid into the chromophore. No fluorescence at any visible wavelength has yet been detected from R95K, which might be expected because Arg-95 is homologous to Arg-96 of GFP and is so far conserved in all known fluorescent proteins (2). The failure of R95K to form a green chromophore prevented testing whether Arg-95 also was required for reddening.
Oligomerization.
Because Aequorea GFP can form dimers at high concentrations or in some crystal forms, and Renilla GFP is believed to be an obligate dimer (9), it was important to ascertain whether DsRed is oligomerized. A preliminary hint of aggregation was seen on SDS/PAGE, in that polyhistidine-tagged protein DsRed and DsRed K83R migrated as red and yellow-green bands, respectively, at an apparent molecular mass of >110 kDa if mixed with 200 mM DTT and not heated before loading onto the gel (Fig. 5, lanes B and C). Similarly treated Aequorea GFP, in contrast, ran as a fluorescent green band near its predicted monomer molecular mass of 30 kDa (Fig. 5, lane D). The high molecular mass DsRed band disappeared, however, when the sample was briefly boiled before electrophoresis, as shown in figure 6 of the accompanying paper (3). Under these conditions, a band near the predicted monomer molecular mass of 30 kDa predominated and was colorless without Coomassie staining.
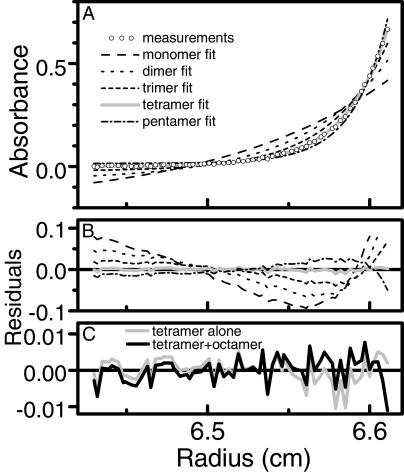
To determine the oligomerization status more rigorously, we subjected DsRed protein to analytical equilibrium centrifugation (10). Global curve fitting of the absorbance data determined from the radial scans of equilibrated DsRed indicated that it exists in solution as an obligate tetramer (Fig. 6 A and B) both in low-salt and physiological salt concentrations. When we modeled the data with a single-species tetramer, the fitted molecular mass was 119,083 Da, in excellent agreement with the theoretical molecular mass of 119,068 Da for the tetramer of polyHis-tagged DsRed. Attempts to fit the curves with alternative stoichiometries from monomer to pentamer failed to converge or gave unreasonable values for the floating variables and large, nonrandom residuals (Fig. 6 A and B). The residuals for the tetramer fit were much smaller and more randomly distributed (Fig. 6B), but could be somewhat further improved by extending the model to allow the obligate tetramer to dimerize into an octamer, with a fitted dissociation constant of 39 μM (Fig. 6C). Thus the 558-nm absorbing species appears to be at least tetrameric over the range of monomer concentrations from 14 nM to 11 μM in vitro. The hint of octamer formation at the highest concentrations is only suggestive because the highest concentrations of tetramer achieved in the ultracentrifugation cell remained more than an order of magnitude below the fitted dissociation constant.
Figure 6.
Oligomerization of DsRed as shown by analytical ultracentrifugation. (A) Equilibrium radial absorbance profile (circles) measured at 20,000 rpm, overlaid by theoretical curve fits for species ranging from monomer to pentamer. The curves were globally fitted to data at 10,000, 14,000, and 20,000 rpm, although only the latter data are presented here. (B) Residual errors from the theoretical fits, illustrating that a tetramer (gray solid line) fits the experimental data better than monomer, dimer, trimer, or pentamer. (C) Residual errors on an expanded scale comparing simple tetramer (gray solid line, same values as in B) with a model allowing the tetramer to dimerize to an octamer (black solid line) with a Kd of 39 μM, i.e., [octamer] = [tetramer]2/(39 μM). The variance for the tetramer + octamer model was 1.18 × 10⁻⁵, somewhat better than that for the tetramer alone, 1.95 × 10⁻⁵.
To confirm whether DsRed also oligomerizes in live cells, we used FRET in mammalian cells and two-hybrid assays in yeast. HeLa cells were transfected with wild-type DsRed and imaged 24 h later when they contained a mixture of the immature green intermediate and the final red form. We then monitored the green fluorescence intermittently before and during selective photobleaching of the red species over 49 min of intense orange illumination. If the two proteins were nonassociated, bleaching the red species should have had no effect on the green fluorescence. In fact, the green fluorescence increased by 2.7- to 5.8-fold in different cells, corresponding to FRET efficiencies of 63–83%. These values equal or surpass the highest FRET efficiencies ever seen between GFP mutants, 68% for cyan and yellow fluorescent proteins linked by a Zn2+-saturated zinc finger domain (11).
The second line of evidence for in vivo oligomerization was a directed yeast two-hybrid screen. When DsRed fusions to both the Gal4 DNA binding domain and activation domain were expressed in HF7C yeast, the yeast became his+, i.e., able to grow without supplemental histidine, suggesting a two-hybrid interaction. Neither fusion construct alone (DsRed–DNA binding domain or DsRed–activation domain) could direct the his+ phenotype, suggesting that the DsRed–DsRed interaction, and not a nonspecific DsRed–gal4 interaction, was responsible for the positive result. In addition, the his+ yeast turned blue when lysed and incubated with 5-bromo-4-chloro-3-indolyl β-d-galactoside, suggesting that the DsRed–DsRed interaction also drove transcription of the β-galactosidase gene. Therefore, two separate transcriptional readouts of the yeast two-hybrid assay confirmed that DsRed associates in vivo.
Discussion
Our biochemical studies of DsRed revealed a mixture of desirable vs. nonoptimal properties of DsRed. The most important favorable surprise is that DsRed has a much higher extinction coefficient and fluorescence quantum yield (0.7) than previously reported. These properties indicate that the fluorescence brightness of the mature well-folded protein is already comparable to rhodamine dyes or the best GFPs and would be difficult to improve by a large factor. DsRed is also quite resistant to photobleaching by intensities typical of spectrofluorometers (≈mW/cm2) or microscopes with arc lamp illumination and interference filters (≈W/cm2), showing a photobleaching quantum yield on the order of 7 × 10⁻⁷ in both regimes. This value is significantly better than those for two of the most popular green and yellow mutants of GFP, enhanced GFP (3 × 10⁻⁶), and enhanced yellow fluorescent protein including Q69K (5 × 10⁻⁵). The mean number of photons that a single molecule can emit before photobleaching is the ratio of the fluorescence and photobleaching quantum yields, or 1 × 10⁶, 2 × 10⁵, and 1.5 × 10⁴ for DsRed, enhanced GFP, and enhanced yellow fluorescent protein, respectively. One important caveat is that the apparent photobleaching quantum yield might well increase at higher light intensities and shorter times if the molecule can be driven into dark states such as triplets or tautomers from which it can recover its fluorescence. GFPs usually show a range of such dark states (12, 13), and there is no reason to imagine DsRed will be any simpler. Our photobleaching measurements were made over minutes to hours and include ample time for such recovery. By contrast, fluorescence correlation spectroscopy and flow cytometry monitor single passages of molecules through a focused laser beam within microseconds to milliseconds, so that temporary dark states that last longer than the transit time would count as photobleaching, raising the apparent quantum yield for bleaching. Techniques such as laser scanning confocal microscopy in which identified molecules are repetitively scanned will see intermediate degrees of photobleaching depending on the time scale of illumination and recovery.
Another good feature of DsRed for most purposes is its negligible sensitivity to pH changes over the wide range of 4.5 to 12. Currently all of the brighter GFP mutants are more readily quenched by acid pHs than DsRed is (1, 9). Such pH sensitivity can be exploited under controlled conditions to sense pH changes, especially inside organelles or other specific compartments (7), but can cause detrimental artifacts for other applications. Further studies might provide clues on how DsRed maintains its pH insensitivity and how that property might be engineered into GFPs.
Mutants such as K83M show that DsRed can be pushed yet further to longer wavelengths, 564- and 602-nm excitation and emission maxima, respectively, while retaining adequate quantum efficiency, 0.44. The 6- and 19-nm bathochromic shifts correspond to 191 and 541 cm−1 in energy and are of respectable magnitude for a single amino acid change that does not modify the chromophore. A crystal structure of DsRed and perhaps the mutant will be necessary to interpret the molecular basis for the wavelength shifts of K83M and others in Table 1. A homolog of DsRed recently cloned from a sea anemone has an absorbance maximum at 572 nm and extremely weak emission at 595 nm with quantum yield <0.001; one mutant had an emission peak at 610 nm but was very dim and slow to mature (14).
Table 1.
Spectroscopic data of mutants
| Mutation | Red species
|
Green
species
|
Maturation speed | Red/green ratio | ||
|---|---|---|---|---|---|---|
| Exc, nm | Em, nm | Exc, nm | Em, nm | |||
| None | 558 | 583 | 475 | 499 | ++ | 840 |
| K83R | 558 | 582 | 480 | 499 | −− | 0.05 |
| K83E | 550 | 584 | 474 | 497 | −− | 0.43 |
| K83N | 558 | 592 | 474 | 497 | − | 9.8 |
| K83P | 558 | 594 | 474 | 497 | − | 3.3 |
| K83F | 560 | 594 | 474 | 499 | −− | 0.29 |
| K83W | 562 | 594 | 478 | 501 | − | 0.44 |
| K83M | 564 | 602 | 474 | 499 | −− | 49 |
| Y120H | 562 | 600 | 478 | 499 | − | 0.4 |
| S197T | 558 | 584 | 478 | 499 | + | 53 |
| K70R | 562 | 585 | 480 | 503 | − | 13.8 |
| K70M | n/a | n/a | 480 | 499 | n/a | 0 |
Maturation of protein refers to the rate of appearance of the red fluorescence over the 2 days after protein synthesis. Because some maturation occurs during the synthesis and purification (which take 1–2 days), numerical quantification is not accurate. A simple +/− rating system has been used in which (−−) means very little change, (−) means a 2- to 5-fold increase in red fluorescence, (+) means a 5- to 20-fold increase, and (++) is the wild-type increase (∼40-fold). The red/green ratio was determined 2 months after protein synthesis by dividing the peak emission fluorescence obtained at 558-nm excitation by the 499-nm fluorescence obtained at 475-nm excitation from the same sample. This does not represent a molar ratio of the two species, because the ratio does not correct for differences in extinction coefficient or quantum yields between the two species, or the possibility of FRET between the two species if they are in a macromolecular complex. n/a, Not applicable.
The most troublesome aspects of DsRed are its slow and incomplete maturation and its oligomeric states. A maturation time on the order of days will preclude attempts to use DsRed as a reporter of short-term gene expression and many applications to track fusion proteins in organisms with short generation times or fast development. Maturation of GFPs was considerably accelerated by mutagenesis (15), so it is hoped that DsRed ripening can be similarly hastened. Such acceleration will be especially needed for mutations that shift DsRed to even longer wavelengths. Unfortunately, all of our mutants have so far been impaired rather than improved in the speed and completeness of red fluorophore formation.
Because the Lys-83 mutants all permit at least some maturation, it is unlikely that the primary amine plays a direct catalytic role for this residue, especially because the most chemically conservative replacement, Lys to Arg, impedes red development to the greatest extent. Ser-197 poses a similar puzzle because the most conservative possible substitution, Ser to Thr, significantly slows maturation. Interestingly, Lys-83 and Ser-197 are Leu and Thr, respectively, in the highly homologous cyan fluorescent protein dsFP483 from the same Discosoma species. Either of these two mutations could explain why dsFP483 never turns red. Residues other than Lys-83 and Ser-197 also affect maturation to the red, but the fact that these two mutation sites came up several times independently in separate random mutagenesis experiments suggest that they are fairly important. It will be important to try directed mutagenesis of other fluorescent proteins as well as DNA shuffling experiments to see whether these residues are either necessary and/or sufficient for red conversion. Further clarification of the mechanism of red fluorophore formation might be gleaned from comparing structural homology to GFP, as Lys-83 and Ser-197 in DsRed correspond to Phe-84 and Thr-203 in GFP (2), which are, respectively, rather remote and quite close to the chromophore of GFP. However, this comparison implicates neither residue in a specific mechanistic role, so obviously, a crystal structure of DsRed will be a prerequisite to rational interpretation of the effect of these residues.
The multimeric nature of DsRed was shown by four separate lines of evidence: slow migration on SDS/PAGE unless preboiled, analytical ultracentrifugation, strong FRET from the immature green to the final red form in mammalian cells, and directed two-hybrid assays in yeast by using two reporter genes, HIS3 and lacZ. Of these, analytical ultracentrifugation gave the clearest evidence for an obligate stoichiometry of 4 over the entire range of monomer concentrations assayed, 10−8 to 10−5 M, with a hint that octamer formation might occur at yet higher concentrations. Nevertheless the tests in live cells were important to confirm that aggregation occurs under typical conditions of use, including the reducing environment of the cytosol and the presence of native proteins. Oligomerization may not matter for use of DsRed simply as a reporter of gene expression, but it will raise a very serious concern in most potential applications where DsRed would be fused to a host protein to report on the trafficking or interactions of the latter. For a host protein of mass M without its own aggregation tendencies, fusion with DsRed would be predicted to form a complex of at least 4× (M+26 kDa). Furthermore, many proteins in signal transduction are activated by oligomerization, so fusion to DsRed could cause constitutive signaling. For host proteins that are already oligomeric, fusion to DsRed could either cause clashes of stoichiometry, steric conflicts of quaternary structures, or cross-linking into massive aggregates. Indeed, we already have observed that red cameleons, i.e., fusions of cyan fluorescent protein, calmodulin, and calmodulin-binding peptide, and DsRed, are far more prone to form visible punctae in mammalian cells (O. Griesbeck, personal communication) than the corresponding yellow cameleons (16) with yellow fluorescent protein in place of DsRed.
Can the oligomerization be engineered away? We expect so, particularly because the admittedly much weaker dimerization tendency of Aequorea GFP can be essentially eliminated by mutation of the hydrophobic residues in the crystal dimer interface (D.A.Z., unpublished observations). Obviously the crystal structure of a DsRed oligomer would help a great deal, but even without such high-resolution information, variants of the yeast two-hybrid assays provide a reasonable approach to select or screen for nonaggregating mutants. At the present time, we do not know whether oligomerization is necessary for red maturation, only that it is not sufficient, because the green-only mutant K83R also appears to tetramerize based on our SDS/PAGE result (Fig. 5, lane C).
Acknowledgments
This work was supported by the National Institutes of Health (NS27177) and Howard Hughes Medical Institute. R.Y.T. is a consultant for Aurora Biosciences.
Abbreviations
- GFP
green fluorescent protein
- FRET
fluorescence resonance energy transfer
References
- 1.Tsien R Y. Annu Rev Biochem. 1998;67:509–544. doi: 10.1146/annurev.biochem.67.1.509. [DOI] [PubMed] [Google Scholar]
- 2.Matz M V, Fradkov A F, Labas Y A, Savitsky A P, Zaraisky A G, Markelov M L, Lukyanov S A. Nat Biotechnol. 1999;17:969–973. doi: 10.1038/13657. [DOI] [PubMed] [Google Scholar]
- 3.Gross L A, Baird G S, Hoffman R C, Baldridge K K, Tsien R Y. Proc Natl Acad Sci USA. 2000;97:11990–11995. doi: 10.1073/pnas.97.22.11990. [DOI] [PMC free article] [PubMed] [Google Scholar]
- 4.Heim R, Tsien R Y. Curr Biol. 1996;6:178–182. doi: 10.1016/s0960-9822(02)00450-5. [DOI] [PubMed] [Google Scholar]
- 5.Baird G S, Zacharias D A, Tsien R Y. Proc Natl Acad Sci USA. 1999;96:11241–11246. doi: 10.1073/pnas.96.20.11241. [DOI] [PMC free article] [PubMed] [Google Scholar]
- 6.Adams S R, Kao J P Y, Grynkiewicz G, Minta A, Tsien R Y. J Am Chem Soc. 1988;110:3212–3220. [Google Scholar]
- 7.Llopis J, McCaffery J M, Miyawaki A, Farquhar M G, Tsien R Y. Proc Natl Acad Sci USA. 1998;95:6803–6808. doi: 10.1073/pnas.95.12.6803. [DOI] [PMC free article] [PubMed] [Google Scholar]
- 8.Tsien R Y. Nat Biotechnol. 1999;17:956–957. doi: 10.1038/13648. [DOI] [PubMed] [Google Scholar]
- 9.Ward W W. In: Green Fluorescent Protein: Properties, Applications, and Protocols. Chalfie M, Kain S, editors. New York: Wiley; 1998. pp. 45–75. [Google Scholar]
- 10.Laue T M, Stafford W F I. Annu Rev Biophys Biomol Struct. 1999;28:75–100. doi: 10.1146/annurev.biophys.28.1.75. [DOI] [PubMed] [Google Scholar]
- 11.Miyawaki A, Tsien R Y. Methods Enzymol. 2000;327:472–500. doi: 10.1016/s0076-6879(00)27297-2. [DOI] [PubMed] [Google Scholar]
- 12.Dickson R M, Cubitt A B, Tsien R Y, Moerner W E. Nature (London) 1997;388:355–358. doi: 10.1038/41048. [DOI] [PubMed] [Google Scholar]
- 13.Schwille P, Kummer S, Heikal A A, Moerner W E, Webb W W. Proc Natl Acad Sci USA. 2000;97:151–156. doi: 10.1073/pnas.97.1.151. [DOI] [PMC free article] [PubMed] [Google Scholar]
- 14.Lukyanov K A, Fradkov A F, Gurskaya N G, Matz M V, Labas Y A, Savitsky A P, Markelov M L, Zaraisky A G, Zhao X, Fang Y, et al. J Biol Chem. 2000;275:25879–25882. doi: 10.1074/jbc.C000338200. [DOI] [PubMed] [Google Scholar]
- 15.Heim R, Cubitt A B, Tsien R Y. Nature (London) 1995;373:663–664. doi: 10.1038/373663b0. [DOI] [PubMed] [Google Scholar]
- 16.Miyawaki A, Griesbeck O, Heim R, Tsien R Y. Proc Natl Acad Sci USA. 1999;96:2135–2140. doi: 10.1073/pnas.96.5.2135. [DOI] [PMC free article] [PubMed] [Google Scholar]


