

Full Text
The Full Text of this article is available as a PDF (230.4 KB).
Figure 1 .
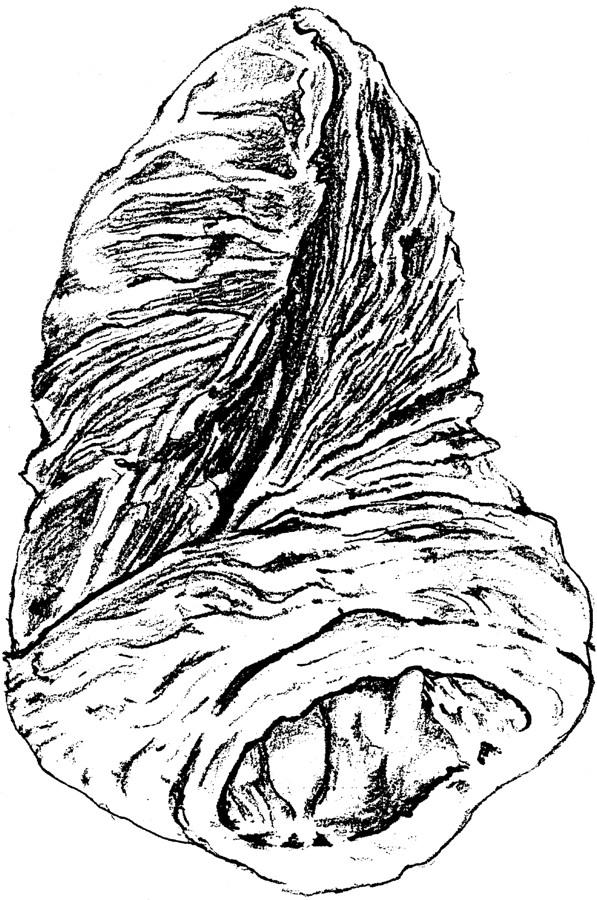
Diagram showing dissection in a normal left ventricular myocardium with the longitudinal fibres running between the apex and mitral ring and occupying the subendocardial and subepicardial layers.
Figure 2 .

Normal long axis M mode of the left site of the left ventricular free wall with a superimposed ECG and phonocardiogram. Vertical line represents A2, aortic valve closure sound.