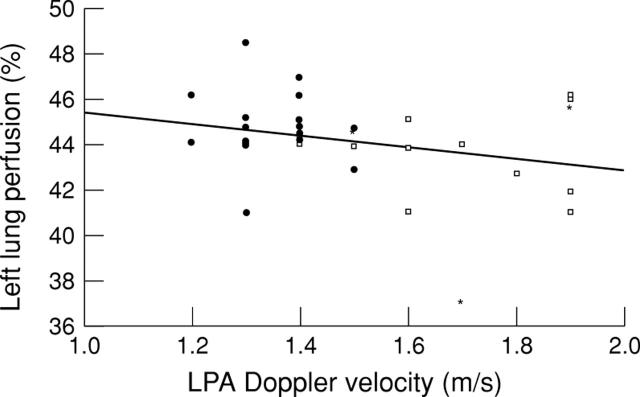
Figure 1 .
Scatter diagram of left lung perfusion as percentage of total lung flow (y axis) and peak left pulmonary artery (LPA) Doppler velocity in m/s (x axis). Filled symbols denote patients without coil protrusion into the left pulmonary artery on cross sectional echocardio-graphy, empty symbols denote patients with coil protrusion. Asterisks denote patients with previous devices implanted in the duct. The line represents the least squares regression line (r = 0.27; p = 0.125). Formula: y = −2.5 + 47.8 (95% confidence interval of coefficient: −5.7 to 0.73; 95% confidence interval of constant: 43.0 to 52.6).

