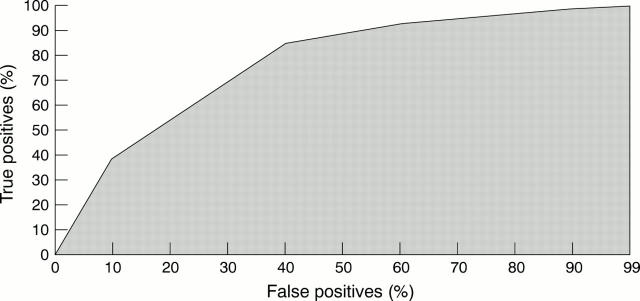
Figure 1 .
Receiver operating characteristic (ROC) curve plotted to determine the discriminatory value of the Bayesian table created from the development group (n = 1500) in predicting major adverse cardiac events (MACE) in the evaluation group (n = 1000). The area under the ROC curve is a moderately predictive 0.76 (SEM 0.07).

