Abstract
Background/Aims—Grading of Helicobacter pylori induced atrophic gastritis using the updated Sydney system is severely limited by high interobserver variability. The aim of this study was to set up a quantitative test of gastric corpus mucosal atrophy in tissue sections and test its reproducibility and correlation with the Sydney scores of atrophy.
Method—Mucosal atrophy was assessed in 124 haematoxylin and eosin stained corpus biopsy specimens by two experienced gastrointestinal pathologists (EB, JL) according to the updated Sydney system as none (n = 33), mild (n = 33), moderate (n = 33), or pronounced (n = 25). In each specimen, the proportions of glands, stroma, infiltrate, and intestinal metaplasia in the glandular zone were measured as volume percentages using a point counting method. The optimal point sample size, intra-observer and interobserver reproducibility, discriminative power for degrees of atrophy, and correlations with H pylori status were evaluated.
Results—Counting 400 points in 200 fields of vision provided the smallest sample size that still had excellent intra-observer and interobserver reproducibility (r ≥ 0.96). Overall, the volume percentage of glands (VPGL), infiltrate (VPI), and stroma (VPS) correlated well with the Sydney scores for atrophy (p ≤ 0.003). However, no differences were found between non-atrophic mucosa and mild atrophy. No correlation was found between age and either the Sydney grade of atrophy or the VPGL or VPS. In non-atrophic mucosa and mild atrophy, H pylori positive cases showed a significantly higher VPI than did H pylori negative cases. A lower VPGL was seen in H pylori positive cases than in H pylori negative cases in the mild atrophy group. VPS did not correlate with H pylori status within each grade of atrophy.
Conclusion—Point counting is a powerful and reproducible tool for the quantitative analysis of mucosal corpus atrophy in tissue sections. These data favour the combination of "none" and "mild" atrophy into one category, resulting in a three class grading system for corpus atrophy, when using the updated Sydney system.
Key Words: gastric atrophy • Sydney classification • point counting
Full Text
The Full Text of this article is available as a PDF (151.6 KB).
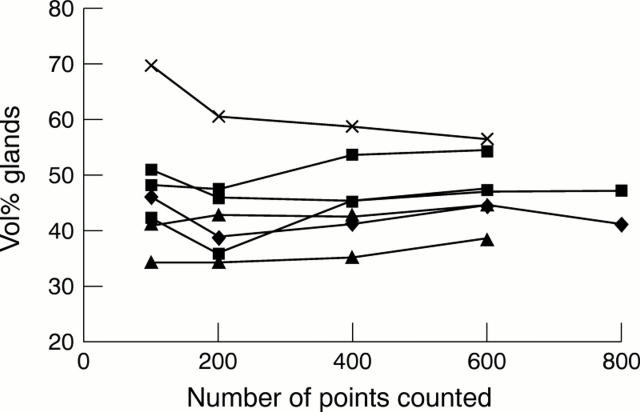
Figure 1 The optimal sample size for measuring the volume percentage of glands (VPGL) in the glandular zone of the gastric mucosa was determined in tissue sections of seven corpus biopsy specimens. The VPGL was assessed by counting 100, 200, 400, 600, and 800 points in each tissue section. Counting 400 points appeared to be the smallest sample size that yielded optimal reproducibility.
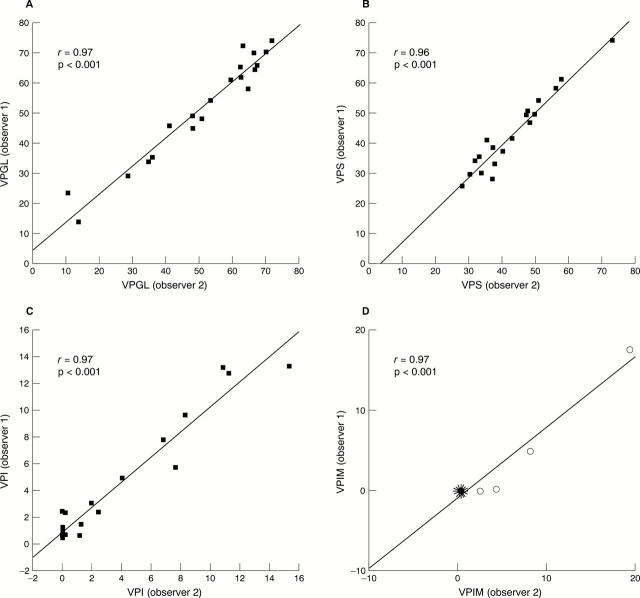
Figure 2 Interobserver agreement on the assessment of volume percentage of glands (VPGL; A), stroma (VPS; B), infiltrate (VPI; C), and intestinal metaplasia (VPIM; D) by means of point counting in the glandular zone of gastric corpus mucosa for 20 cases. Correlation coefficients (r) and p values are shown in the corresponding graphs. Intestinal metaplasia (D) was present in only four of 20 cases. The remaining 16 cases are illustrated in a sunflower presentation where each "leaf" represents a case.
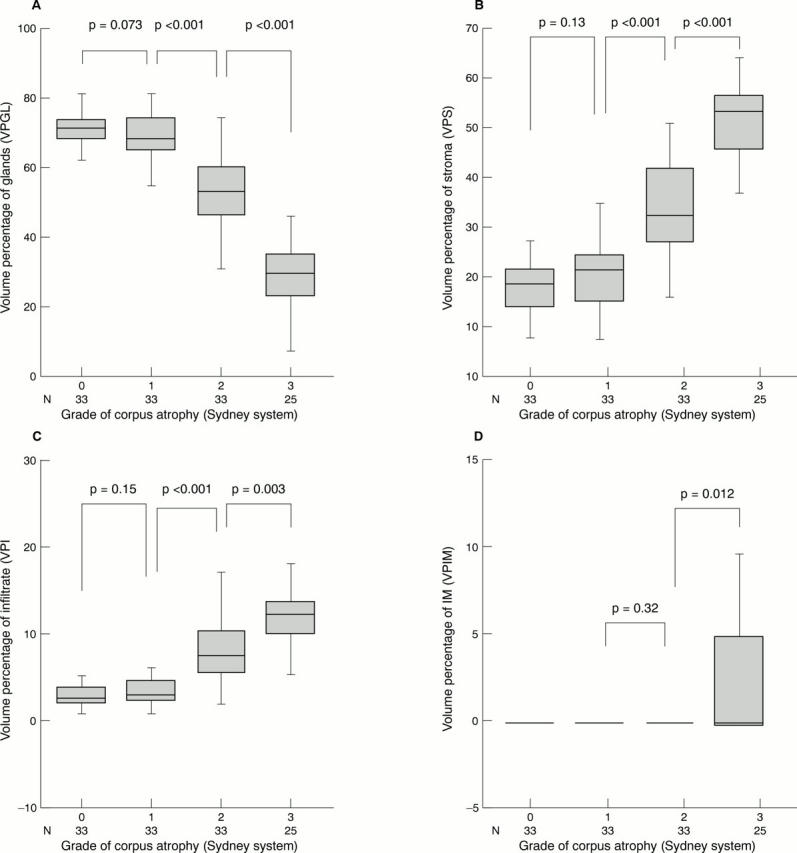
Figure 3 Volume percentages of glands (VPGL; A), stroma (VPS; B), infiltrate (VPI; C), and intestinal metaplasia (VPIM; D) for different degrees of corpus atrophy according to the updated Sydney system in 124 gastric corpus biopsies. In the moderate atrophy group only one case showed intestinal metasplasia (VPIM, 3.1%; mean VPIM, < 0.1). The Student's t test was used to calculate p values. Grade of atrophy: group 0, no atrophy; group 1, mild atrophy; group 2, moderate atrophy; group 3, pronounced atrophy.

Figure 4 Mean cumulative volume percentages of glands, intestinal metaplasia, stroma and inflammatory cells (VPGL, VPIM, VPS, and VPI, respectively) for different degrees of corpus atrophy according to the updated Sydney system in 124 gastric corpus biopsies. In the moderate atrophy group only one case showed IM (VPIM, 3.1%; mean VPIM, < 0.1). Grade of atrophy: group 0, no atrophy; group 1, mild atrophy; group 2, moderate atrophy; group 3, pronounced atrophy.
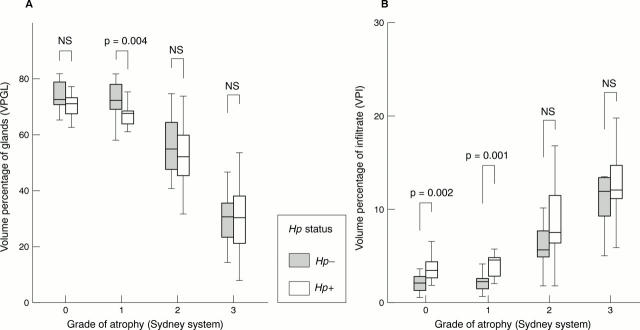
Figure 5 Volume percentage of glands (VPGL; A) and infiltrate (VPI; B) for different grades of atrophy according to the updated Sydney system in 124 gastric corpus biopsy specimens stratified by Helicobacter pylori (Hp) status. The Mann-Whitney U test was used to calculate the p values. Grade of atrophy: group 0, no atrophy; group 1, mild atrophy; group 2, moderate atrophy; group 3, pronounced atrophy. NS, not significant.
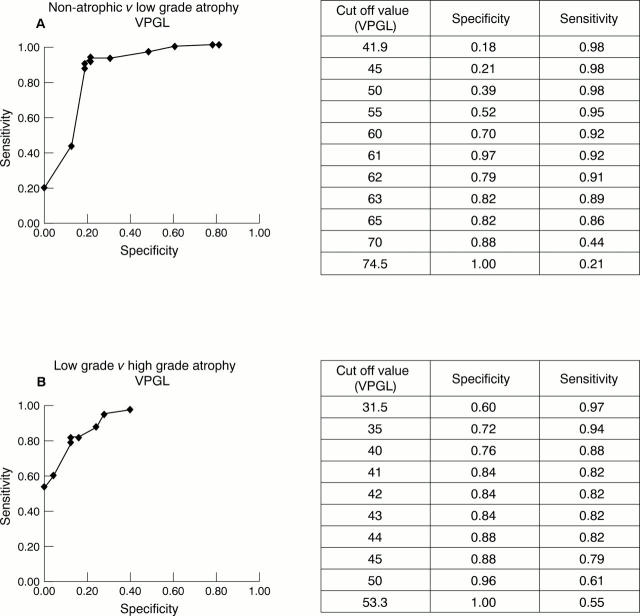
Figure 6 Receiver operating characteristic (ROC) curves showing the sensitivity and specificity of different cut off values using the volume percentage of glands distinguishing (A) non-atrophic mucosa from low grade atrophy and (B) low grade from high grade atrophy
Selected References
These references are in PubMed. This may not be the complete list of references from this article.
- Andrew A., Wyatt J. I., Dixon M. F. Observer variation in the assessment of chronic gastritis according to the Sydney system. Histopathology. 1994 Oct;25(4):317–322. doi: 10.1111/j.1365-2559.1994.tb01349.x. [DOI] [PubMed] [Google Scholar]
- Blom H. Alterations in gastric mucosal morphology induced by long-term treatment with omeprazole in rats. Digestion. 1986;35 (Suppl 1):98–105. doi: 10.1159/000199385. [DOI] [PubMed] [Google Scholar]
- Brugghe J., Baak J. P., Meijer G. A., van Diest P. J., Brinkhuis M. Rapid and reliable assessment of volume percentage of epithelium in borderline and invasive ovarian tumors. Anal Quant Cytol Histol. 1998 Feb;20(1):14–20. [PubMed] [Google Scholar]
- Cheli R., Giacosa A. Chronic atrophic gastritis and gastric mucosal atrophy--one and the same. Gastrointest Endosc. 1983 Feb;29(1):23–25. doi: 10.1016/s0016-5107(83)72493-4. [DOI] [PubMed] [Google Scholar]
- Correa P. Chronic gastritis: a clinico-pathological classification. Am J Gastroenterol. 1988 May;83(5):504–509. [PubMed] [Google Scholar]
- Correa P., Haenszel W., Cuello C., Zavala D., Fontham E., Zarama G., Tannenbaum S., Collazos T., Ruiz B. Gastric precancerous process in a high risk population: cohort follow-up. Cancer Res. 1990 Aug 1;50(15):4737–4740. [PubMed] [Google Scholar]
- Correa P. Human gastric carcinogenesis: a multistep and multifactorial process--First American Cancer Society Award Lecture on Cancer Epidemiology and Prevention. Cancer Res. 1992 Dec 15;52(24):6735–6740. [PubMed] [Google Scholar]
- Dixon M. F., Genta R. M., Yardley J. H., Correa P. Classification and grading of gastritis. The updated Sydney System. International Workshop on the Histopathology of Gastritis, Houston 1994. Am J Surg Pathol. 1996 Oct;20(10):1161–1181. doi: 10.1097/00000478-199610000-00001. [DOI] [PubMed] [Google Scholar]
- Farinati F., Formentini S., Della Libera G., Valiante F., Fanton M. C., Di Mario F., Vianello F., Pilotto A., Naccarato R. Changes in parietal and mucous cell mass in the gastric mucosa of normal subjects with age: a morphometric study. Gerontology. 1993;39(3):146–151. doi: 10.1159/000213526. [DOI] [PubMed] [Google Scholar]
- Genta R. M. Recognizing atrophy: another step toward a classification of gastritis. Am J Surg Pathol. 1996;20 (Suppl 1):S23–S30. doi: 10.1097/00000478-199600001-00004. [DOI] [PubMed] [Google Scholar]
- Gundersen H. J., Osterby R. Optimizing sampling efficiency of stereological studies in biology: or 'do more less well!'. J Microsc. 1981 Jan;121(Pt 1):65–73. doi: 10.1111/j.1365-2818.1981.tb01199.x. [DOI] [PubMed] [Google Scholar]
- Hollander D., Tarnawski A., Stachura J., Gergely H. Morphologic changes in gastric mucosa of aging rats. Dig Dis Sci. 1989 Nov;34(11):1692–1700. doi: 10.1007/BF01540046. [DOI] [PubMed] [Google Scholar]
- Khanna P. B., Davies I., Faragher E. B. Age-related changes in the stomach of the laboratory mouse: a quantitative morphological study. Age Ageing. 1988 Jul;17(4):257–264. doi: 10.1093/ageing/17.4.257. [DOI] [PubMed] [Google Scholar]
- Kuipers E. J., Uyterlinde A. M., Peña A. S., Roosendaal R., Pals G., Nelis G. F., Festen H. P., Meuwissen S. G. Long-term sequelae of Helicobacter pylori gastritis. Lancet. 1995 Jun 17;345(8964):1525–1528. doi: 10.1016/s0140-6736(95)91084-0. [DOI] [PubMed] [Google Scholar]
- Meijer G. A., Fleege J. C., Baak J. P. Stereological assessment of architectural changes in dysplastic epithelium of colorectal adenomas. Pathol Res Pract. 1994 Apr;190(4):333–341. doi: 10.1016/S0344-0338(11)80405-X. [DOI] [PubMed] [Google Scholar]
- Polkowski W., Baak J. P., van Lanschot J. J., Meijer G. A., Schuurmans L. T., Ten Kate F. J., Obertop H., Offerhaus G. J. Clinical decision making in Barrett's oesophagus can be supported by computerized immunoquantitation and morphometry of features associated with proliferation and differentiation. J Pathol. 1998 Feb;184(2):161–168. doi: 10.1002/(SICI)1096-9896(199802)184:2<161::AID-PATH971>3.0.CO;2-2. [DOI] [PubMed] [Google Scholar]
- Price A. B. The Sydney System: histological division. J Gastroenterol Hepatol. 1991 May-Jun;6(3):209–222. doi: 10.1111/j.1440-1746.1991.tb01468.x. [DOI] [PubMed] [Google Scholar]
- Sipponen P., Hakkiluoto A., Kalima T. V., Siurala M. Selective loss of parietal cells in the gastric remnant following antral resection. Scand J Gastroenterol. 1976;11(8):813–816. [PubMed] [Google Scholar]
- Stolte M., Heilmann K. L. Neue Klassifikation und Graduierung der Gastritis. Leber Magen Darm. 1989 Sep;19(5):220–226. [PubMed] [Google Scholar]
- Tosi P., Luzi P., Baak J. P., Miracco C., Vindigni C., Lio R., Barbini P. Gastric dysplasia: a stereological and morphometrical assessment. J Pathol. 1987 Jun;152(2):83–94. doi: 10.1002/path.1711520204. [DOI] [PubMed] [Google Scholar]
- Tytgat G. N., Offerhaus G. J., van Minnen A. J., Everts V., Hensen-Logmans S. C., Samson G. Influence of oral 15(R)-15-methyl prostaglandin E2 on human gastric mucosa. A light microscopic, cell kinetic, and ultrastructural study. Gastroenterology. 1986 May;90(5 Pt 1):1111–1120. doi: 10.1016/0016-5085(86)90375-6. [DOI] [PubMed] [Google Scholar]
- Whitehead R., Truelove S. C., Gear M. W. The histological diagnosis of chronic gastritis in fibreoptic gastroscope biopsy specimens. J Clin Pathol. 1972 Jan;25(1):1–11. doi: 10.1136/jcp.25.1.1. [DOI] [PMC free article] [PubMed] [Google Scholar]
- Zaitoun A. M., al Mardini H., Record C. O. Quantitative assessment of gastric atrophy using the syntactic structure analysis. J Clin Pathol. 1998 Dec;51(12):895–900. doi: 10.1136/jcp.51.12.895. [DOI] [PMC free article] [PubMed] [Google Scholar]
- el-Zimaity H. M., Graham D. Y., al-Assi M. T., Malaty H., Karttunen T. J., Graham D. P., Huberman R. M., Genta R. M. Interobserver variation in the histopathological assessment of Helicobacter pylori gastritis. Hum Pathol. 1996 Jan;27(1):35–41. doi: 10.1016/s0046-8177(96)90135-5. [DOI] [PubMed] [Google Scholar]


