

Abstract
We investigated the global changes in mRNA abundance in Escherichia coli elicited by various perturbations of tryptophan metabolism. To do so we printed DNA microarrays containing 95% of all annotated E. coli ORFs. We determined the expression profile that is predominantly dictated by the activity of the tryptophan repressor. Only three operons, trp, mtr, and aroH, exhibited appreciable expression changes consistent with this profile. The quantitative changes we observed in mRNA levels for the five genes of the trp operon were consistent within a factor of 2, with expectations based on established Trp protein levels. Several operons known to be regulated by the TyrR protein, aroF-tyrA, aroL, aroP, and aroG, were down-regulated on addition of tryptophan. TyrR can be activated by any one of the three aromatic amino acids. Only one operon, tnaAB, was significantly activated by the presence of tryptophan in the medium. We uncovered a plethora of likely indirect effects of changes in tryptophan metabolism on intracellular mRNA pools, most prominent of which was the sensitivity of arginine biosynthetic operons to tryptophan starvation.
Keywords: trp regulon, transcription, gene regulation
Four decades of studies have provided extensive information on the genes, operons, and proteins required for tryptophan biosynthesis and degradation in diverse microorganisms (1–8). A variety of mechanisms regulate expression of operons concerned with these processes (2, 4, 5, 7, 8). For some species, especially Escherichia coli, we believe we know most of the essential operons concerned with tryptophan biosynthesis and its degradation, as well as the regulatory signals that are sensed, the responding cell components, and the regulatory processes that are used (1, 2, 5, 8, 9). This knowledge was mostly acquired by exploiting differences between mutant and nonmutant organisms grown under different physiological conditions. This information has one major deficiency; it was gathered in studies of genes and gene products essential for tryptophan metabolism. Thus any gene not required for this purpose, yet influencing or influenced by one or more of its key events, was relatively unlikely to have been detected. The current availability of DNA microarrays containing sequences complementary to every translated gene in E. coli (present work and ref. 10) permits quantitative analysis of the transcript levels for all genes whose transcription is influenced by changes in tryptophan metabolism.
E. coli can synthesize, transport, and degrade tryptophan (Fig. 1). The five principal operons known to be concerned with tryptophan biosynthesis, transport, and regulation, all are transcriptionally regulated by the tryptophan-activated trp repressor (1, 2, 11). These are the trp, aroH, mtr, trpR, and aroL operons (2). The trp operon encodes the five polypeptides required for tryptophan biosynthesis from the aromatic branch point intermediate, chorismate (1, 2). Transcription of the trp operon is regulated by transcription attenuation as well as by repression (1, 2, 9, 11). The aroH operon specifies one of three nearly identical enzymes (the other two are specified by aroF and aroG) that catalyze the first reaction in the common pathway of aromatic amino acid biosynthesis (12). The mtr operon encodes a tryptophan-specific permease (13, 14), the trpR operon encodes the trp aporepressor (15, 16), and the aroL operon encodes one of two enzymes that catalyze the same reaction in the common aromatic pathway (17, 18). The mtr and aroL operons are also transcriptionally regulated by TyrR, the general aromatic pathway regulatory protein (2). aroH expression also may be influenced by TyrR action (2). In addition, transcription of the aroP operon, which encodes a protein that can transport any one of the three aromatic amino acids, can be repressed by the TyrR protein when activated by phenylalanine, tyrosine, or tryptophan (2). aroG and aroF-tyrA are also subject to TyrR regulation, in the presence of tryptophan (2). Expression of one operon, tnaAB, responsible for the tryptophan degradation, is induced by tryptophan. tnaB encodes a third tryptophan permease. Transcription of the tna operon is regulated by catabolite repression and tryptophan-induced transcription antitermination (5).
Figure 1.

Known genes of tryptophan metabolism in E. coli. The five operons previously shown to be down-regulated by the trp repressor are marked by arrows leading from trpR, the structural gene for the trp repressor. In the present study, aroF-tyrA, aroG, and aroP also were down-regulated by tryptophan. These three operons are regulated by TyrR, which can be activated by tryptophan. These genes and the genes of the trp repressor regulon, are shown in green. Genes of the tna operon that are up-regulated by tryptophan are shown in red. Genes encoding other enzymes of the common chorismate pathway are not shown.
In this study we used DNA microarrays to measure transcript levels corresponding to almost every translated gene of E. coli. Cells were grown under a variety of conditions that influence tryptophan metabolism. Every gene responding transcriptionally should show increased or decreased mRNA levels. Expression also was examined in strains with mutations that affect expression of the genes of tryptophan metabolism. The following questions were addressed: (i) Which genes exhibit expression patterns indicating that their expression is influenced by changes in tryptophan availability? (ii) Which genes are transcriptionally repressed when the trp repressor is active, and transcriptionally active when the trp repressor is inactive? (iii) Do quantitative estimates of gene expression provided by microarray analyses agree with previous estimates of gene expression based on measurements of specific protein levels? (iv) How may DNA microarray technology be best applied to analyze whole genome expression in response to changes affecting one metabolic process?
Materials and Methods
Strains Used and Growth Conditions Examined.
The various strains used in this study, their genetic characteristics, and the growth conditions used are described in Table 1. Vogel and Bonner minimal medium (17) + 0.2% glucose was used throughout. It was supplemented with l-tryptophan (50 μg/ml) or indole acrylic acid (10 or 15 μg/ml), as indicated. After growth to about 2–3 × 10⁸ cells/ml, sodium azide was added to each culture (final concentration 0.02 M), and the culture was chilled and centrifuged. Each cell pellet was stored at −80°C until its RNA was extracted.
Table 1.
Growth condition examined and strains compared
| Minimal medium vs. excess tryptophan |
| trpR+ (Min) vs. trpR+ (Min + Trp)* |
| Nonstarved vs. tryptophan-starved |
| trpR+ (Min) vs. trpR+ (Min + 10 μg/ml indole acrylate)* |
| trpR+ (Min) vs. trpR+ (Min + 15 μg/ml indole acrylate)* |
| trpR+ tnaA2 (Min) vs. trpR+ trpA46PR9 tnaA2 (Min) |
| trpR+ vs. trpR2 (repressor minus) |
| trpR+ (Min) vs. trpR2 (Min) |
| trpR+ (Min) vs. trpR2 (Min + Trp) |
| trpR+ (Min + Trp) vs. trpR2 (Min + Trp) |
| trpR+ tnaA2 (Min + Trp) vs. trpR2 tnaA2 (Min + Trp) |
| trpR+ ΔtrpEA2 (Min + Trp) vs. trpR2 ΔtrpEA2 (Min + Trp) |
Strains used were: W3110, wild type (29); CY15682, trpR2 (repressor minus) (29); CY15000, tnaA2 (tryptophanase minus) (30); CY15001, trpR2 tnaA2 (30); CY15602, ΔtrpEA2 (trp operon deleted) (31); CY15680 trpR2 ΔtrpEA2 (this study); and CY15681, tnaA2 trpA46PR9 (trpA46PR9 is a trpA bradytroph) (this study).
(Min) = Minimal medium; (Min + Trp) = minimal + 50 μg/ml l-tryptophan.
Time-course experiments; samples taken at different intervals.
Microarray Procedures.
Relative mRNA levels were determined by parallel two-color hybridization to DNA microarrays (19) with 4,058 ORFs representing 95% of E. coli ORFs according to Blattner et al. (20). DNA arrays were manufactured as described in mguide at http://cmgm.stanford.edu/pbrown/mguide/index.html. Total mRNA was extracted from 2–5 × 10⁹ cells by using Qiagen (Chatsworth, CA) RNeasy spin columns. A total of 25–30 μg of total RNA was labeled with Cy-3-dUTP (or Cy-5-dUTP) in a standard reverse transcriptase reaction, using Superscript II(+) (GIBCO/BRL) with 1 μg of random hexamer (Amersham Pharmacia) primers. After purification through Microcon-30 (Millipore) (mguide), Cy-3- and Cy-5-labeled cDNA were combined with SSC (2.5× final), SDS (0.25%), and 40 μg of E. coli rRNA (Boehringer Mannheim) in a final volume of 16 μl and hybridized to a DNA microarray for 5 h at 65°C. Slides were washed as described in mguide and scanned by using an AxonScanner (Axon Instruments, Foster City, CA; genpix 1.0) at 10 μm per pixel resolution. The resulting 16-bit TIFF images were analyzed by using scanalyze software, which is publicly available at http://rana.stanford.edu/software/. Only spots with more than 60% of all pixels having intensities greater than average background intensities were selected for further analysis. The reproducibility of the technique was assessed in a separate experiment (see http://genome-www.stanford.edu/tryptophan/supplement/Supplement_1.htm).
Comparative measurements of transcript abundance were performed in two ways. Time-course samples were analyzed by directly comparing the abundance of each gene's transcripts relative to the t0 sample. RNA samples taken during the time course were labeled with Cy-5, and RNA from the t0 sample was labeled with Cy-3. Comparisons between paired mutant and wild-type cultures were done directly. Probes made from RNA from mutant strains typically were labeled with Cy-5, and probes from the isogenic wild-type strain were labeled with Cy-3.
Data Selection and Analysis.
Data were collected by using microarrays using spots whose intensities were reproducibly higher than the background level. We measured relative mRNA abundance under appropriate conditions in 19 comparisons. These were divided into the following categories: growth with and without added tryptophan, +TRP (five comparisons); growth with and without tryptophan starvation, −TRP (nine comparisons); and growth of strains with and without a trp repressor, trpR (five comparisons). Distributions of log-transformed fluorescence ratios obtained from individual arrays were approximately normal. We selected 691 genes whose relative mRNA levels were at least one standard deviation from the mean in either three of five measurements in the first category, five of nine in the second, or three of five in the third category. Selection of gene-specific thresholds as well as descriptive statistics are available at http://genome-www.stanford.edu/tryptophan/supplement/Supplement_2.htm.
Results
Design of Experiments.
Our principal objective was to identify all of the protein-encoding genes of E. coli whose transcripts become more or less abundant when the growth medium or genetic background of the strains compared was changed. Table 1 lists the growth conditions examined and the strains used. Essentially three different conditions were examined; each has a different effect on tryptophan metabolism. First, excess tryptophan was added to cultures growing in minimal medium (+Trp). Second, cultures were partially starved of tryptophan (−Trp). Starvation was imposed in either of two ways: by addition of indole acrylate to a growing culture or by using a tryptophan bradytroph, strain trpA46PR9. Indole acrylate, a tryptophan analog, has two effects. It prevents the trp repressor from acting and it inhibits the charging of tRNATrp by tryptophanyl-tRNA synthetase. The presence of indole acrylate in the growth medium therefore relieves both repression and attenuation (transcription termination) of the trp operon. The bradytroph used grows at only 80% the rate of the wild-type strain in minimal medium because its mutant TrpA protein is only slightly active. This defect results in overexpression of the trp operon as the cell attempts to provide sufficient tryptophan to support rapid growth. Gene expression under each tryptophan starvation condition was compared with expression in the wild-type strain grown in minimal medium. Third, we examined the effects of inactivating the tryptophan repressor (trpR2). The mutant allele used, trpR2, has a frameshift mutation in trpR that eliminates the production of a functional trp repressor. For reference, wild-type cultures were grown under appropriate comparison conditions. As controls, we compared wild type with wild type, and trpR2 and trpR+ strains in which the entire trp operon was deleted (ΔtrpEA2). In some comparisons the strains examined carried a mutant allele (tnaA2) that inactivates the enzyme tryptophanase. This allele prevents tryptophan degradation.
Changes in mRNA Levels for Genes of the Five Known trp Repressor-Responsive Operons.
To establish an expression standard, we initially analyzed the changes in transcript abundance for genes in the trpEDCBA, trpR, mtr, aroH, and aroL operons. These are the operons that are known to be negatively regulated to some extent by the trp repressor. Growing wild-type cultures were subjected to tryptophan starvation, excess tryptophan, or neither, and the changes in mRNA levels with time were measured and compared (Fig.2 A and B). Tryptophan starvation was induced by addition of indole acrylate. The starvation response pattern was similar for most of these operons, with an initial increase in mRNA abundance, followed by a characteristic general decrease, after 15 min (Fig. 2A). All but the aroL operon exhibited a similar profile. The maximal levels of induction varied from 1.8-fold, for trpR, to almost 82-fold, for trpE. The aroL levels changed less than 13% compared with that of the reference culture. Addition of a higher level of indole acrylate, 15 μg/ml, yielded mRNA levels comparable to the highest observed with 10 μg/ml, and, with the exception of aroL, mRNA levels remained high at later time points (data not shown). An average fold activation was calculated for each of the genes from the curves in Fig. 2A (indicated in parentheses). These were used to calculate minimal threshold values, as described later in this section (see also http://genome-www.stanford.edu/tryptophan/supplement/Supplement_2.htm).
Figure 2.
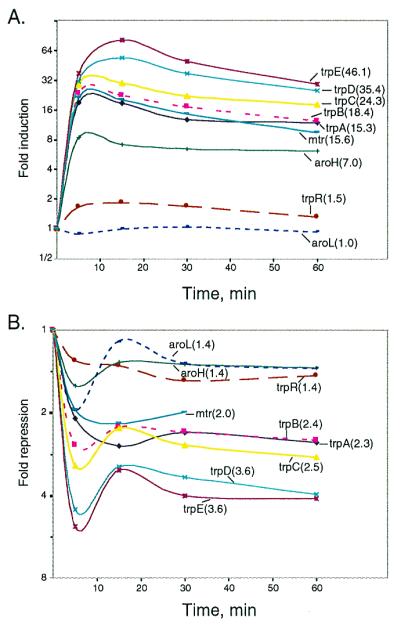
Dynamic changes in the mRNA levels for the genes in the five major trp repressor-regulated operons. (A) Tryptophan starvation (plus 10 μg/ml indole acrylic acid). (B) Tryptophan repression (plus 50 μg/ml l-tryptophan). Average magnitudes of changes in mRNA levels are shown in parenthesis.
Addition of 50 μg/ml tryptophan to a wild-type culture growing in minimal medium gave the expression pattern shown in Fig. 2B. All genes in the five operons exhibited qualitatively similar temporal repression profiles, with an initial sharp decline in transcript levels followed by the establishment of a new, lower, steady-state level. The extent of repression varied among the different operons, with the smallest for trpR, 1.5-fold, and the largest for trpE, 5.2-fold. The average extent of repression is shown in parenthesis in Fig. 2B. Whereas trpR, aroH, and aroL exhibited identical average extents of repression (1.4-fold), mtr repression was slightly greater (2-fold), and trpA, trpB, and trpC were repressed 2.3-, 2.4-, and 2.5-fold, respectively, and trpD and trpE expression were repressed the most, ca. 3.6-fold (Fig. 2B). The differences observed for the genes of the trp operon are largely caused by the internal promoter of the operon, located near the end of trpD.
To assess the degree of coregulation of the genes in the five operons we correlated the expression profiles of the individual genes in all of the time series analyzed above. In addition, we included the results of a separate experiment in which a wild-type culture grown for 200 min in the presence of 50 μg/ml tryptophan was compared with a parallel culture grown without added tryptophan. Comparisons were performed by using the Pearson correlation coefficient followed by hierarchical clustering, as described by Eisen et al. (21). Expression of the genes in the trp operon were highly correlated (r = 0.99); expression of mtr and aroH also were highly correlated (r = 0.98), and expression of the mtr/aroH pair was highly coregulated with the genes of the trp operon (r = 0.95). Because only these three of the five operons of the trp repressor regulon exhibit large expression changes, we define this set of three as the highly responsive core trp repressor regulon. trpR expression, as expected, varied only slightly in these experiments, and its expression pattern was only moderately correlated with that of other members of the core regulon (r = 0.55). The expression pattern of aroL, as also expected, showed little correlation with that of other genes in this group (r = 0.17).
Comparison of Trp Enzyme Levels with trp mRNA Levels.
The specific activities of the Trp biosynthetic enzymes are known for cultures grown under many different conditions. Using these values, and the specific activities of the pure enzymes, the levels of the five Trp polypeptides can be calculated for cultures grown under most of the conditions used in the current study (22–24). Because TrpE and TrpD polypeptide levels are generally identical, as are the TrpC, TrpB, and TrpA polypeptide levels, the combined averaged values are considered for the two groups. These two groups differ because a low-efficiency internal promoter significantly increases the levels of TrpC, TrpB, and TrpA proteins in cultures grown with tryptophan. In Table 2, Trp protein ratios are compared with the trp mRNA ratios determined in the present study. It can be seen that the Trp protein and trp mRNA ratios generally agree within a factor of 2. Trp protein levels are not available for cultures of the bradytroph used. A variable that was not taken into consideration in these calculations is that the growth rate of cultures containing 15 μg/ml indole acrylate is slightly reduced. This would result in trp mRNA representing a slightly greater fraction of the RNA that is synthesized. It should be noted from comparison of the relative trp mRNA levels for the trpR2 culture, the bradytroph, and the culture grown with indole acrylate, each compared with wild type grown in minimal medium, that the bradytroph mRNA ratios are higher than those for the trpR2 culture, and the ratios observed in the presence of indole acrylate are even higher than those for the bradytroph. These values are consistent with the expectation that there would be no repression in any of these cultures, termination (attenuation) would be slightly relieved in the bradytroph (compared with the trpR mutant in which termination would be maximal), and termination would be almost completely relieved in cultures grown with indole acrylate.
Table 2.
Estimated Trp protein ratios compared with trpmRNA ratios calculated from microarray data
| Gene | wt, growth in min vs.
Trp
|
trpR2 vs. wt, growth in
min
|
Brady vs. wt, growth in min
|
wt,
growth in IA vs. min
|
|||
|---|---|---|---|---|---|---|---|
| Protein | mRNA | Protein | mRNA | mRNA | Protein | mRNA | |
| trpE | 10 | 5.0 ± 0.2* | 7.7 | 6.3† | 11.4† | 46 | 81 ± 3‡ |
| trpD | 10 | 5.2 ± 0.7 | 7.7 | 3.7 | 8.0 | 46 | 43 ± 0.5 |
| trpC | 3.7 | 2.2 ± 0.5 | 4.8 | 4.4 | 8.7 | 29 | 30 ± 9 |
| trpB | 3.7 | 2.4 ± 0.2 | 4.8 | 4.1 | 6.9 | 29 | 17 ± 4 |
| trpA | 3.7 | 2.4 ± 0.2 | 4.8 | 3.8 | 9.3 | 29 | 15 ± 2 |
wt, Wild type.
mRNA values for cultures grown with tryptophan were corrected for the background levels of nonspecific signal detected with mRNA from strains with the trp operon deleted: ΔtrpEA2. Corrections were 43% for trpE mRNA, 54% trpD mRNA, and 10% for trpC, trpB, and trpA mRNAs.
Only one pair of cultures was grown under the conditions indicated.
The averages used are for cultures grown in minimal medium + 15 μg/ml indole acrylate for 30 and 60 min. The corresponding predicted protein values are based on the 6-fold increase in expression observed in strains with the leader terminator deleted.
Global Analysis of Gene Expression Under Different Conditions Affecting Tryptophan Metabolism.
A total of 691 genes exhibited expression changes deemed to be significant on the basis of the criteria we have applied (Materials and Methods). We further examined only the subset of these genes that exhibited expression changes equal to or greater than a minimal threshold value selected on the basis of the response of the minimal responder of the nine genes of the trp repressor regulon. Threshold values were based on the average expression values given in Fig. 2 (see http://genome-www.stanford.edu/tryptophan/supplement/Supplement_2.htm for the exact procedure). Thus, in the category “response to excess Trp, +TRP,” a minimal threshold value of 1.4-fold was selected; 36 of the 691 genes exhibited mRNA level changes on average at least 1.4-fold up or down, in response to tryptophan addition. Similarly, for the category “response to tryptophan starvation, −TRP,” a minimal threshold value of 1.7-fold was selected; expression of 79 of the 691 genes changed on average at least 1.7-fold. For experiments in the category “response to trp repressor inactivation, trpR2,” the threshold value selected was 2.2-fold; 82 of the 691 genes exhibited expression changes that equaled or exceeded this value. It should be pointed out that there is a secondary effect of inactivation of the trp repressor, namely the culture slightly overproduces tryptophan. Several of the genes identified in individual categories were represented in more than one category, therefore the combined set of unique genes identified for closer scrutiny totaled 169.
We next classified each gene with respect to its behavior in each of the three response categories. Thus a gene was classified ↑ if its expression increased by more than the threshold value, ↓ if its expression decreased by more than the threshold value, or – if its expression changed by less than the threshold value. Thus the profile –↑↓ for gene x would signify that expression of this gene (i) did not change on exposure to excess tryptophan, (ii) increased on tryptophan starvation, and (iii) decreased in the trpR2 mutant vs. wild type. Applying these criteria to our 169 selected genes, the genes fell into 10 of the theoretical 27 expression profiles. These plus the 522 nonqualifying genes, profile – – –, comprise the 691 genes whose transcript levels respond to changes in tryptophan metabolism (Table 3). Of the profiles identified, profile ↑↓↑ is most relevant to regulation by the trp repressor (Table 3; see also http://genome-www.stanford.edu/tryptophan/supplement/Supplement_3.htm for the formal proof of the statistically significant profile); this profile was represented only by the five genes of the trp operon, plus mtr and aroH. As mentioned, these constitute the core trp repressor regulon. trpR and aroL are known to respond only slightly to changes in activity of the trp repressor. Also directly relevant to tryptophan metabolism, the profile ↑–↑ was represented by only one gene, tnaA (Table 3). tnaB was expected to be included in this profile because it is downstream of tnaA in the same operon; however, its expression was overall much weaker in our analyses, especially in the category of experiments with inactivated trp repressor. This could be because of a defect in our ability to detect the transcript of this gene or, alternatively, an unknown step-down regulatory event may occur between tnaA and tnaB. Despite these complications, we observed that the expression patterns of tnaA and tnaB were correlated with each other at 0.76 (see below), better than either of them to any other gene in the genome, under the conditions we examined (data not shown). Profile ↓– – is represented by 13 genes, including trpR, and five genes involved in aromatic amino acid metabolism, aroF-tyrA, aroL, aroG, and aroP, all of which are known to be down-regulated by the TyrR protein in the presence of phenylalanine, tyrosine, or tryptophan (2). This profile also included yjjX, which is transcribed toward trpR from the opposite DNA strand. The other genes with the ↓– – profile: sieB, rpsU, rpmA, fliS, flgI, and ampE, could not be assigned to a unique metabolic (functional) group. Two other profiles were represented by a single gene, and four were each shared by between 24 and 41 genes (Table 3). Profile –↑– contained a variety of genes involved in nitrogen metabolism and motility, with six genes of unknown function. Profile – –↑ was dominated by 25 genes of unknown function, including 11 identical copies of the IS5 putative transposase gene.
Table 3.
Average amplitude expression profiles
| TRP excess | TRP starvation | trpR inactivation | Number of genes | Member genes/function |
|---|---|---|---|---|
| ↓ | – | ↑ | 1 | b1172 |
| ↓ | – | ↓ | 1 | fliA |
| ↑ | – | ↑ | 1 | tnaA |
| – | ↓ | – | 41 | N-metabolism/motility |
| – | – | ↑ | 40 | IS5 copies and unknown |
| – | ↑ | – | 35 | yi21/22 copies and unknown |
| – | – | ↓ | 24 | Transport/intermed. metabolism |
| ↓ | – | – | 13 | Aromatic amino acid biosynthesis |
| ↑ | – | – | 6 | tnaB, artJ, malE, and unknown |
| ↓ | ↑ | ↑ | 7 | trpR regulon |
| – | – | – | 522 | Not applicable |
| 36* | 79* | 82* | 691 |
↑, Up-regulated; ↓, down-regulated; –, unchanged.
Number of responding genes in the category.
Clustering of Genes Based on Expression.
In the search for more subtle relationships dictated not only by amplitudes but also by the shapes of the expression profiles, we subjected the 169 selected genes to agglomerative hierarchical clustering, based on their pairwise correlations across all experimental points (21) (Fig. 3; complete list can be found at http://genome-www.stanford.edu/tryptophan/supplement/Supplement_4.htm). We divided all genes into 13 groups (A–M) so that within each group, pairwise correlations of the genes' expression profiles were all greater than 0.75. This hierarchical clustering groups genes that show similar responses under our examined growth conditions, but that may not necessarily fall into the same expression profile group, as defined above. Note that the genes of the trpR regulon form a tight cluster (G) with the yciFG operon, which is just downstream of the trp operon. However, the response of yciFG is considerably muted compared with that of the trp operon. Similarly genes tnaA and tnaB are in a single correlation group, H. Other genes that are concerned with aromatic amino acid metabolism, including aroF, tyrA, aroL, aroP, trpR, aroG, wrbA, and tyrR, fall into several different clusters (Fig. 3). Some groups of genes appear to be transcriptionally activated primarily by tryptophan starvation (groups E, F, and G) whereas other groups are principally repressed under these conditions (groups I, J, and K). Only five known multigene operons, aroFtyrA, trpEDCBA, tnaAB, codBA, and rplKA, were fully represented in the set of 169 genes that were selected (for details see http://genome-www.stanford.edu/tryptophan/supplement/Supplement_6.htm and http://genome-www.stanford.edu/tryptophan/supplement/Table_4.htm). Thirty-two operons were represented by either a first or last gene, whereas five were represented by a middle gene. The explanation for these patterns is not known. In 15 instances we observed that expression of the terminal gene in an operon was correlated with expression of the adjacent gene of another operon (full breakdown of the effects of neighboring ORFs is presented at http://genome-www.stanford.edu/tryptophan/supplement/Supplement_6.htm). For instance, transcripts that hybridize to the gene just downstream of argA, recD, are, like argA, more abundant under normal growth conditions than under conditions of tryptophan starvation, despite the fact that these genes are organized tail-to-tail. Inasmuch as our transcript detection procedure will detect both sense and antisense transcripts, it seems likely that in some of these examples transcription termination at the end of the operon is incomplete and we are detecting the read-through transcript. In addition, divergent transcription from adjacent or overlapping promoters could have positive or negative effects on transcription from either promoter.
Figure 3.
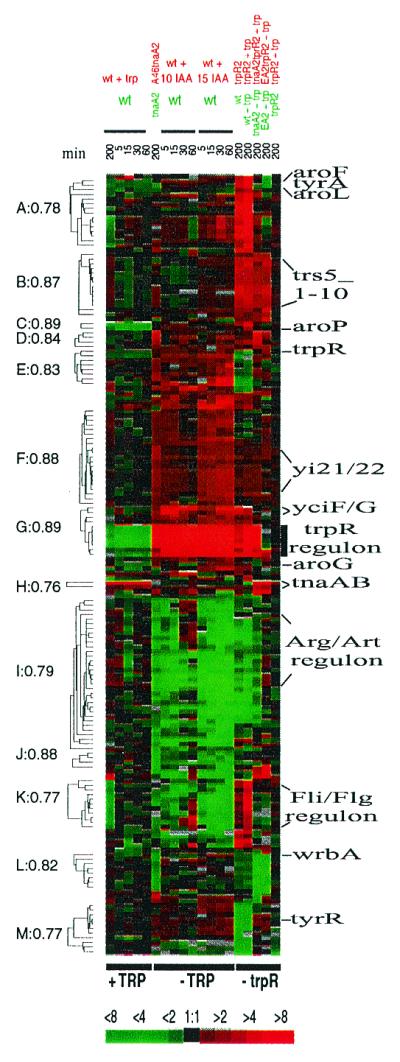
Hierarchical clustering of the 169 identified genes (see text). Correlation coefficients, r, are indicated to the left of the corresponding nodes. Selected genes are indicated to the right. A more complete version of this figure, corresponding ratio table, and complementary Table 4 can be found at http://genome-www.stanford.edu/tryptophan/Figure3_1.html.
We also were interested in determining whether any of our identified genes that exhibit the same expression pattern, like those of the trp repressor regulon, are coregulated by a known transcription factor. One would expect that any growth conditions that affected the function of a specific transcription factor would influence expression of the genes of all of the operons regulated by that factor. We used the known binding site preferences for 55 transcription factors (25) to search regions upstream of our identified genes for potential specific regulator binding sites. Putative binding sites for 44 of these transcription factors were identified. Based on this binding-site analysis, two transcription factors, ArgR and TrpR, could potentially account for regulation of 31% of the genes in group I and 66% of the genes in group G, respectively. The assessment of the significance as well as sample correlation between gene expression and strength and position of potential ArgR regulatory sites are available at http://genome-www.stanford.edu/tryptophan/supplement/Supplement_6.htm, http://genome-www.stanford.edu/tryptophan/supplement/Table_4.htm, http://genome-www.stanford.edu/tryptophan/supplement/Supplement_7.htm, and http://genome-www.stanford.edu/tryptophan/supplement/Figure_4.gif.
Discussion
There have been many applications of microarrays in analyses of mRNA levels, especially in yeast and human cells (for examples, refs. 26–28). In the current study we focused on mRNA changes associated with metabolic alterations affecting the synthesis, utilization, and degradation of a single amino acid, tryptophan, in E. coli. Previous studies on the genes of tryptophan metabolism of this organism have identified 15 genes, organized in nine operons that exhibit changes in expression on altering tryptophan availability (Fig. 1). Using microarray technology, we have qualitatively and quantitatively examined the transcript levels for all of these genes. We chose the lowest significant change in expression for a gene in the trp repressor regulon, under each of the three growth conditions examined, as the threshold value for selecting sets of responding genes warranting further examination. Although this criterion was expected to exclude some putative tryptophan-regulated genes with slight responses, it seemed likely that genes selected on this basis would provide a reasonably accurate view of the major responses of the organism.
Genes in operons repressed by the trp repressor should be down-regulated by excess tryptophan, up-regulated by tryptophan starvation, and up-regulated on inactivation of the trp repressor. The only genes we observed that conformed to this expectation were the genes of the trp, mtr, and aroH operons. The trpR and aroL operons also are known to respond weakly to the trp repressor and alterations in tryptophan availability, and their expression did change slightly, as expected. The relatively high sensitivity and resolution of the techniques used allowed us to detect some subtleties in the regulation of members of this core tryptophan regulon. For example, although transcription of the trp and mtr operons was inhibited on tryptophan addition, aroH expression did not decrease under this condition. It would appear that the aroH promoter is either fully repressed at low intracellular tryptophan concentrations, or more likely, its repression may be influenced by the action of the TyrR protein, which may coregulate aroH. This observation warrants additional study. We also observed that aroF-tyrA, aroG, aroL, and aroP expression was decreased by tryptophan addition. Expression of these genes is known to be regulated by TyrR, which can be activated by tryptophan (2).
The mRNA levels for a group of genes concerned with aromatic amino acid biosynthesis decreased when tryptophan was in excess, in the presence vs. absence of an active trp repressor. However, this response appeared to be strain-dependent. In our studies we used two pairs of strains to determine the transcriptional effects of trp repressor inactivation: one pair of strains was revived from our strain collection; the second pair included freshly constructed trpR2 derivatives. Although operons of the core tryptophan regulon were actively transcribed in all comparisons of trpR2 vs. trpR+ (except for the trp operon of the trpEA2 deletion mutant), the responses of genes with the (↓– –) profile showed clear strain variation. We observed that the level of tyrR mRNA was significantly reduced (60-fold) in the trpR2 strain relative to its wild-type counterpart in the “old” pair of strains but not in a freshly constructed strains. Because many of the genes involved in the biosynthesis of aromatic amino acids are regulated by the TyrR protein, it is plausible that the observed effective derepression of these genes in the old strain was at least in part caused by a lowered TyrR level associated with some unrecognized genetic change affecting TyrR production. It would not be surprising if down-regulation of TyrR production or activity is selected for in trpR mutants, because the organism must compensate for the slight overproduction of tryptophan. This finding emphasizes the necessity of using near-isogenic strains in such analyses.
Only one operon, containing two genes, tnaA-tnaB, was up-regulated on tryptophan addition. The products of these genes both are required for tryptophan degradation. Although expression of these genes was highly correlated, expression of tnaA greatly exceeded that of tnaB, as discussed above.
We would expect that severe starvation for any single amino acid would slow protein synthesis, which would reduce expression of all genes concerned with amino acid or nucleic acid synthesis. We therefore intentionally imposed only very mild starvation conditions in our experiments. Nevertheless, we observed that genes concerned with arginine biosynthesis were particularly sensitive to tryptophan starvation.
Our results demonstrate both qualitatively and quantitatively that only three operons, trp, mtr, and aroH, constitute the core, highly responsive trp repressor regulon. We did not identify any new repressor-specific transcriptional targets. We conclude that these microarray analyses accurately reflect regulatory patterns established in prior studies of expression of the genes of tryptophan metabolism. Moreover, the magnitude of the observed changes in mRNA abundance suggests that expression of these genes must be regulated predominantly at the transcriptional level. Genes of the TyrR regulon also responded to tryptophan, as expected. We want to emphasize that our analyses were concerned only with gene expression changes associated with three specific growth conditions. It is conceivable, and perhaps likely, that there are other genes in the E. coli genome that are designed to respond to alterations affecting tryptophan metabolism, under specific environmental conditions that we did not examine. In particular, given the increasing evidence for quorum sensing or intercell communication in bacterial populations of different density, it would not be at all surprising to learn that there are genes of unknown function that are concerned with tryptophan export, or similar processes, that are expressed only under specific conditions we did not examine.
Our findings with the well-studied genes of tryptophan metabolism of E. coli therefore give us confidence that comparable studies based on perturbations of less well-understood processes will provide an accurate picture of the transcriptional responses and lead to identification of many of the major responding genes.
Acknowledgments
We thank S. Kustu, D. Zimmer, C. Gross, W. Suh, C. Richmond, Y. Wei, and F. Blattner for their help in preparing a library of E. coli ORFs and J. Bernstein, S. Dudoit, S. Kustu, T. Lowe, C. Rees, and D. Zimmer for very useful discussions. A.B.K. is a Program in Mathematics and Molecular Biology National Science Foundation Postdoctoral Fellow (Florida State Univeresity National Science Foundation Grant DMS-9406348). B.J.P. was supported by National Institutes of Health Molecular Biophysics Training Grant GM08295–11. The work was supported by National Institutes of Health grants (to N.R.C. and D.B.). P.O.B. was supported by the Howard Hughes Medical Institute and National Institutes of Health Grant HG00983. C.Y. was supported by National Institutes of Health Grant GM09738. P.O.B. is an Associate Investigator at the Howard Hughes Medical Institute.
Footnotes
Article published online before print: Proc. Natl. Acad. Sci. USA, 10.1073/pnas.220414297.
Article and publication date are at www.pnas.org/cgi/doi/10.1073/pnas.220414297
References
- 1.Yanofsky C, Miles E W, Kirschner K, Bauerle R. In: The Encyclopedia of Molecular Biology. Creighton T E, editor. Vol. 4. New York: Wiley; 1999. pp. 2676–2689. [Google Scholar]
- 2.Pittard A J. In: Escherichia coli and Salmonella: Cellular and Molecular Biology. Neidhardt F C, Curtis R III, Ingraham J L, Lin E C C, Low K B, Magasanik B, Reznikoff W S, Riley M, M, Schaecter A, Umbarger H E, editors. Vol. 1. Washington, DC: Am. Soc. Microbiol.; 1996. pp. 458–484. [Google Scholar]
- 3.Nichols B P. In: Escherichia coli and Salmonella: Cellular and Molecular Biology. Neidhardt F C, Curtis R III, Ingraham J L, Lin E C C, Low K B, Magasanik B, Reznikoff W S, Riley M, M, Schaecter A, Umbarger H E, editors. Vol. 1. Washington, DC: Am. Soc. Microbiol.; 1996. pp. 2638–2648. [Google Scholar]
- 4.Henner D, Yanofsky C. In: Bacillus subtilis and Other Gram-Positive Bacteria: Biochemistry, Physiology, and Molecular Genetics. Sonenshein A L, Hoch J A, Losick R, editors. Washington, DC: Am. Soc. Microbiol.; 1993. pp. 269–280. [Google Scholar]
- 5.Yanofsky C, Konan K V, Sarsero J P. Biochimie. 1996;78:1017–1024. doi: 10.1016/s0300-9084(97)86725-9. [DOI] [PubMed] [Google Scholar]
- 6.Crawford I P. Annu Rev Microbiol. 1989;43:567–600. doi: 10.1146/annurev.mi.43.100189.003031. [DOI] [PubMed] [Google Scholar]
- 7.Crawford I P. Methods Enzymol. 1987;142:293–300. doi: 10.1016/s0076-6879(87)42039-9. [DOI] [PubMed] [Google Scholar]
- 8.Somerville R L. In: Amino Acids: Biosynthesis and Genetic Regulation. Herrman K M, Somerville R L, editors. Reading, MA: Addison–Wesley; 1983. pp. 351–378. [Google Scholar]
- 9.Landick R, Turnbough C L, Jr, Yanofsky C. In: Escherichia coli and Salmonella: Cellular and Molecular Biology. Neidhardt F C, Curtis R III, Ingraham J L, Lin E C C, Low K B, Magasanik B, Reznikoff W S, Riley M, M, Schaecter A, Umbarger H E, editors. Vol. 1. Washington, DC: Am. Soc. Microbiol.; 1996. pp. 1263–1286. [Google Scholar]
- 10.Khodursky A B, Peter B J, Schmid M B, DeRisi J, Botstein D, Brown P O, Cozzarelli N R. Proc Natl Acad Sci USA. 2000;97:9419–9424. doi: 10.1073/pnas.97.17.9419. [DOI] [PMC free article] [PubMed] [Google Scholar]
- 11.Yanofsky C, Crawford I P. In: Escherichia coli and Salmonella: Cellular and Molecular Biology. Neidhardt F C, Curtis R III, Ingraham J L, Lin E C C, Low K B, Magasanik B, Reznikoff W S, Riley M, M, Schaecter A, Umbarger H E, editors. Vol. 1. Washington, DC: Am. Soc. Microbiol.; 1989. pp. 1453–1472. [Google Scholar]
- 12.Caligiuri M G, Bauerle R. Science. 1991;252:1845–1848. doi: 10.1126/science.2063197. [DOI] [PubMed] [Google Scholar]
- 13.Heatwole V M, Somerville R L. J Bacteriol. 1991;173:3601–3604. doi: 10.1128/jb.173.11.3601-3604.1991. [DOI] [PMC free article] [PubMed] [Google Scholar]
- 14.Sarsero J P, Pittard A J. J Bacteriol. 1991;173:7701–7704. doi: 10.1128/jb.173.23.7701-7704.1991. [DOI] [PMC free article] [PubMed] [Google Scholar]
- 15.Shakked Z, Guzikevich-Guerstein G, Frolow F, Rabinovich D, Joachimiak A, Sigler P B. Nature (London) 1994;368:469–473. doi: 10.1038/368469a0. [DOI] [PubMed] [Google Scholar]
- 16.Yang J, Gunasekera A, Lavoie T A, Jin L, Lewis D E, Carey J. J Mol Biol. 1996;258:37–52. doi: 10.1006/jmbi.1996.0232. [DOI] [PubMed] [Google Scholar]
- 17.Heatwole V M, Somerville R L. J Bacteriol. 1992;174:331–335. doi: 10.1128/jb.174.1.331-335.1992. [DOI] [PMC free article] [PubMed] [Google Scholar]
- 18.Lawley B, Pittard A J. J Bacteriol. 1994;176:6921–6930. doi: 10.1128/jb.176.22.6921-6930.1994. [DOI] [PMC free article] [PubMed] [Google Scholar]
- 19.Schena M, Shalon D, Davis R W, Brown P O. Science. 1995;270:467–470. doi: 10.1126/science.270.5235.467. [DOI] [PubMed] [Google Scholar]
- 20.Blattner F R, Plunkett G, 3rd, Bloch C A, Perna N T, Burland V, Riley M, Collado-Vides J, Glasner J D, Rode C K, Mayhew G F, et al. Science. 1997;277:1453–1474. doi: 10.1126/science.277.5331.1453. [DOI] [PubMed] [Google Scholar]
- 21.Eisen M B, Spellman P T, Brown P O, Botstein D. Proc Natl Acad Sci USA. 1998;95:14863–14868. doi: 10.1073/pnas.95.25.14863. [DOI] [PMC free article] [PubMed] [Google Scholar]
- 22.Jackson E N, Yanofsky C. J Mol Biol. 1973;76:89–101. doi: 10.1016/0022-2836(73)90082-x. [DOI] [PubMed] [Google Scholar]
- 23.Bertrand K, Yanofsky C. J Mol Biol. 1976;103:339–349. doi: 10.1016/0022-2836(76)90316-8. [DOI] [PubMed] [Google Scholar]
- 24.Yanofsky C, Platt T, Crawford I P, Nichols B P, Christie G E, Horowitz H, VanCleemput M, Wu A M. Nucleic Acids Res. 1981;9:6647–6668. doi: 10.1093/nar/9.24.6647. [DOI] [PMC free article] [PubMed] [Google Scholar]
- 25.Robison K, McGuire A M, Church G M. J Mol Biol. 1998;284:241–254. doi: 10.1006/jmbi.1998.2160. [DOI] [PubMed] [Google Scholar]
- 26.Chu S, DeRisi J, Eisen M, Mulholland J, Botstein D, Brown P O, Herskowitz I. Science. 1998;282:699–705. doi: 10.1126/science.282.5389.699. [DOI] [PubMed] [Google Scholar]
- 27.DeRisi J L, Iyer V R, Brown P O. Science. 1997;278:680–686. doi: 10.1126/science.278.5338.680. [DOI] [PubMed] [Google Scholar]
- 28.Iyer V R, Eisen M B, Ross D T, Schuler G, Moore T, Lee J C F, Trent J M, Staudt L M, Hudson J, Jr, Boguski M S, et al. Science. 1999;283:83–87. doi: 10.1126/science.283.5398.83. [DOI] [PubMed] [Google Scholar]
- 29.Kelley R L, Yanofsky C. Proc Natl Acad Sci USA. 1985;82:483–487. doi: 10.1073/pnas.82.2.483. [DOI] [PMC free article] [PubMed] [Google Scholar]
- 30.Yanofsky C, Horn V. J Bacteriol. 1981;145:1334–1341. doi: 10.1128/jb.145.3.1334-1341.1981. [DOI] [PMC free article] [PubMed] [Google Scholar]
- 31.Yanofsky C, Horn V. J Bacteriol. 1995;177:4451–4456. doi: 10.1128/jb.177.15.4451-4456.1995. [DOI] [PMC free article] [PubMed] [Google Scholar]