Abstract
This article describes how benchmarking can be used to assess laboratory performance. Two benchmarking schemes are reviewed, the Clinical Benchmarking Company's Pathology Report and the College of American Pathologists' Q-Probes scheme. The Clinical Benchmarking Company's Pathology Report is undertaken by staff based in the clinical management unit, Keele University with appropriate input from the professional organisations within pathology. Five annual reports have now been completed. Each report is a detailed analysis of 10 areas of laboratory performance. In this review, particular attention is focused on the areas of quality, productivity, variation in clinical practice, skill mix, and working hours. The Q-Probes scheme is part of the College of American Pathologists programme in studies of quality assurance. The Q-Probes scheme and its applicability to pathology in the UK is illustrated by reviewing two recent Q-Probe studies: routine outpatient test turnaround time and outpatient test order accuracy. The Q-Probes scheme is somewhat limited by the small number of UK laboratories that have participated. In conclusion, as a result of the government's policy in the UK, benchmarking is here to stay. Benchmarking schemes described in this article are one way in which pathologists can demonstrate that they are providing a cost effective and high quality service.
Key Words: benchmarking • pathology
Full Text
The Full Text of this article is available as a PDF (157.5 KB).
Figure 1 Clinical Benchmarking Company Pathology Report: annual cycle for data collection and analysis.

Figure 2 Test to request ratios for (A) biochemistry, (B) haematology, and (C) microbiology. Each point represents a single department.
Figure 3 Medical productivity in haematology: requests for each whole time equivalent medical consultant. Each point represents a single department.
Figure 4 Non-medical productivity in microbiology: requests for each non-medical/non-clinical scientist whole time equivalent—that is, for each whole time equivalent medical laboratory scientific officer/medical laboratory assistant (open bars) and for each whole time equivalent medical laboratory scientific officer (closed diamonds). Each bar and point represents a department.
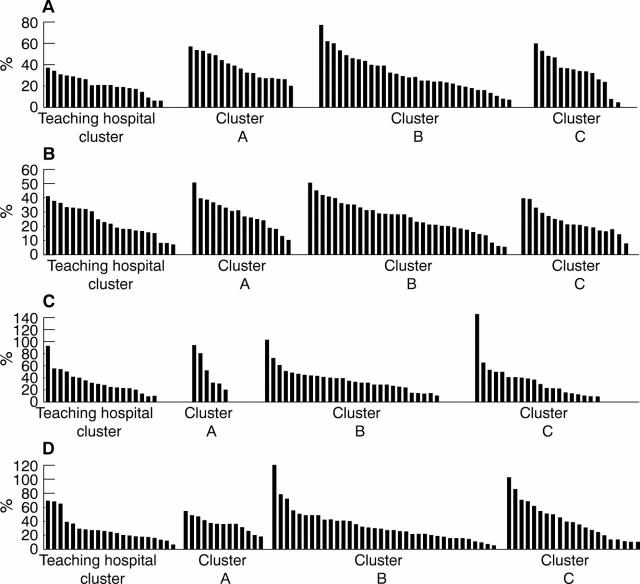
Figure 5 Percentage of medical laboratory assistants to medical laboratory scientific officers for each of the main disciplines within pathology:(A) biochemistry, (B) haematology, (C) microbiology, and (D) histology. Each bar represents a department.
Figure 6 Total weekly normal working hours in categories 1 (open bars: the department is open for its full repertoire of services with staff working their weekly contractual hours) and 2 (closed bars: the department is open for a restricted service with fewer staff but who are working their weekly contractual hours). (A) Biochemistry, (B) haematology.
Figure 7 Q-Probes information cycle.
Figure 8 Q-Probes 1997: routine outpatient test turnaround time (TAT), individual laboratory report. The closed diamond shape indicates the results from the laboratory at Bishop Aukland.
Figure 9 Q-Probes 1997: routine outpatient test turnaround time (TAT), UK report. The closed diamond shape indicates the results from the laboratory at Bishop Aukland.
Figure 10 Q-Probes 1998: outpatient test order accuracy, individual laboratory report. The closed diamond shape indicates the results from the laboratory at Bishop Aukland.


