Abstract
Understanding the chemistry of protein modification by formaldehyde is central to developing improved methods to recover proteins from formalin-fixed paraffin-embedded tissues for proteomic analysis and to improve protein immunoreactivity for immunohistochemical studies. We used biophysical techniques to investigate the effects of formaldehyde treatment on bovine pancreatic ribonuclease A (RNase A). Treatment of RNase A with formaldehyde was shown by gel electrophoresis to lead to the rapid formation of intra- and intermolecular protein cross-links. Thermal studies revealed that these protein cross-links significantly increased the thermal denaturation temperature of RNase A preparations. Analysis of formaldehyde-treated RNase A oligomers isolated by gel chromatography revealed that intramolecular protein cross-links are primarily responsible for the increase in protein thermostability. Formaldehyde treatment also lowered the isoelectric point of the enzyme from 9.45 to the 6.0–7.4 range. Optical spectroscopic studies demonstrated that the formaldehyde-induced modifications did not significantly alter the secondary or tertiary structure of RNase A. Heating formaldehyde-treated RNase A at 65°C resulted in a significant reversal of the protein intra- and intermolecular cross-links and led to a partial restoration of enzymatic activity.
Keywords: formalin fixation, antigen retrieval, immunohistochemistry, ribonuclease A, enzyme histochemistry
Formalin fixation remains the pre-eminent technique for processing tissue specimens for pathologic examination, for the study of tissue morphology, and for archival preservation.1 Indeed, some repositories now contain millions of formalin-preserved whole or paraffin-embedded tissue specimens, which provide an invaluable source for retrospective studies of disease progression and for correlating patient outcome with treatment protocols. The great advantage afforded by formalin fixation in preserving tissue morphology has been offset in part by the realization that formalin fixation reduces immunohistochemical reactivity2 and has thwarted the ability to extract proteins from formalin-fixed tissues for proteomic analysis.3
In the early 1990s a series of techniques, referred to collectively as antigen retrieval (AR), were introduced. These techniques allow the partial recovery of immunoreactivity from formalin-fixed paraffin-embedded tissue sections by exposing the sections to high temperatures for brief periods in the presence of buffer or protein denaturant solutions.4–6 Subsequently, AR methods have found widespread use in immunohistochemistry, and numerous studies have been published addressing the important parameters of the technique.7–12 Although AR methods are effective for recovering many masked antigens in formalin-fixed paraffin-embedded tissue sections, the technique has a number of shortcomings. The staining intensity of some antigens is reduced with prolonged heating,13 whereas other antigens are undetectable even with prolonged AR treatment.9 Additionally, there is significant variability in the AR conditions required for unmasking a given antigen in different tissue types and for unmasking different antigens within the same tissue type.10 These complications require a considerable investment in time and materials to optimize the retrieval conditions for each antigen and tissue.14 Results vary from lab to lab and frequently depend upon the conditions used for tissue fixation. To date, improvements in the AR technique have been derived through empirical means, with little understanding of the effects of formalin fixation on protein antigenicity15 or the mechanism whereby antigen unmasking is achieved during AR treatment.
Although numerous mechanisms have been put forth to explain antigen unmasking by AR methods,4,16,17 they remain speculative because tissue sections are too complex to allow for a detailed understanding of the behavior of individual molecules. It is clear that a detailed understanding of the mechanisms of AR can only be obtained by studying the effect of formalin fixation and AR methods on the chemical properties of isolated proteins and relating these findings to the immunoreactivity of the proteins.18 In this article, we present data on the effects of formalin fixation and demodification by heat treatment on the structural, thermal, and functional properties of bovine pancreatic ribonuclease A (RNase A).
Materials and methods
Reactions and Treatment of Samples
Bovine pancreatic RNase A (type III-A) from Sigma Chemical Co. (St Louis, MO, USA) was dissolved in 75 mM potassium phosphate buffer (pH 7.4) and dialyzed against the same buffer using a Spectra/Por cellulose ester dialyzer with a molecular weight cut-off of 5 kDa (Spectrum Laboratories, Rancho Dominguez, CA, USA). The RNase A concentration was determined spectrophotometrically assuming that E1% = 6.9 at 280 nm.19 Reactions of RNase A and formaldehyde (cat. no. BP531, Fisher Scientific, Pittsburgh, PA, USA) were studied at both high and low concentrations of protein and formaldehyde as described below.
For the high-concentration studies, 9 volumes of RNase A stock solution, 7.22 mg/ml, were mixed with 1 volume of 37% formaldehyde. The reaction mixture was kept at 23 ± 1°C in a light-protected microtest vial and examined by a number of techniques over a period of 9 days. For differential scanning calorimetry (DSC) and sodium dodecyl sulfate-polyacrylamide gel electrophoresis (SDS–PAGE) studies, aliquots of the RNase A-formalin solutions were frozen at −20°C at various time points during the 9-day incubation at 23°C. At the end of the 9-day incubation period, all the aliquots were thawed and dialyzed together in the same beaker against 75 mM potassium phosphate buffer (pH 7.4) in Slide-A-Lyzer dialysis cassettes with a molecular weight cut-off of 3.5 kDa (Pierce, Rockford, IL, USA). After spectrophotometric determination of the protein concentration, the samples were subjected to DSC and SDS–PAGE as described below.
For the low-concentration studies, the reaction mixture was formed from equal volumes of RNase A solution, 2 mg/ml, in 10 mM potassium phosphate buffer (pH 7.3) and 10% buffered formalin (pH 7.3). After a 24-h incubation in formalin, modified RNase A was freed of excess formaldehyde by dialysis and used to study the effect of the duration of dialysis and the effect of heat treatment on the restoration of the RNase A enzymatic activity lost by treatment with formaldehyde.
Spectroscopic Measurements
Circular dichroism (CD) spectra in the far-UV region, 174–250 nm, were acquired from the undiluted reaction mixture using a 0.02-mm path length cell. CD spectra in the near-UV region, 245–350 nm, were recorded using a 10-mm path length cell with the reaction mixture diluted 10-fold with 75 mM potassium phosphate buffer. The CD spectra were recorded with a Jasco-715 spectropolarimeter (Jasco Corp., Tokyo, Japan). Each spectrum was an average of two measurements taken under identical conditions. The following settings were used: the scan speed was 20 nm/min, the band width was 1 nm, the resolution was 0.1 nm, and the response time was 4 s.
UV absorption spectra were recorded between 220 and 320 nm with a Beckman DU 600 single-beam spectrophotometer (Beckman Instruments, Fuller-ton, CA, USA) at a scan speed of 240 nm/min. Spectra were recorded using a 10-mm path length cell; the reaction mixture was diluted 10-fold with 75 mM potassium phosphate buffer. Fluorescence spectra between 280 and 400 nm were obtained with a Jasco FP-777 spectrofluorometer at a scan speed of 200 nm/min. The excitation wavelength was 277 nm, and the slit width for both excitation and emission was 10 nm. Spectra were recorded using a 2-mm path length cell.
Differential Scanning Calorimetry
Temperature-induced conformational changes in native or formaldehyde-treated RNase A, 0.5–1.0 mg/ml, were recorded with a model 5100 Nano differential scanning calorimeter (Calorimetry Science Corp., American Fork, UT, USA) at a heating rate of 1°C/min and under a pressure of 3 atm. Prior to scanning, all samples were extensively dialyzed, and the external dialysis solutions were used to fill the reference cell of the calorimeter. The denaturation temperature (Td) was defined as the temperature corresponding to the maximum excess heat absorption observed during the protein endothermic denaturation transition.
Gel Electrophoresis
Protein samples were denatured at 70°C for 10 min in sample buffer (pH 8.5) containing 50 mM dithiothreitol and 2% lithium dodecyl sulfate. SDS–PAGE was run at neutral pH on NuPAGE Bis-Tris precast gradient (4–12%) polyacrylamide gels, 1 mm × 80 mm × 80 mm (Invitrogen, Carlsbad, CA, USA). The running buffer was 50 mM Tris, 50 mM 2-(N-morpholino) ethanesulfonic acid (MES), 0.1% SDS, and 1 mM EDTA (MES SDS, Invitrogen). In addition to the running buffer, the cathode chamber contained NuPAGE antioxidant (Invitrogen). The 2.5–200 kDa molecular mass standards and the Coomassie blue-based colloidal staining kit were from Invitrogen. Gel images were documented using a Scanjet 5470c (Hewlett Packard Co., Palo Alto, CA, USA).
Column Chromatography
RNase A, 4 mg/ml, was incubated in neutral 10% formalin for 24 h, freed of formaldehyde by dialysis, and concentrated four-fold on a Microcon YM-10 centrifugal filter device (Millipore, Bedford, MA, USA). The sample was then injected into an HR 16/50 column filled with prep grade Superdex 75 (Pharmacia Biotech, Uppsala, Sweden). The column was eluted with 0.15 M KCl, 50 mM phosphate buffer (pH 7.4) with the use of a model 715 HPLC system (Gilson Medical Electronics, Middleton, WI, USA). The flow rate was 76 μl/min, and fractions were collected for 10 min.
Isoelectric Focusing
Isoelectric focusing (IEF) gel electrophoresis was performed on precast vertical Novex pH 3–10 IEF 5% polyacrylamide gels (Invitrogen) according to the manufacturer’s protocol. Aliquots of formaldehyde-treated RNase A and aliquots of its monomeric and oligomeric fractions separated by chromatography were dialyzed against 20 mM KCl before being loaded onto the gel. The isoelectric point (pI) markers (SERVA liquid mix IEF marker 3–10) were obtained from Invitrogen.
Assay for RNase A Enzymatic Activity
The enzymatic activity of native or formalin-treated RNase A was determined using cytidine 2′,3′-cyclo-phosphate (Sigma) as the substrate (0.1 mg/ml) according to the procedure outlined by Crook et al.20 The rate of hydrolysis of cytidine 2′,3′-cyclopho-sphate was measured at 286 nm using a Beckman DU 600 spectrophotometer. TAE buffers at pH 4, 7, and 9 were prepared by titrating 40 mM Tris solution containing 1 mM EDTA with glacial acetic acid.
Results and discussion
Formation of Intra- and Intermolecular Cross-links in Formalin-treated RNase A
Bovine pancreatic RNase A is a single polypeptide composed of 124 amino-acid residues21 of which eight different residues—Arg, Asn, Gln, His, Lys, Ser, Thr, and Tyr—can, in principle, be modified by reaction with formaldehyde. The cross-linking process is initiated by a very fast reaction of formaldehyde with the ɛ-amino group of Lys. The resulting N-hydroxymethyl group (also called amino methylol) exists in equilibrium with trace amounts of protonated Schiff’s base, –N+H = CH2, and the highly reactive electrophile, –NH–C+H2, which attacks available nucleophiles to form short methylene (–CH2–) bridges.22 All 10 Lys residues of RNase A are accessible for reaction with formaldehyde.23
The progressive formation of RNase A intra- and intermolecular cross-links with time in neutral 10 and 5% formalin was followed by gradient SDS–PAGE as shown in Figure 1a and b, respectively. RNase A samples at 6.5 mg/ml were freed of formaldehyde by fast thin-layer dialysis, denatured at 70°C for 10 min in the presence of dithiothreitol and lithium dodecyl sulfate, and fractionated according to the size of the RNase oligomers. As shown in Figure 1a, lane 2, RNase A dimers, trimers, and tetramers appeared after just 20 min of incubation with formalin. Lanes 3–7 reveal a steady accumulation of oligomers with more than five cross-linked proteins over a period of 9 days and an increase in the fraction retained at the top of the gel. Simultaneously, the fraction of monomer (some of which was liberated from RNase oligomers during the 10-min heating in the denaturation step) decreases as shown by a decrease in the intensity of the band of approximately 14.4 kDa in lanes 3–7 of Figure 1a. The only consequence of intramolecular cross-linking was an increase in the mobility of formaldehyde-modified monomeric RNase A (Figure 1a, lanes 2–7) relative to untreated enzyme (Figure 1a, lane 1). In the absence of disulfide bridges (due to the reducing conditions of the SDS–PAGE), the formaldehyde-treated enzyme remains more compact than the native enzyme.
Figure 1.
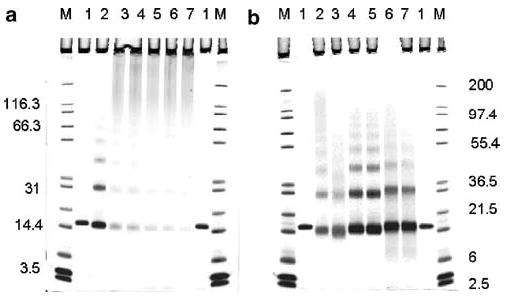
(a) SDS–PAGE of RNase A at 6.5 mg/ml before (lane 1) and after incubation in 10% buffered formalin for 0.3 (lane 2), 23.4 (lane 3), 47.5 (lane 4), 71.9 (lane 5), 138.8 (lane 6), and 210.5 (lane 7) h at 23°C. (b) SDS–PAGE of native RNase A at 1 mg/ml (lane 1) and 5% formaldehyde-modified RNase A having undergone different treatments (lanes 2–7). Lanes: 2, reaction mixture; 3, reaction mixture after DSC; 4 and 5, reaction mixture after 1 and 4 days of dialysis; 6 and 7, as 4 and 5, but recovered after DSC; M, molecular mass markers, kDa.
Additional features of formaldehyde-treated RNase A are shown in Figure 1b. Here the enzyme, 1 mg/ml, was kept in neutral 5% formalin for 1 day, and an aliquot of the reaction mixture was electrophoresed prior to dialysis (lane 2). Modified proteins are known to lose part of their bound formaldehyde upon prolonged dialysis.24 Therefore, two aliquots of the same mixture were analyzed after 1 and 4 days of dialysis (lanes 4 and 5, respectively). As shown in Figure 1b, these different treatments affected neither the composition of the intermolecular cross-linked oligomers nor their relative positions in the molecular mass scale, although fewer intermolecular cross-links were observed in the dialyzed samples (presumably due to hydrolysis). Samples of the reaction mixtures examined in lanes 2, 4, and 5 were heated from 25 to 100°C, kept at 100°C for 10 min, and then cooled down to 25°C. A rate of 1°C/min was used for both heating and cooling of the aliquots to match the conditions employed for DSC, as described below. The fraction of the oligomers with more than five cross-linked proteins decreased significantly in all samples. However, there were different effects on intramolecular cross-linking as can be seen by comparing the mobility of the monomer bands in lanes 2 vs 3, 4 vs 6, and 5 vs 7. Specifically, intramolecular cross-linking was increased by heating in the presence of formaldehyde (lane 3) and decreased in the samples that were dialyzed prior to heating (lanes 6 and 7). In addition, a decrease in intermolecular cross-linking was also observed in lanes 6 and 7, reflecting reversal of this fixation effect by an antigen-retrieval procedure. Native RNase A is shown for reference in lane 1 of Figure 1b.
Effect of Formalin on the Thermal Properties of RNase A
Cross-linking constrains the conformational flexibility of biopolymers and, as a rule, leads to higher thermostability of their secondary, tertiary, and quaternary structures.25 We used DSC to compare the heat-induced conformational transitions of selected RNase A samples that were characterized in Figure 1a. Curve 1 in Figure 2 is the profile of native RNase A, which exhibits a Td of 65.1°C in neutral phosphate buffer. At temperatures above the denaturation transition, irreversible but still soluble aggregates are formed.26 The descending heat flow in curve 1 that follows the transition peak may arise from this aggregation. Profiles 2 and 3 in Figure 2 describe the thermal denaturation of RNase A that was kept in 10% formalin for 2 and 6 days, respectively, and then freed of formaldehyde by dialysis. As shown, cross-linking shifts the denaturation profiles toward higher temperatures. The data shown in Figure 3 summarize the time course of the Td increase over the entire period of incubation. The main increase in thermostability occurred during the first 24 h of reaction with formaldehyde.
Figure 2.
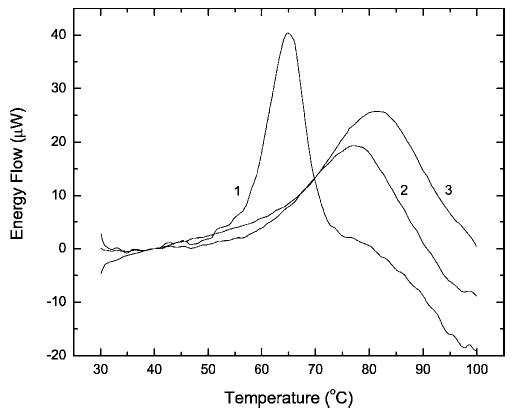
Heat absorption in solutions of native RNase A (profile 1) and RNase A kept in 10% buffered formalin for 47.5 (profile 2) and 138.8 h (profile 3) at pH 7.4 and 23°C. All samples were dialyzed against 75 mM potassium phosphate buffer (pH 7.4) prior to DSC. The protein concentration was 0.65 (profile 1) or 0.69 mg/ml (profiles 2 and 3).
Figure 3.
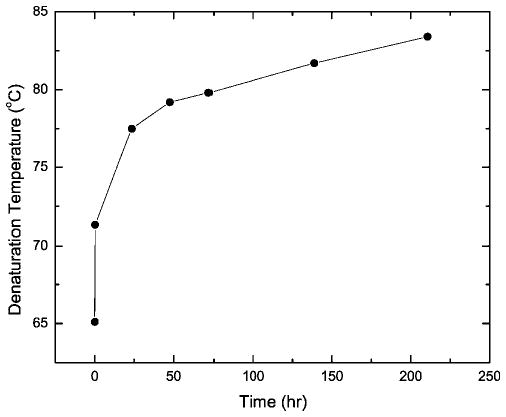
Dependence of RNase A Td of the dialyzed samples on time of incubation in 10% buffered formalin at pH 7.4 and 23°C.
Using DSC, we also compared the Td values for samples incubated in 5% formalin and then dialyzed for 1 or 4 days. Despite minor differences in the widths of the thermal transitions (profiles not shown), both were centered at 76.5°C. As modified monomeric RNase A predominates in these samples (see lanes 4 and 5 in Figure 1b), this suggests that intramolecular cross-linking is responsible for the increase in thermostability. RNase A already possesses four intrinsic cross-links: Cys26–Cys84, Cys40–Cys95, Cys58–Cys110, and Cys65–Cys72. Experiments with enzyme variants, where each cystine was independently replaced with a pair of Ala residues, showed that removing just one cross-link, either Cys26–Cys84 or Cys58–Cys110, resulted in a decrease of the Td by almost 40°C.27 To explore this further, a mixture of oligomers formed by incubating RNase A with formalin was fractionated by gel filtration. This resulted in a fully resolved monomer and dimer, as well as a fraction consisting of a mixture of oligomers with more than five cross-linked molecules. Fractions corresponding to the monomer, dimer, and higher oligomers were analyzed individually by DSC. Several conclusions can be derived from the resulting thermal transition profiles shown in Figure 4: (i) the difference in the Td values of the modified RNase monomer (curve 1) and the higher oligomers (curve 3) does not exceed 2–3°C, (ii) intermolecular cross-linking noticeably broadens the thermal transition (possibly because of the increased microheterogeneity), and (iii) neither intra- nor intermolecular cross-linking prevents the high-temperature aggregation of the enzyme. SDS–PAGE of the samples prior to the DSC experiment (lanes 1–3 in Figure 5) and after the DSC scans (lanes 4–6) demonstrated that heating above 100°C almost completely destroyed the cross-linking in the RNase oligomers. This can be seen by comparing the bands in lanes 2 and 3 with those in lanes 5 and 6 of Figure 5.
Figure 4.
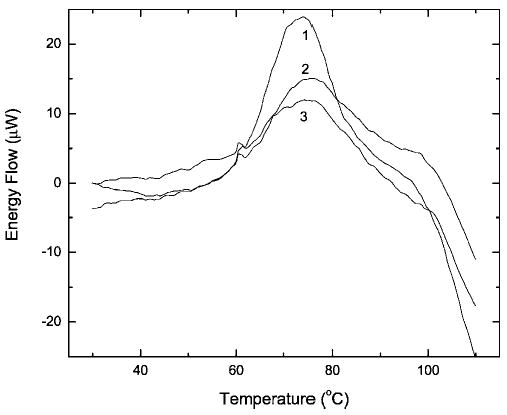
Heat absorption of solutions of formaldehyde-treated RNase A chromatography fractions: 1, monomer; 2, dimer; 3, mixture of oligomers higher than pentamers. The protein concentration was 0.55 (profile 1), 0.36 (profile 2), or 0.37 mg/ml (profile 3).
Figure 5.
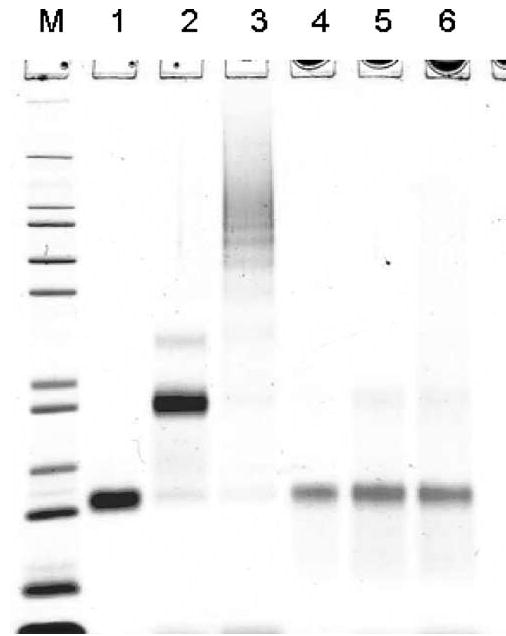
SDS–PAGE of formaldehyde-treated RNase A fractions taken before (lanes 1–3) and recovered after (lanes 4–6) DSC. Lanes: 1 and 4, monomer; 2 and 5, dimer; 3 and 6, mixture of oligomers higher than pentamers; M, molecular mass markers as in Figure 1.
Effect of Formalin on the Ionization State of RNase A
RNase A is a basic protein with a pI of 9.45 and a net positive charge in neutral solution.28 However, formaldehyde-treated RNase was not adsorbed by a cation exchanger when we attempted to use SO−3 polystyrene-based resin (SOURCE 15S, Amersham Pharmacia Biotech) for chromatography. To explore this further, RNase A was treated with 5% formalin and analyzed by IEF gel electrophoresis. Figure 6a shows that the pI values were shifted into the pH 6.0–7.4 range. Figure 6b shows the results of IEF on the RNase A fractions isolated by gel chromatography. The trimer and higher RNase oligomers are grouped at the lower limit of this pH range, indicating the further involvement of basic amino acid residues in intermolecular cross-linking. The abundance of discrete bands shown in Figure 6b reflects the microheterogeneity within the fractions.
Figure 6.

IEF of formaldehyde-treated RNase A (A) and its fractions (B) separated by gel filtration. (a) Lanes: M, IEF markers; 1, unfractionated formaldehyde-treated RNase A. (b) Lanes: M, IEF markers; 1, monomer; 2, dimer; 3, trimer; 4, tetramer; 5, pentamer.
Effect of Formalin on the Secondary and Tertiary Structure of RNase A
In the preceding sections, we evaluated the formation of intra- and intermolecular cross-links, changes in the protein ionization state, and changes in protein thermal stability produced by treating RNase A with formalin at neutral pH. We next examined the structural properties of formaldehyde-reated RNase A using optical spectroscopic methods. The secondary structure of RNase A consists of one long four-stranded antiparallel β-sheet and three short α-helixes,29 which places RNase A in the α + β structural class of proteins. The effect on the secondary structure of the protein by a 9-day incubation of RNase A (6.5 mg/ml) in 10% formalin was examined with far-UV CD spectroscopy (Figure 7). The resulting changes are shown by the difference spectrum (curve 3) derived by subtraction of the native enzyme spectrum (curve 1) from the spectrum of the incubated RNase A (curve 2). The decrease in the negative band intensity and the associated decrease in the positive band intensity are both indicative of a subtle secondary structure perturbation. Similar small changes, seen at the very beginning of the native enzyme disorder transition, have previously been associated with (i) the partial unfolding of helix II (residues 24–34) and possibly also the β-segment 43–49,30 or (ii) with a loosening of the interaction of helix I (residues 3–13) with the major hydrophobic protein core.31
Figure 7.
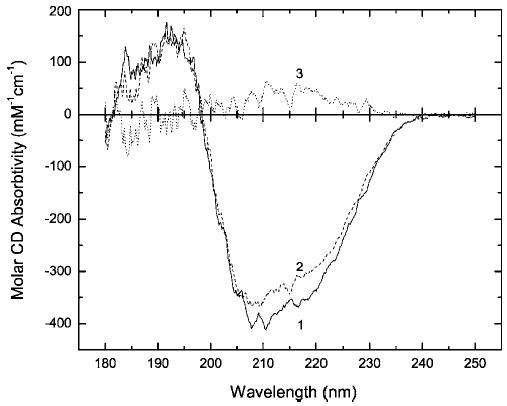
Far-UV CD spectra of native RNase A (profile 1) and RNase A (6.5 mg/ml) kept in 10% buffered formalin (pH 7.4) at 23°C for 210.4 h (profile 2), and their difference spectrum (profile 3). Spectrum 2 was recorded from the undiluted reaction mixture.
The UV absorbance, near-UV CD, and fluorescence spectra of RNase A are largely determined by six Tyr residues,32 three of which (Tyr25, Tyr92, Tyr97) are buried within the interior of the protein. Exposed Tyr73, Tyr76, and Tyr115 are available to react with formaldehyde and/or activated Lys residues. Our data suggest that, upon prolonged incubation in formalin, a small fraction of these residues become modified by such chemical reactions. This conclusion is based upon the appearance of a weak broad band in the UV absorbance spectrum (not shown) near 300 nm and a relative increase in absorbance at 250 nm, both of which are similar to changes that accompany alkaline titration of RNase A when exposed Tyr residues become ionized.33
In the near-UV CD spectra (Figure 8), the partially resolved band at 283 nm is attributed to the exposed Tyr residue(s) of the enzyme.32 Therefore, the 10% decrease in the intensity of this band caused by the 9-day incubation with 10% formalin may also reflect changes affecting the Tyr residues. The decrease in intensity could be explained by either a partial exposure of buried Tyr25 and/or an increase in the distance between Tyr73 and Tyr115 within the RNase A tertiary structure.32,34
Figure 8.
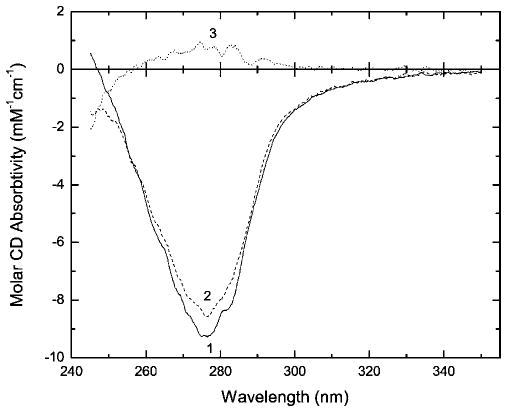
Near-UV CD spectra of native RNase A (profile 1) and RNase A (6.5 mg/ml) kept in 10% buffered formalin (pH 7.4) at 23°C for 210.5 h (profile 2), and their difference spectrum (profile 3). Spectrum 2 was recorded from a 10-fold diluted aliquot of the reaction mixture.
In native proteins, Tyr fluorescence emission at 304 nm may be quenched by factors such as the presence of nearby charged amino-acid residues or the involvement of the Tyr hydroxyl group in hydrogen bond formation.35 In our experiments, formaldehyde-induced modifications can, in principle, alter Tyr emission by either chemically modifying the Tyr residue’s microenvironment or by changing the secondary or tertiary structure of the enzyme. The 10% increase in Tyr fluorescence (not shown) that accompanies prolonged incubation in formaldehyde solution probably reflects contributions from both factors.
In summary, our optical spectroscopic studies reveal that formalin treatment leaves the secondary and tertiary structure of RNase A essentially intact.
Recovery of RNase A Enzymatic Activity
The results of our study demonstrate that protein modifications produced by formalin treatment can be significantly reversed by heating the proteins at elevated temperatures. This suggests that protein immunoreactivity and function could be recovered by prolonged heating of formalin-treated proteins, particularly if the incubation temperature is kept below the Td of the formalin-modified protein. To test this concept, formalin-treated RNase A that had been freed of excess formaldehyde by dialysis was incubated at elevated temperatures, and the recovery of enzymatic activity was assayed with the minimal substrate, cytidine 2′,3′-cyclophosphate. As shown in Figure 9, incubation in buffer at 50°C does lead to a recovery of activity, but at a rate of only 1.2%/h. When the temperature was raised to 65°C, the rate of activity recovery increased to 3.5%/h. The effect of pH on the recovery of enzymatic activity at 65°C is shown in Figure 10. An acidic medium provides a faster and more complete enzymatic recovery than a neutral or basic medium. In this context, it is interesting to note that AR methods using alkaline buffers generally yield a stronger immunogenic response than do acidic buffers.8 It is possible to reconcile these observations by suggesting that some formaldehyde-modified antigens tend to aggregate in acidic medium, thus masking their more efficient de-modification at low pH. The recovery of RNase A enzymatic activity is likely to be correlated with the reversal of protein modifications that occur when the formalin-treated enzyme is incubated at elevated temperatures in formaldehyde-free buffers. The recovery of immunoreactivity from formalin-treated RNase A is detailed in the accompanying paper.36
Figure 9.
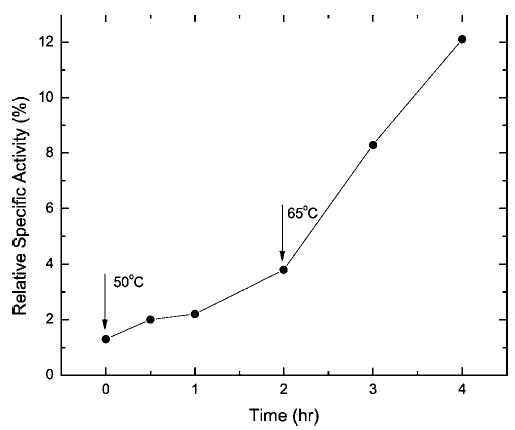
Time course of the activity restoration of the formaldehyde-treated RNase A during incubation at 50°C (0–2 h) and 65°C (2–4 h) in TAE buffer (pH 7.0).
Figure 10.
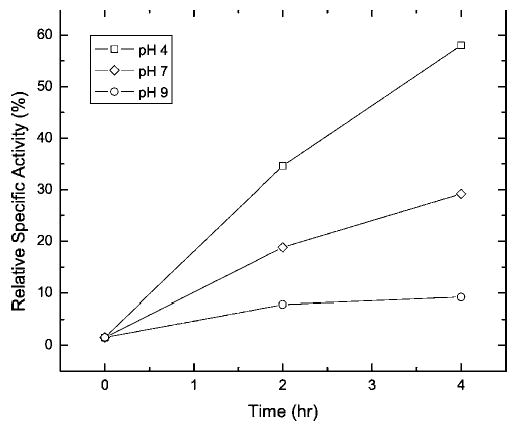
Time course of the activity restoration of the formaldehyde-treated RNase A during incubation at 65°C in TAE buffers of various pH values.
Acknowledgments
We thank Dr Marilyn J Mason for her excellent editorial assistance in the preparation of this manuscript. This work was supported in part by a grant from the National Cancer Institute (1R21 CA091227-01) and by the American Registry of Pathology.
References
- 1.Fox CH, Johnson FB, Whiting J, et al. Formaldehyde fixation. J Histochem Cytochem. 1985;33:845–853. doi: 10.1177/33.8.3894502. [DOI] [PubMed] [Google Scholar]
- 2.Taylor CR. Immunomicroscopy: a Diagnostic Tool for the Surgical Pathologist. W. B. Saunders; Philadelphia, PA: 1986. [Google Scholar]
- 3.Conti CJ, Larcher F, Chesner J, et al. Polyacrylamide gel electrophoresis and immunoblotting of proteins extracted from paraffin-embedded tissue sections. J Histochem Cytochem. 1988;36:547–550. doi: 10.1177/36.5.3282007. [DOI] [PubMed] [Google Scholar]
- 4.Shi SR, Key ME, Kalra KL. Antigen retrieval in formalin-fixed, paraffin-embedded tissues: an enhancement method for immunohistochemical staining based on microwave oven heating of tissue sections. J Histochem Cytochem. 1991;39:741–748. doi: 10.1177/39.6.1709656. [DOI] [PubMed] [Google Scholar]
- 5.Malmstrom PU, Wester K, Vasko J, et al. Expression of proliferative cell nuclear antigen (PCNA) in urinary bladder carcinoma. Evaluation of antigen retrieval methods APMIS. 1992;100:988–992. doi: 10.1111/j.1699-0463.1992.tb04030.x. [DOI] [PubMed] [Google Scholar]
- 6.Suurmeijer AJ, Boon ME. Notes on the application of microwaves for antigen retrieval in paraffin and plastic tissue sections. Eur J Morphol. 1993;31:144–150. [PubMed] [Google Scholar]
- 7.Shi SR, Imam SA, Young L, et al. Antigen retrieval immunohistochemistry under the influence of pH using monoclonal antibodies. J Histochem Cytochem. 1995;43:193–201. doi: 10.1177/43.2.7822775. [DOI] [PubMed] [Google Scholar]
- 8.Taylor CR, Shi SR, Chen C, et al. Comparative study of antigen retrieval heating methods: microwave, microwave and pressure cooker, autoclave, and steamer. Biotech Histochem. 1996;71:263–270. doi: 10.3109/10520299609117171. [DOI] [PubMed] [Google Scholar]
- 9.Shi SR, Cote RJ, Taylor CR. Antigen retrieval immunohistochemistry: past, present, and future. J Histochem Cytochem. 1997;45:327–343. doi: 10.1177/002215549704500301. [DOI] [PubMed] [Google Scholar]
- 10.Pileri SA, Roncador G, Ceccarelli C, et al. Antigen retrieval techniques in immunohistochemistry: comparison of different methods. J Pathol. 1997;183:116–123. doi: 10.1002/(SICI)1096-9896(199709)183:1<116::AID-PATH1087>3.0.CO;2-2. [DOI] [PubMed] [Google Scholar]
- 11.Chaiwun B, Shi SR, Cote RJ, et al. Major factors that influence the effect of AR immunohistochemistry. In: Shi SR, Jiang G, Taylor CR, editors. The Antigen Retrieval Technique: Applications in Immunohistochemistry. BioTechniques Press; Westborough, MA: 2000. pp. 41–53. [Google Scholar]
- 12.Shi SR, Cote RJ, Taylor CR. Antigen retrieval techniques: current perspectives. J Histochem Cytochem. 2001;49:931–937. doi: 10.1177/002215540104900801. [DOI] [PubMed] [Google Scholar]
- 13.Lan HY, Mu W, Nikolic-Paterson DJ, et al. A novel, simple, reliable, and sensitive method for multiple immunoenzyme staining: use of microwave oven heating to block antibody crossreactivity and retrieve antigens. J Histochem Cytochem. 1995;43:97–102. doi: 10.1177/43.1.7822770. [DOI] [PubMed] [Google Scholar]
- 14.Shi SR, Cote RJ, Yang C, et al. Development of an optimal protocol for antigen retrieval: a ‘test battery’ approach exemplified with reference to the staining of retinoblastoma protein (pRB) in formalin-fixed paraffin sections. J Pathol. 1996;179:347–352. doi: 10.1002/(SICI)1096-9896(199607)179:3<347::AID-PATH559>3.0.CO;2-L. [DOI] [PubMed] [Google Scholar]
- 15.Puchtler H, Meloan SN. On the chemistry of formaldehyde fixation and its effects on immunohistochemical reactions. Histochemistry. 1985;82:201–204. doi: 10.1007/BF00501395. [DOI] [PubMed] [Google Scholar]
- 16.Morgan JM, Navabi H, Schmid KW, et al. Possible role of tissue-bound calcium ions in citrate-mediated high-temperature antigen retrieval. J Pathol. 1994;174:301–307. doi: 10.1002/path.1711740410. [DOI] [PubMed] [Google Scholar]
- 17.Shi SR, Jiang G, Turrens JF, et al. Development of the AR technique: philosophical and theoretical basis. In: Shi SR, Jiang G, Taylor CR, editors. The Antigen Retrieval Techniques: Applications in Immunohistochemistry. BioTechniques Press; Westborough, MA: 2000. pp. 17–39. [Google Scholar]
- 18.Mason JT, O’Leary TJ. Effects of formaldehyde fixation on protein secondary structure: a calorimetric and infrared spectroscopic investigation. J Histochem Cytochem. 1991;39:225–229. doi: 10.1177/39.2.1987266. [DOI] [PubMed] [Google Scholar]
- 19.Pace CN, Vajdos F, Fee L, et al. How to measure and predict the molar absorption coefficient of a protein. Protein Sci. 1995;4:2411–2423. doi: 10.1002/pro.5560041120. [DOI] [PMC free article] [PubMed] [Google Scholar]
- 20.Crook EM, Mathias AP, Rabin BR. Spectrophotometric assay of bovine pancreatic ribonuclease by the use of cytidine 2′,3′-phosphate. Biochem J. 1960;74:234–238. doi: 10.1042/bj0740234. [DOI] [PMC free article] [PubMed] [Google Scholar]
- 21.Raines RT. Ribonuclease A. Chem Rev. 1998;98:1045–1066. doi: 10.1021/cr960427h. [DOI] [PubMed] [Google Scholar]
- 22.Kunkel GR, Mehrabian M, Martinson HG. Contact-site cross-linking agents. Mol Cell Biochem. 1981;34:3–13. doi: 10.1007/BF02354846. [DOI] [PubMed] [Google Scholar]
- 23.Brown LR, Bradbury JH. Proton-magnetic-resonance studies of the lysine residues of ribonuclease A. Eur J Biochem. 1975;54:219–227. doi: 10.1111/j.1432-1033.1975.tb04131.x. [DOI] [PubMed] [Google Scholar]
- 24.Gustavson KH. The Chemistry of Tanning Processes. Aldehyde Tanning. Academic Press; New York: 1956. pp. 244–282. [Google Scholar]
- 25.Volkin DB, Klibanov AM. Minimizing protein inactivation. In: Creighton TE, editor. Protein Function: a Practical Approach. IRL Press; New York, NY: 1989. pp. 1–24. [Google Scholar]
- 26.Tsai AM, van Zanten JH, Betenbaugh MJ. I. Study of protein aggregation due to heat denaturation: a structural approach using circular dichroism spectroscopy, nuclear magnetic resonance, and static light scattering. Biotechnol Bioeng. 1998;59:273–280. [PubMed] [Google Scholar]
- 27.Klink TA, Woycechowsky KJ, Taylor KM, et al. Contribution of disulfide bonds to the conformational stability and catalytic activity of ribonuclease A. Eur J Biochem. 2000;267:566–572. doi: 10.1046/j.1432-1327.2000.01037.x. [DOI] [PubMed] [Google Scholar]
- 28.Tanford C, Hauenstein JD. Hydrogen ion equilibria of ribonuclease. J Am Chem Soc. 1956;78:5287–5291. [Google Scholar]
- 29.Wlodawer A, Bott R, Sjölin L. The refined crystal structure of ribonuclease A at 2.0 A ° resolution . J Biol Chem. 1982;257:1325–1332. [PubMed] [Google Scholar]
- 30.Stelea SD, Pancoska P, Benight AS, et al. Thermal unfolding of ribonuclease A in phosphate at neutral pH: deviations from the two-state model. Protein Sci. 2001;10:970–978. doi: 10.1110/ps.47101. [DOI] [PMC free article] [PubMed] [Google Scholar]
- 31.Navon A, Ittah V, Laity JH, et al. Local and long-range interactions in the thermal unfolding transition of bovine pancreatic ribonuclease A. Biochemistry. 2001;40:93–104. doi: 10.1021/bi001945w. [DOI] [PubMed] [Google Scholar]
- 32.Woody RW, Dunker AK. Aromatic and cystine side-chain circular dichroism in proteins. In: Fasman GD, editor. Circular Dichroism and the Conformational Analysis of Biomolecules. Plenum Press; New York: 1996. pp. 109–157. [Google Scholar]
- 33.Tanford C, Hauenstein JD, Rands DG. Phenolic hydroxyl ionization in proteins. II. Ribonuclease. J Am Chem Soc. 1956;77:6409–6413. [Google Scholar]
- 34.Katakura Y, Kumamoto T, Iwai Y, et al. Fluorescence polarization study of a salt bridge between a single-chain Fv and its antigen ribonuclease A. Mol Immunol. 1997;34:731–734. doi: 10.1016/s0161-5890(97)00094-1. [DOI] [PubMed] [Google Scholar]
- 35.Lakowicz JR. Protein Fluorescence. Principles of Fluorescence Spectroscopy. Plenum Press; New York: 1984. pp. 342–381. [Google Scholar]
- 36.Rait VK, Lixin X, O’Leary TJ, et al. Modeling formalin fixation and antigen retrieval with bovine pancreatic RNase A. II. Interrelationship of cross-linking, immunoreactivity, and heat treatment. 2004;84:300–306. doi: 10.1038/labinvest.3700041. [DOI] [PMC free article] [PubMed] [Google Scholar]


