Abstract
A simulation study shows that early protein folding events may be investigated by using a recently developed family of nonlinear infrared techniques that combine the high temporal and spatial resolution of multidimensional spectroscopy with the chirality-specific sensitivity of amide vibrations to structure. We demonstrate how the structural sensitivity of cross-peaks in two-dimensional correlation plots of chiral signals of an α helix and a β hairpin may be used to clearly resolve structural and dynamical details undetectable by one-dimensional techniques (e.g. circular dichroism) and identify structures indistinguishable by NMR.
Keywords: 2DIR, chirality
Probing the complex energy landscape, pathways, and mechanisms of protein folding has been the subject of intense theoretical (1–3) and experimental (4) effort. Major advances have been made over the past two decades by fast-triggering the folding process and monitoring the subsequent real-time dynamics through spectral shifts and strengths of optical transitions. Optical techniques allow the investigation of the formation of the basic peptide structural motiffs as well as protein fast-folding in the pico- to nanosecond time scale, and address critical questions such as what is the ultimate speed limit of the folding. However, they cannot resolve fine details about correlations between different sections of the peptide (intramolecular) and between the peptide and solvent (intermolecular). NMR techniques have a much higher structural resolution but are limited to longer (microsecond) time scales. We present simulations of chirality-induced (CI) signals that take into account structural fluctuations and include spectral line broadening by employing a recently developed simulation protocol (5, 6).
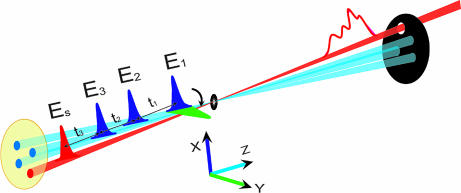
In 2D optical experiments, three ultrashort laser pulses interact with the protein, and the generated coherent nonlinear signal, which depends parametrically on three time delays t1, t2, and t3, is recorded (Fig. 1). Two-dimensional correlation-plots are obtained by a double Fourier transform of the signal with respect to two time delays, holding the third fixed (5). These femtosecond analogues of multidimensional NMR techniques significantly enhance the spectral resolution by spreading the congested transitions of linear absorption in two dimensions (6–8). The cross-peaks (off diagonal peaks in 2D frequency correlation plots) carry signatures of intermode couplings, and their spectral line shapes probe solvent and conformational fluctuations. Optical 2D techniques have been successfully used toward the study hydrogen bonding dynamics (9), weak couplings in bistable molecular structures (10), fast chemical exchange in molecular complexes (11, 12), and energy transport in photosynthetic antennae (13).
Fig. 1.
Pulse configuration for femtosecond coherent infrared correlation spectroscopy. Three laser pulses (light blue) interact with the sample. The fourth pulse (red) is used to detect its nonlinear response. The control parameters are the time intervals between pulses t1,t2,t3. All pulses propagate along z direction (collinear). The nonchiral signal xxxx is generated when all pulses are polarized along x (blue and red). The CI xxxy signal is obtained by switching the first pulse polarization direction to y (green).
We propose here a class of techniques that offer a much higher structural sensitivity to peptide secondary structure motifs by making use of peptide chirality. The main idea is as follows: Optical fields vary in both time and space. Typical molecules are smaller than the optical wavelength and their response is adequately described by assuming that the field is uniform across the molecule: This is known as the dipole (long wavelength) approximation. Taking the spatial variation of the field into account yields new contributions to the response stemming from the variation of the phase of the optical field at different points within the molecule. These contributions, which reflect interferences among signals generated at different parts of the molecules, are typically 1,000 times weaker than the leading (dipole) contributions. This factor is determined by the ratio of protein size and the optical wavelength. However, by choosing certain polarization configurations of the laser fields where the dipole term vanishes, the nondipole corrections generate new background-free signals, which can be readily detected. These signals change their signs upon mirror reflection; hence, they are finite only in chiral systems and vanish in racemates and nonchiral molecules. The difference in the absorption of left- and right-handed circularly polarized light, known as circular dichroism (CD) (14–16), is an important example of such signals in linear spectroscopy, broadly applied for probing the folding states of proteins and their conformational stability. CD spectra can distinguish between various secondary structures of proteins. We show that the structural sensitivity can be greatly enhanced by a judicious choice of polarization configurations of 2D techniques aimed at chiral structures. These CI techniques thus constitute a natural extension of CD to nonlinear spectroscopy.
To appreciate the role of chirality, we describe the optical response of proteins using a model of coupled (vibrational or electronic) assembly of chromophores. Each chromophore is localized on a single peptide group. In the infrared these chromophores are the amide I (C O stretch) vibrational modes, whereas in the UV they represent the n
 π* and π
 π* electronic transitions. The system has two types of chirality: the first is associated with the local geometry of individual residues and the second is related to their global (e.g., helical) arrangement. The latter is expected to dominate the response in extended systems (23). We will neglect the former in the following argument. The absorption spectrum depends on the ensemble-averaged product of two transition dipole vectors 〈μmν2μnν1〉, whereas the CD signal depends on 〈rmnν3μmν2μnν1〉, Here 〈… 〉 denotes orientational averaging of molecules with respect to the lab frame. μm is the νth cartesian component (ν = x, y, z) of transition dipole of the m'th chromophore, and rmnv is the distance between the mth and nth chromophores. Similarly, the nonchiral nonlinear response to three pulses depends on the orientationally averaged product of four dipoles 〈μmν4μnν3μkν2μlν1〉, whereas its CI component depends on products of the form 〈rmnν5μmν4μnν3μkν2μlν1〉. Nonchiral techniques depend on the structure only implicitly through its effect on the frequencies and transition dipoles which affect peak positions and intensities. The explicit coordinate (rmnν) dependence of the chiral response amplifies the cross-peaks and is the reason why these techniques are more sensitive to fine details of the structure.
CD provides a one-dimensional frequency-domain projection of chiral real space configurations; Nonlinear techniques create a multidimensional projection. We shall label a coherent third order experiment, where the three incoming pulses are polarized along the ν1,ν2,ν3 directions and the signal is polarized along ν4, as ν4ν3ν2ν1, (Fig. 1). CI and nonchiral techniques differ by the various choices of νj. For example, xxxx (all pulses polarized along x) is a nonchiral technique. We have identified nine independent CI polarization configurations (17). The signals further depend on the propagation direction and wave vector of the pulses. The following simulations were made for the infrared chiral response of the amide I vibrations (Fig. 1) where all beams propagate collinearly along z. We have neglected the local chirality of each peptide unit (which is reasonable for a planar mode) and only included the global (e.g., helical) chirality. The electronic CD spectra given for comparison were simulated by using Woody's standard model (18), which includes the electric and magnetic moments of the chromophores, and has both local and global chirality.
Results
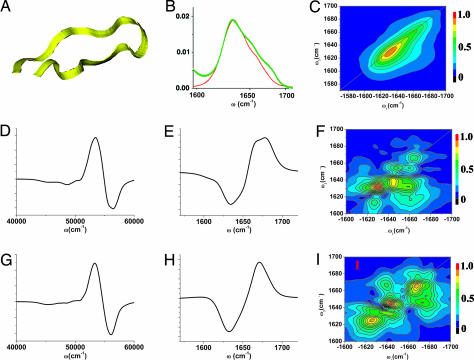
First we show how CI techniques provide information complementary to CD and NMR for a 15 residue hairpin Trpzip4 (Fig. 2A) (19), one of the “Tryptophin Zipper” hairpins. Trpzip4 has a robust, known structure, which makes it an excellent model for the characterization of the vibrational states of peptides in aqueous solution, for the investigation of the relations of the vibrational spectra with peptide conformations, and for the evaluation of the distributions of structures (19). The amide I vibrational band absorption (Fig. 2B) has three poorly resolved features; the 1,635-cm−1 peak and the 1,675-cm−1 shoulder are related to the β structure (19), whereas the 1,655-cm−1 shoulder is related to the turn and coil structures at the two ends. The diagonal peaks of 2D xxxx signals (Fig. 2C) resemble the linear absorption. NMR spectra are routinely used to impose constraints on peptide structure; a distance geometry algorithm is then applied to obtain an ensemble of possible conformers consistent with the NMR data (20). We have selected the first two conformers from the reported 20 NMR-determined Trpzip4 structures (21), which have the lowest energy and are thus the best guess of the structure. The rmsd of these two structures is 1.517 A. The calculated electronic (Fig. 2 D and G) and vibrational CD spectra of these conformers (Fig. 2 E and H) are similar, whereas the 2D CI spectra (Fig. 2 F and I) are different. Conformer I has a strong (1,635 cm−1, 1,655 cm−1) cross-peak, whereas conformer II has a cross-peak at (1,655 cm−1, 1,675 cm−1).
Fig. 2.
Using chirality-induced 2D correlation spectroscopy to discriminate between the hairpin structures indistinguishable by NMR. (A) Fifteen-residue β-hairpin peptide Trpzip4. (B) Simulated (red) and experimental (17) (green) linear absorption of amide I vibrational band. (C) Simulated xxxx 2D signals for the aide I band. (Middle and Bottom) Comparison of the simulated spectra for two configurations drawn from the NMR-determined hairpin structure ensembles. Electronic CD (D and G) of the amide band, vibrational CD (E and H) of the amide I band, and xxxy CI 2D signals (F and I) for the amide I band. The CD signals are similar for the two configurations are shown. Major differences of the 2D signals in the cross-peak region indicate specific couplings among vibrational modes.
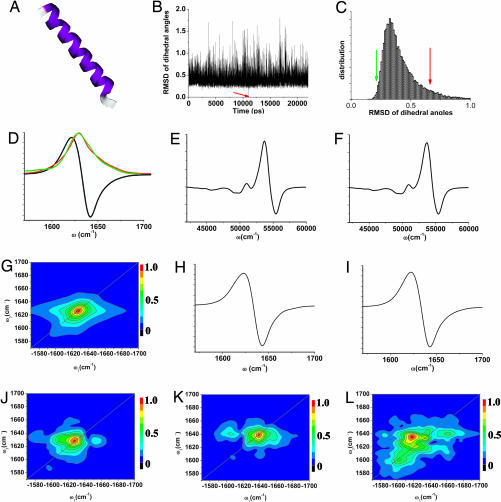
We next consider the 30-residue alpha helical peptide SPE4 (Fig. 3A), whose sub-microsecond helix–coil transition is difficult to detect using NMR and was investigated by tracking the change of the FTIR around 1,630 cm−1 (22). The IR absorption spectrum presented in Fig. 3D has a single peak that only gives a highly averaged signature of the transition dipole arrangement. The diagonal peaks of the nonchiral (Fig. 3G) and the CI (Fig. 3J) 2D signal show the same optical transitions as in the linear absorption, whereas the CI cross-peaks are much better resolved.
Fig. 3.
Chirality-induced 2D correlation signals are more sensitive to the structural fluctuation of a helical peptide in solution compared with one-dimensional CD spectroscopy. Amide I band vibrational spectra of the 30 residue α helix SPE4 (A) simulated using 22,000 snapshots over a 24-ns period. (D) Linear absorption (red, simulated; green, experiment; ref. 20) and CD (black). (G) 2D nonchiral xxxx signal. (J) CI xxxy signal. (B) Simulated RMSD of helix Ramanchandran angles for 22,000 snapshots spanning 24 ns. (C) The distribution of these RMSD. (Left) Simulated spectra for group I (1,000 snapshots left to the green arrow). (E) electronic CD of the amide band. (H) Vibrational CD of the amide I band. (L) xxxy CI 2D signals. (F, I, and L) Same as left column but for the high (right to the red arrow) rmsd group, whereas the ECD and VCD signals are virtually identical. The 2D signals of the two groups are markedly different.
The sensitivity of CI techniques to structural fluctuations is demonstrated by comparing the CD and the 2D xxxy spectra of two ensembles of a helix with different backbone structure distributions. We chose the configuration at the middle point of the 25-ns trajectory (11,000th snapshot) as a reference. The rmsd of the central 24 pairs of Ramanchandran angles with respect to the reference structure were calculated (Fig. 3B) along the trajectory and their distribution is depicted in Fig. 3C. We then selected two 1,000-snapshot subensembles with small rmsd (left to the green arrow in Fig. 3C) and high rmsd (right to the red arrow). Although the simulated electronic CD (Fig. 3 E and F) of amide n π* and π
 π* transitions and the amide I band vibrational CD (Fig. 3 H and I) for these subensembles are very similar, the CI xxxy signals (Fig. 3 K and L) are markedly different.
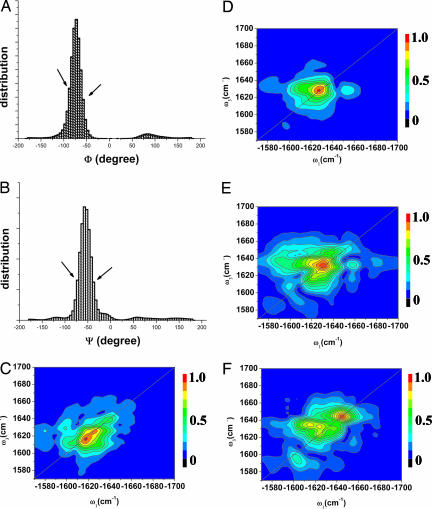
We next show that the (−1,660, 1,630 cm−1) cross-peak in the CI 2D signal of the helix (Fig. 4D) originates from correlations between the helical and the coil part. To that end, we examine the distribution of Ramanchandran angles in Fig. 4 A and B. Configurations with φ within [−55, −90] and ψ within [−35, −75] are considered as the helical domain. Each local vibrational mode i, where any of the four angles (φ and ψ between i − 1, i and i, i + 1) lies outside of the helical domain, is considered a coil type. Fig. 4C gives the signal for an artificial system where all coil mode frequencies have been shifted by 100 cm−1 to the red. Only the pure helix shows in this frequency range and the cross-peak of the native system (Fig. 4D) is eliminated. The cross-peaks thus provide a unique spectral window for investigating the helix–coil transformation.
Fig. 4.
A well-resolved cross-peak in CI 2D correlation signal of a peptide reveals information about interaction between helical and coil segments. (A and B) Distribution of the Ramanchandran angles. Regions between the two arrows are identified as “helix.” The (−1,660, 1,630) cm−1 cross-peaks of the full CI signal (D) are eliminated when all nonhelical modes are isotopically labeled by shifting their frequencies 100 cm−1 to red (C). As the number of snapshots in D is decreased to E (11,000) and F (5,500), we see a strong diagonal peak at (−1,660, 1,660) cm−1. The elimination of this diagonal peak in the ensemble provides a clear window for observing the cross-peaks.
Much effort has been devoted to eliminating the strong diagonal peaks in nonchiral 2D techniques of small and rigid molecules to better resolve the weaker cross-peaks (23). In the CI 2D signals, some diagonal peaks are reduced by interference of contributions from transition dipoles at different parts of the molecule, thereby improving the contrast for the cross-peaks. The cross-peaks are induced by correlations between different localized modes and depend on their distance; diagonal peaks have no such distance dependence because they originate from a single mode. We next compare simulations obtained using different numbers of configurations spanning the same 25-ns time window. Fig. 4 D, E, and F present spectra averaged over 22,000, 11,000, and 5,500 configurations, respectively. The diagonal 1,660-cm−1 peak in Fig. 4C is gradually weakened and eventually disappears as the number of configurations is increased. The peak is thus is eliminated by the cancellation of signals from different members of the molecular ensemble.
Conclusion
In summary, we have demonstrated that CI 2D signals can help determine correlations between different parts of a protein by enhancing cross-peak contributions and attribute them to structural features. The cross-peaks are very sensitive to the secondary structure variation, and the chiral configuration between different chromophores can be determined from the signs of the corresponding cross-peaks (positive vs. negative cross-peak between two transitions correspond to different sense of screw configuration of the corresponding transition dipoles). Moreover, coherent 2D techniques have an intrinsic ultrashort (femto- to nanosecond) temporal resolution. Combined with the spatial sensitivity of CI polarization configurations, they offer a tool, complementary to NMR, for tracking early protein folding events and pinpointing the average structure and its fluctuations along the folding pathway.
The proposed CI signals are much weaker than regular (dipole approximation) contributions. Nevertheless, because they are background-free, they may be readily detected by using state-of-the-art infrared technology. The colinear configuration considered here is the simplest to calculate and mimics more realistic quasi-colinear configurations. Noncolinear configurations can be calculated as well and should yield similar contributions. Combinations of several specifically arranged noncolinear experiments may be used to cancel nonchiral terms, and enhance the CI terms. Specific experiment geometry can be used to probe a specific tensor component. For instance, the collinear xxxy configuration, which was studied in this paper, can be measured in noncollinear geometry where all laser beams are arranged in one (yz) plane, the first y-polarized beam propagate along z and the other x-polarized beams can have wave vector coponent along y. All nonchiral contributions will vanish for this configuration and only xxxy will survive.
Methods
The simulation protocol for the peptide amide I band lineshape was described in ref. 5. The helix structure is constructed using MAESTRO package, and hairpin structure is obtained from Protein Databank (PDB ID 1LE3). NAMD package and CHARMM27 force field are used for the simulation. During the simulation, the backbone dihedral angles of the hairpin are restrained. The SPECTRON package is used for the modeling of the spectra. An electrostatic model described in ref. 5 was used for the construction of the vibrational Hamiltonian. Electronic Hamiltonian in the amide band was constructed by using the model described in ref. 18. The NEE module is used for the response function calculation. Double quantum transitions (overtones and combination bands) are introduced through the exciton scattering matrix. A 5.5-cm−1 lorentzian is used to simulate the homogeneous broadening. Inhomogeneous broadening is obtained by summing up the calculated signals of many snapshots of the system. Linear absorption, CD, and photon echo signals (with t2 = 0) with polarization configuration xxxx and xxxy were simulated.
Acknowledgments
We thank Prof. Feng Gai at University of Pennylvania for providing the experimental linear absorption signal of spe3 and trz4. This work was supported by National Institutes of Health Grant 2R01-GM59230-05 and National Science Foundation Grant CHE-0446555.
Abbreviations
- CI
chirality-induced
- CD
circular dichroism
Footnotes
The authors declare no conflict of interest.
This article is a PNAS direct submission.
References
- 1.Onuchic JN, Luthey-Schulten Z, Wolynes PG. Annu Rev Phys Chem. 2006;48:545–600. doi: 10.1146/annurev.physchem.48.1.545. [DOI] [PubMed] [Google Scholar]
- 2.Elber R. Curr Opin Struct Biol. 2005;15:151–156. doi: 10.1016/j.sbi.2005.02.004. [DOI] [PubMed] [Google Scholar]
- 3.Marszalek PE, Lu H, Li HB, Carrion-Vazquez M, Oberhauser AF, Schulten K, Fernandez JM. Nature. 1999;402:100–103. doi: 10.1038/47083. [DOI] [PubMed] [Google Scholar]
- 4.Kubelka J, Hofrichter J, Eaton WA. Curr Opin Struct Biol. 2004;14:76–88. doi: 10.1016/j.sbi.2004.01.013. [DOI] [PubMed] [Google Scholar]
- 5.Zhuang W, Abramavicius D, Hayashi T, Mukamel S. J Phys Chem B. 2006;108:18034–18045. doi: 10.1021/jp055813u. [DOI] [PMC free article] [PubMed] [Google Scholar]
- 6.Abramavicius D, Mukamel S. J Chem Phys. 2006;124:034113. doi: 10.1063/1.2104527. [DOI] [PubMed] [Google Scholar]
- 7.Demirdoven N, Cheatum CM, Chung H, Khalil S, Knoester M, Tokmakoff J. J Am Chem Soc. 2004;126:7981–7990. doi: 10.1021/ja049811j. [DOI] [PubMed] [Google Scholar]
- 8.Asplund MC, Zanni MT, Hochstrasser RM. Proc Natl Acad Sci USA. 2000;97:8219–8224. doi: 10.1073/pnas.140227997. [DOI] [PMC free article] [PubMed] [Google Scholar]
- 9.Cowan ML, Bruner BD, Huse N, Dwyer JR, Chugh B, Nibbering ETJ, lsaesser T, Miller RJD. Nature. 2005;434:199–202. doi: 10.1038/nature03383. [DOI] [PubMed] [Google Scholar]
- 10.Larsen OF, Bodis A, Buma P, Hannam WJ, Leigh JS, Woutersen DA. Proc Natl Acad Sci USA. 2005;102:13378–13382. doi: 10.1073/pnas.0505313102. [DOI] [PMC free article] [PubMed] [Google Scholar]
- 11.Zheng JR, Kwak K, Asbury J, Chen X, Piletic IR, Fayer MD. Science. 2005;309:1338–1343. doi: 10.1126/science.1116213. [DOI] [PubMed] [Google Scholar]
- 12.Kim YS, Hochstrasser RM. Proc Natl Acad Sci USA. 2005;102:11185–11190. doi: 10.1073/pnas.0504865102. [DOI] [PMC free article] [PubMed] [Google Scholar]
- 13.Brixner T, Stenger J, Vaswani HM, Cho M, Blankenship RE, Fleming GR. Nature. 2005;434:625–628. doi: 10.1038/nature03429. [DOI] [PubMed] [Google Scholar]
- 14.Berova N, Woody RW, Nakanishi K. Circular Dichroism: Principles and Applications. 2nd Ed. New York: Wiley; 2000. [Google Scholar]
- 15.Nafie LA. Annu Rev Phys Chem. 1997;48:357–386. doi: 10.1146/annurev.physchem.48.1.357. [DOI] [PubMed] [Google Scholar]
- 16.Barron LD. Molecular Light Scattering and Optical Activity. 2nd Ed. Cambridge, UK: Cambridge Univ Press; 2004. [Google Scholar]
- 17.Abramavicius D, Zhuang W, Mukamel S. J Phys B. 2006 in press. [Google Scholar]
- 18.Woody RW, Sreerama N. J Chem Phys. 1999;111:2844–2845. [Google Scholar]
- 19.Du DG, Zhu YJ, Huang CY, Gai F. Proc Natl Acad Sci USA. 2004;101:15915–15920. doi: 10.1073/pnas.0405904101. [DOI] [PMC free article] [PubMed] [Google Scholar]
- 20.Wütrich K. NMR of Proteins and Nucleic Acids. New York: Wiley; 1995. [Google Scholar]
- 21.Cochran AG, Skelton NJ, Starovasnik MA. Proc Natl Acad Sci USA. 2001;98:5578–5583. doi: 10.1073/pnas.091100898. [DOI] [PMC free article] [PubMed] [Google Scholar]
- 22.Wang T, Zhu YJ, Getahun Z, Du DG, Huang CY, DeGrado WF, Gai F. J Phys Chem B. 2004;108:15301–15310. doi: 10.1021/jp037272j. [DOI] [PMC free article] [PubMed] [Google Scholar]
- 23.Zanni MT, Ge NH, Kim YS, Hochstrasser RM. Proc Natl Acad Sci USA. 2001;98:11265–11270. doi: 10.1073/pnas.201412998. [DOI] [PMC free article] [PubMed] [Google Scholar]


