Abstract
Results of protein sequence comparison at open criterion show a very large number of relationships that have, up to now, gone unreported. The relationships suggest many ancient events of gene duplication. It is well known that gene duplication has been a major process in the evolution of genomes. A collection of human genes that have known functions have been examined for a history of gene duplications detected by means of amino acid sequence similarity by using BLASTp with an expectation of two or less (open criterion). Because the collection of genes in build 35 includes sets of transcript variants, all genes of known function were collected, and only the longest transcription variant was included, yielding a 13,298-member library called KGMV (for known genes maximum variant). When all lengths of matches are accepted, >97% of human genes show significant matches to each other. Many form matches with a large number of other different proteins, showing that most genes are made up from parts of many others as a result of ancient events of duplication. To support the use of the open criterion, all of the members of the KGMV library were twice replaced with random protein sequences of the same length and average composition, and all were compared with each other with BLASTp at expectation two or less. The set of matches averaged 0.35% of that observed for the KGMV set of proteins.
Keywords: open criterion, protein, relationships, sequence
Gene duplication has played an important role in the history of the human genome and the genomes of ancestors. Gene duplication has been a subject of study with the work of Ohno (1) and before. As introduction, I quote a few of my own sentences from 1965 (2).
The idea of gene duplication is not new; the striking evidence for earlier suggestions for at least limited occurrence has come from the degree of similarity of amino acid sequences among different, although related, proteins. The probable relation between gene duplication and the rate of evolution is also of interest. Once a gene has been duplicated, the risk of deleterious mutation is decreased. Further, if we may consider one copy (the effective gene) as being conserved relatively unchanged as a result of selection pressure, so that the function it specifies is neither lost nor adversely modified, other copies would be free to mutate as long as deleterious gene products did not result. These copies would initially have the capacity to specify a complete gene product-for example, an enzyme or part of a physiological system. As mutations occurred in the copies some elements might be lost or modified and other elements maintained. The development of a gene specifying a new function from remaining elements of an older gene that had been protected from adverse selection pressure by copying seems to be far more probable than its development de novo from a random nucleotide sequence. A great source of variety in new structures might result from the combination. of elements from several preexisting genes.
There has been the formation of gene copies that then may evolve for a time free of selection and take on new or variant functions. There have been events on all scales, including duplication of genes, regions, chromosomes, and the whole genome. The result was often the formation of families of hundreds of related genes that now can be recognized by amino acid sequence similarity as well as functional similarity. It is not feasible to review the >200 publications in the last 10 years (www.nslij-genetics.org/duplication). It appears that none attempt to estimate the percentage of human genes that have been derived by duplication by means of studies of sequence similarity at open criterion. The work reported here depends entirely on the amino acid similarities among human genes, of which there are very many. There is little doubt that duplication or copying of genes has been an ancient process, and as a result of the long time span, the earliest sequence similarities have been lost because of amino acid sequence drift. The purpose of this work has been to count the number of still recognizable sequence similarities and estimate the fraction of the present human genes that may have resulted from duplication.
Results
Library of Known-Function Proteins and Maximum-Length Transcript Variants.
The library of 25,000 human proteins has faults, because many of the proteins are computer-derived, and thus the functions of many of the proteins are not known. In addition, many of the listed proteins are transcript variants of other proteins on the list. Therefore, a list of proteins was made from the build 35 list by removing all proteins for which a description of the function was not available. In addition, each set of transcript variants of a gene was removed and replaced by the variant of maximum length, leaving 13,298 genes, and this set (called KGMV for known genes maximum variant) was used for all of the results in this article. Of this list, 11,386 (85%) matched other proteins of the set with an expectation of 10−3 or less (see Methods), with no limit on the length of the matching region.
The Large Number of Protein Duplications.
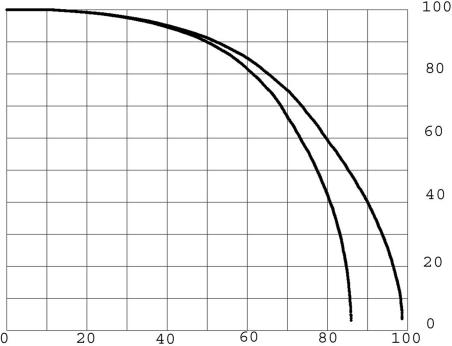
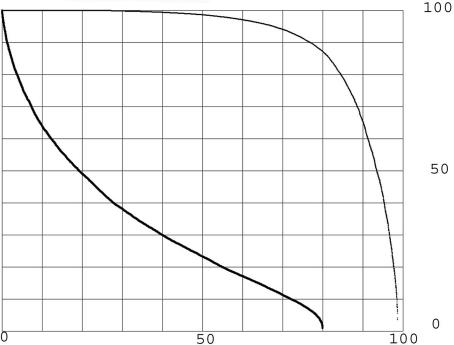
An all-to-all comparison of the KGMV library was made with an expectation upper limit of two (see Methods). The result was 5.2 million matches, of which 2.0 million were distinct pairs of proteins that matched. The difference of 3.2 million are mostly cases of BLASTp (3) reporting very similar matches of the same pair. To assess the amount of accidental match, comparisons at the same expectation limit were made with all of the KGMV library members replaced with random amino acid sequences of equal length and average composition equal to that of the whole library (see Methods). The result was 0.35% of the 5.2 million matches. The 0.35% random background was small enough to be ignored. In an all-to-all comparison, each member of the library, termed the probe, is compared with all of the other members of the library. The percentage of the protein length matched in an alignment is calculated as the length in amino acids between the start and end of the alignment along the probe divided by the length of the probe protein. This definition has the advantage that it rises to an upper limit of 100% regardless of gaps in either sequence in the alignment. Each probe may make many alignments, and the one with the maximum percentage of length is taken as the most significant in searching for a past history of duplications. The maximum percentage of the protein length matched for each of the probe proteins was listed for the KMGV all-to-all comparison. This list was ordered on the basis of the percentage of probe protein length in the match, and the result was plotted in Fig. 1 for all of the 13,298 KGMV proteins as the upper curve. The lower curve was calculated in the same way for an all-to-all comparison with an upper limit of expectation of 10−3. Many proteins, presumably those that are the result of more ancient duplications, are not included for the lower curve. The focus will be on the more inclusive (expectation two or less) conditions of the upper curve.
Fig. 1.
Percentage of length of proteins in longest matches at two criteria. The y axis represents the percent of length in matches. The x axis represents the percentage of the KGMV library. The lower curve expectation is ≤10−3. The upper curve expectation is ≤2. The maximum length matched is plotted for each protein, ordered by percentage of length matched, forming a continuous curve because so many thousands of proteins are plotted.
From the upper curve of Fig. 1 (expectation limit two), the percentage of the probes that have length fractions above any chosen limit can be read directly. For example, 79% of the library members make single matches >60% of their length. It is reasonable to consider that any statistically significant match is evidence of a past duplication even when only a small percentage of the length of the proteins is included. From that point of view, ≈98.6% of the human proteins share at least a short similarity with another human protein and, therefore, have undergone copying at some time in the past. There is some uncertainty in this number because rare accidental matches might affect it. The suggested short regions may be the conserved residue of relationship from an ancient duplication after a long period of evolutionary sequence modification.
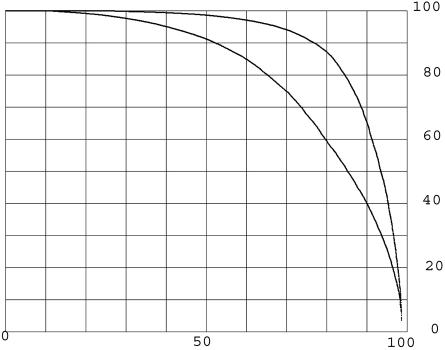
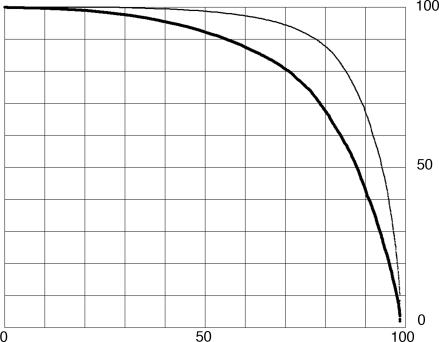
In most cases, the percentage of length (or coverage) of the best single match is <100%, but there are other matches in the remainder of the protein. Fig. 2 reports the effect of these matches by counting all of the significant alignments of each probe. For this purpose, an array was made for all of the amino acids of the probe, and each amino acid was marked if it was within the length any of the alignments. Fig. 2 (upper curve) shows the percentage of the length involved in the total of all of the alignments, defined as above. The lower curve is for the longest single matches, sorted, and is identical to the upper curve on Fig. 1. The difference between the upper and lower curves is due to the fact that regions of proteins are related to many other proteins. In a few cases, this difference is owing to the fact that proteins are made up of a number of copies of duplicated regions or functional domains and are detected by multiple different alignments between the same pair of proteins. In most cases, the contributing alignments are between different pairs of proteins, indicating that most probes are related to many different other proteins, as examined in the next section.
Fig. 2.
The percentage of each of the proteins included in all matches at expectation two or less. The y axis represents the percentage of length of each protein. The x axis represents the percentage of the KGMV library. The lower curve (copied from Fig. 1 for comparison) is the percentage of length covered in single matches. The upper curve is the percentage of length covered in all matches. Each curve is a plot of all of the proteins that are matched ordered independently by the percentage of length matched. For the upper curve, an array was made for all the amino acids in the probe, and each amino acid was marked if newly included in a match. The percentage of length matched is the sum of all marked amino acids times 100 divided by the length of the protein.
Most Proteins Are Composites of Other Proteins.
The sequence relationships make it possible to assess the number of examples of proteins that are composite. The difference between the upper and lower curves in Fig. 2 shows that very many proteins have sequence relationships to more than one other protein. Table 1 presents a view of the numbers of related proteins for each of the KMGV library members. The matches for each protein were taken in sequence according to BLASTp score. To be counted, the match had to include amino acids not matched by previous matches, therefore being an additional relationship. Then, it was required that the match be to a new protein different from all of the other proteins in relationships already counted. This requirement avoided the internally repeated sequence elements of proteins. Table 1 shows the results of this analysis.
Table 1.
Composite proteins recognized by sequence similarity to other proteins
| Count* | No. of cases† |
|---|---|
| 1 | 2,798 |
| 2 | 2,215 |
| 3 | 1,894 |
| 4 | 1,500 |
| 5 | 1,307 |
| 6 | 950 |
| 7 | 665 |
| 8 | 515 |
| 9 | 367 |
| 10 | 273 |
| 11 | 185 |
| 12 | 125 |
| 13 | 105 |
| 14 | 60 |
| 15 | 45 |
| 16 | 34 |
| 17 | 26 |
| 18 | 18 |
| 19 | 11 |
| 20 | 9 |
| 21 | 7 |
| 22 | 4 |
| 23 | 4 |
| 24 | 2 |
| 27 | 1 |
| 29 | 1 |
*Count of the number of different proteins with sequence similarity to regions of one protein.
†Number of proteins with this count of sequence relationships.
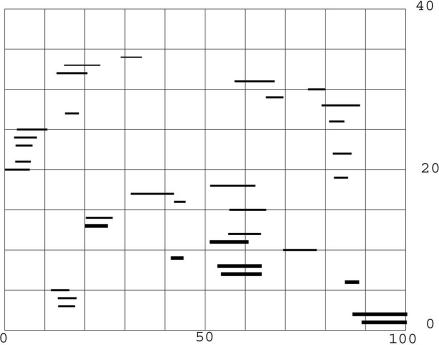
Table 1 shows, in line 1, that there are 2,798 proteins that have only a single relationship, amounting to only 21% of the KGMV library. This line is distinct because it does not show composite proteins as the table heading states and is there for completeness. Line 2 shows 2,215 proteins that have two distinct relationships, and line 3 shows 1,894 proteins with three distinct relationships. The total of examples with multiple relationships is 10,325, or 77.8% of the KGMV library. Thus, ≈80% of the proteins have many distinct matches that result from ancient events of duplication. The upper curve of Fig. 2 shows that these relationships are commonly based on sequence similarities scattered over the length of the protein, because they often add up to almost the complete length of the proteins. The typical protein thus has a composite structure. Various regions were derived from many past, probably distinct, events of duplication, confirming the suggestion made in the quotation from 40 years ago in the introduction. The protein with the maximum number (i.e., 29) of relationships (NM_015402) is E3 ubiquitin protein ligase 1 (EDD1) containing a HECT domain and is 2,799-aa long. The protein is listed as NP_056986, with four distinct functional regions. Fig. 3 shows the positions of the alignments on the probe.
Fig. 3.
The positions of the alignments with protein (EDD1), NP056986, NM_015902. The individual alignments with this probe were scanned, and any match that included alignment with amino acids not previously matched was plotted, starting at the bottom. There are 34 such matches, and, in 5 cases, the same matching protein was included more than once because the alignments reported by BLASTp were significantly different. The heavy lines are matches with expectation of 10−3 or less. The next weight of lines have an expectation equal to one or less and >10−3. The two thin lines at the top have an expectation equal to two or less and greater than one.
The different regions of the EDD1 protein that match other proteins cover, among them, almost the whole length of the protein. As can be read from Fig. 3, the matches are short regions ranging from ≈50 to 350 aa. The EDD1 protein has the maximum number of relationships (i.e., 29) to different proteins shown in Table 1, and this evidence shows that, in earlier times, it was a composite made from many different proteins. The modern evidence shows that, indeed, EDD1 has different functional regions, but the number that have been identified is much smaller than these data suggest. Much has changed since the ancient events, although residues of ancient sequence relationships remain.
Precision of Match at This Open Criterion.
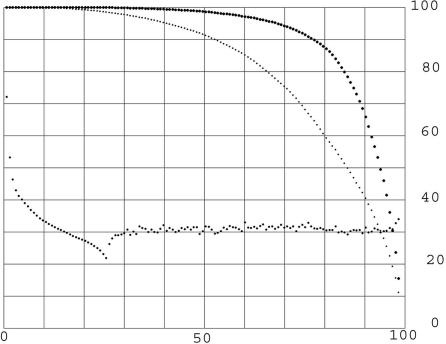
The precision of match is important because it is part of the evidence regarding the events of duplication. Fig. 4 is similar to Fig. 2, except that the data are plotted as averages of sets of 100 matches, because the scatter of percent divergence is large among individual matches. The same ordered set of matches was used as for the upper curve of Fig. 4, and the percentage match was listed for each of 13,122 examples. The percentage of length of the protein in the matches and the percentage amino acid sequence match were both averaged for each succeeding 100 examples, and the averages are plotted on Fig. 4. The average is ≈32% amino acid match reflecting the open criterion. The most leftward sets of 100 matches show much higher precision of match having been selected by the UNIX sort program from among those that match full length. They are rare cases.
Fig. 4.
Precision of match at open criterion. The x axis represents the percentage of the KGMV library. On the y axis, the upper curves represent the percentage of protein length matched, and for the lower curve, the scale represents the percentage of amino acids matched averaged for 100 proteins each. The proteins have been collected in sets of 100 each to reduce scatter. Other than this exception, the upper curves are identical to those in Fig. 2. The reason for the curious shape at the beginning is that the UNIX sort program ordered on the basis of percent amino acid match all those that were matched for 100% of their length. Except for a few with high percentage length matched, the average percentage amino acid match is ≈32%.
Matches Among Proteins with Random Amino Acid Sequences.
As a control for the very open criterion, each of the KGMV library members was replaced with a random amino acid sequence of the same length and composition equal, on average, to that of the whole library, and an all-to-all comparison was made at expectation two or less. An analysis of the results was made with the same software that gave the upper curve on Fig. 2. The result is the lower curve on Fig. 5, where the upper curve from Fig. 2 is also reproduced. Fig. 5 shows that, although the open criterion exposes some matches among the random protein sequences, they are, in quantity, nothing like those seen in the human proteins. Because each point on the upper curve is supported by ≈200 times as many matches as the points on the lower curve, the lower curve cannot be used to estimate the error of the upper curve in estimating the percentage of human proteins matched at a given length fraction (see Table 2).
Fig. 5.
The percentage of random proteins included in all matches; control for open criterion. The description of this figure is exactly as for Fig. 2, except that the lower curve is from an all-to-all comparison of a 13,298-member random amino acid library matching the KGMV library in length and composition (on average). In this example, there were 22,340 matches among the random amino acid sequences at expectation two or less, whereas there were 5,200,000 matches for the upper curve.
Table 2.
Number of matches for Fig. 5
| Percentage library* | Matches† | Matches random‡ |
|---|---|---|
| 98.3 | 173 | 106 |
| 97.5 | 307 | 118 |
| 96.8 | 638 | 120 |
| 96.0 | 1,432 | 124 |
| 95.3 | 3,969 | 140 |
| 94.5 | 2,739 | 142 |
| 93.8 | 2,916 | 132 |
| 93.0 | 4,085 | 166 |
| 92.3 | 4,921 | 139 |
| 91.5 | 3,761 | 190 |
| 90.8 | 10,569 | 169 |
*For the last 1,100 probes to the right in Fig. 5, the percentage of the total library averaged for each set of 100 probes. These values apply only for the upper curve and column 2.
†The total number of matches to each set of 100 probes.
‡The total number of matches for each set of 100 probes for the rightmost sets of random probes and the lower curve. The amount of the random library that is matched reaches only ≈80%, as shown in Fig. 5.
Number of Proteins Matching Each Probe.
The two curves in Fig. 5 are very distinct from each other, particularly in the number of matches that each probe makes. The human proteins for the upper curve make ≈200 times as many matches than for the random sequence probes for the lower curve. This finding strongly supports the significance of the upper curve and the implication that a very large fraction of the proteins of the KGMV library are partially sequence matched to other members of the library, which is interpreted as evidence for a duplication in the distant past. The rightmost points on the Fig. 5 upper curve imply that almost all human proteins have such a history. Evidence that helps to make this hypothesis convincing is the number of matches that probes make, shown in Table 2. The KGMV probes for the upper curve make many more matches than the random sequences that were used for the lower curve on Fig. 5. To make this fact evident, I have collected the probes in sets of hundreds, because the number of matches varies widely from probe to probe. Table 2 shows the results for the total number of matches for each set of 100 probes for the last 1,100 probes for both of the curves on Fig. 5.
It is immediately evident that the number of matches for the data of the upper curve is much larger than for the lower or random curve. The percentage of the library matched for each set is strongly supported when the number of matches is significantly higher than for the random examples. For the rightmost set, averaging 98.3%, there are 1.7 matches per probe compared with ≈1 for the random set. This difference might not be considered statistically significant, but the differences rise rapidly going down the table, reaching >10-to-1 for the fourth value, at 96% of the library. Although the conclusion that 98.3% of the library find matches might be slightly doubtful, certainly >96.8% find matches. For this set, there is an average of 6.38 matches per probe compared with 1.2 matches per equivalent random probe. The conclusion is that >97% of the KGMV library proteins have sequence matches to other members of the library.
Individual Amino Acid Coverage.
In Figs. 1, 2, 4, and 5, the coverage of each probe was determined by the beginning and end of the matching region of each match. Thus, there was not information about the matching of individual amino acids of the probe, except that most matches each covered ≈32% of the amino acids of the matching region. However, there are many matching proteins, and because the differences in the details of the matches, together, they match many more amino acids. Fig. 6 shows this result. The lower curve shows the percent of the total individual amino acids of each probe that are included in all of the matches it makes. Many are almost completely matched. For 50% of the proteins of the KGMV library, >92% of the amino acids are matched. The curve for percent of amino acids matched always falls below the upper curve, which is identical to the upper curve of Fig. 2. Although the sequence residues of the ancient duplications are quite divergent, in most cases, this divergence is the result of independent substitutions in the various family members, so together they match a large percentage of most of the probes, indicating the extensiveness of the ancient duplications.
Fig. 6.
Coverage of individual amino acids of probes in the many matches. The horizontal scale is the percentage of the KGMV library. The upper curve is identical to the upper curve of Fig. 2, and for this curve the vertical scale is the percentage of the length covered. The lower heavy curve describes the individual amino acids covered, and the right-hand scale for this curve is the percentage of individual amino acids included in the many matches.
Perfectly Matching Pairs of Proteins.
The cases of 100% match in Fig. 4 suggest that there may be recent events of duplication. There are 62 proteins that are part of 100%-matching pairs of proteins, and, in 57 cases, the matching pairs are of the same length. Forty of these are matches between histone proteins, not surprisingly, because this highly conserved protein family contains many very similar proteins. Most of these matches are parts of sets of 100%-matching proteins, and the average number of members of the sets is 5.4. Histone 1 has 12 members that perfectly match over its full length, and many other histones are also parts of small sets. The only other protein perfectly matching a set is ubiquitin B (UBB) with 7 members. The example of α1 and α2 hemoglobin is apparently due to recent intrahuman duplication or correction because the two α genes are present in approximately the same locations in the globin gene of all great apes (4).
The DNA sequences of the coding regions in these cases were compared, and a few match 100%, indicating that there have been some recent events of duplication without detectable synonymous mutations in either of the products. The implication is that the duplications occurred within the last few million years, and, thus, the duplications are possibly human-specific. The cases are listed in Table 3. However, the majority of perfectly matching protein sequences show the effect of synonymous mutations. The mode value in the number of cases shows an 85% coding sequence match, which corresponds to a large silent substitution difference of Ks = 1 at the peak. Thus, the time of duplication in these typical cases was very many millions of years ago. Comparison of proteins between mouse and human shows average Ks of 0.729 for 5,509 proteins (5), although there is a wide range among individual proteins. The implication is that the typical pair of proteins that match perfectly in amino acid sequence have a Ks = 1 and were duplicated before the mouse and human lineages diverged, that is, before the mammalian radiation. Thus, these are very highly conserved proteins. When these proteins are individually identified, it is found that all examples where the DNA coding sequence matches <99% are histone gene comparisons, except for one case of calmodulin 1 and calmodulin 2 that match 85%.
Table 3.
Perfectly matching protein pairs
| Protein 1 | Protein 2 |
|---|---|
| Hemoglobin, α 1 (HBA1) | Hemoglobin, α 2 (HBA2) |
| Cancer/testis antigen 1B (CTAG1B)* | Cancer/testis antigen 1A (CTAG1A) |
| G antigen 7B (GAGE7B) | G antigen 7 (GAGE7) |
| Histone 1, H4k (HIST1H4K) | Histone 1, H4j (HIST1H4J) |
| Melanoma antigen family A, 2 (MAGEA2)* | Melanoma antigen family A, 2B (MAGEA2B) |
| G antigen 8 (GAGE8) | G antigen 1 (GAGE1) |
| Small EDRK-rich factor 1A (telomeric) (SERF1A) | Small EDRK-rich factor 1B (centromeric) (SERF1B) |
| Chorionic gonadotropin, β polypeptide 5 (CGB5) | Chorionic gonadotropin, β polypeptide 8 (CGB8) |
*The length of the two proteins is identical except for these two cases.
Discussion
The major conclusions are as follows: (i) Almost all (>97%) of human proteins have a history of duplication of some part of their length, and (ii) most (≈80%) proteins show relationships to more than one other protein in different regions, reflecting an ancient composite structure. The work was limited to the KGMV library, which consists only of proteins of known function, showing that these conclusions apply to working proteins. Preliminary tests with Caenorhabditis elegans, Drosophila melanogaster, and sea urchin (Strongylocentrotus purpuratus) and with several bacterial protein sets show similar patterns of relationship. The indication is that the ancient sequence relationships occur generally, which is to be expected if they are truly ancient.
Mechanism of Duplication.
It is not easy, based on open criterion sequence similarity data, to decide what the mechanisms of duplication have been. There are several familiar candidates: (i) insertion of DNA copies of mRNA leading to processed genes, (ii) unequal crossover, (iii) chromosome duplication, (iv) polyploidy, and (v) segmental duplication. There are, of course, novel possibilities such as making use of the mechanisms used by transposable elements, called transduction (6). The transposon L1 is considered to have transferred 100,000 short DNA sequences, but the contribution to proteins is unknown (6).
There is some evidence regarding the first possibility. The resulting processed genes would, at least initially, have only a single exon. In the collection of 13,298 KGMV genes are 795 genes with single exons that have matching sequences with an expectation of 10−3 or less. Of these, 169 match only other sequences that have single exons. Most match other genes with larger numbers of exons. There is no way to tell how many of these are actually processed genes. These data suggest that processed genes are only a small part of the number of genes that have resulted from duplication. Therefore, this mechanism of gene duplication does not contribute largely to the total observed duplicated genes or gene regions.
Comparison of the chimp and human genome sequences (7) shows segmental duplication occurring at an estimated rate of 4–5 megabases per million years. Genes are included in these duplicated segments, and, if there were no discrimination against them, this process alone would duplicate 0.15% of the genes in a million years, or 15% per 100 million years if it continued at the estimated rate. That would amount to ≈2,000 genes of the 13,298 in our library. There have been other processes that have duplicated long regions, for example polyploidy, which can be the explanation of only a small part of the relationships studied in this work because most of these are parts of families with a wide range in the number of members.
To consider the significance of the number of family members, I report here a study made at a higher criterion, with the expectation ≤10−3. There was no restriction on the percent of the length of the proteins involved in the matches. In this study, half of all of the proteins that are members of families are members of families with >18 members. The family with the maximum number of members contains 499 members based on sequence similarity. Proteins with more than a few members are very unlikely to be due to duplications of large regions, because these duplications do not repeat often in the same location. The same argument applies to other mechanisms such as polyploidy and chromosome duplication. Much larger estimates of the size of sets of related proteins are deduced at an expectation limit of two, which makes the argument stronger. Thus, whole-genome duplication, for example, could not account for more than a few of the relationships seen. These arguments leave unequal crossover as the most likely known candidate for the bulk of the duplications, particularly for members of families with more than a few members, which make up the majority of proteins. It is unlikely that a significant fraction of the sequence relationships between proteins are due to independent insertions of the same transposable elements (TEs). It is conceivable that specific useful protein domains are carried on elements capable of insertion, which would be a class of TEs as yet to be recognized as carrying out this role.
Future Openings.
Two issues were brought out by reviewers that could not easily be incorporated in this article. It was pointed out that comparison with chimpanzee proteins for the precisely matching pairs of proteins might supply useful information regarding the time of duplication in these cases. By extension, it would be valuable to make comparisons of chimpanzee sequence matches with those observed in human. Any ancient duplications would be expected to yield identical pairs, except for the small sequence divergence that has occurred between these two species. This approach would strongly reduce the chance of accidental matches contributing to the estimate of the number of proteins for which the genes had been duplicated
There was a proposal that random sequences should be formed with the same amino acid composition as the individual proteins rather than the average of the whole library. An initial exploration has been done. Such a library was made, and it is not like a random library. An all-to-all comparison was made, and many matches were found. The results show that 6% of the matches have an expectation <10−10. The best matches had an expectation of 10−100. Families of as many as 500 related sequences exist by virtue of similarity of composition. The formation of these many genes with composition similarities is part of the ancient history of gene duplication and will be worth exploring.
Methods
The set of 25,193 coding sequences was obtained by using the seq_gene.md file from the National Center for Biotechnology Information, build 35. A 12-processor E400 (Sun Microsystems, Santa Clara, CA) and a G5 computer (Apple, Cupertino, CA) were used for these studies. To prepare the file of “known protein” genes that include the proteins that have been studied, a list of the 25,193 genes with brief identifiers was alphabetized, and blocks were removed, for example those identified as hypothetical or similar to other genes. Then all of the members of sets of transcription variants were removed and replaced with the gene that appeared to have the longest variant, with 13,298 remaining, called the KGMV library. For this purpose, the length of the transcript was taken from the protein description. BLASTp (3) was used for amino acid sequence comparisons. For each match, the BLASTp program calculates an expectation. An expected frequency of occurrence can be converted to a probability of occurrence by using the equation: P = 1 − exp(−E). In the limit as E approaches infinity, P approaches 1. In the limit as E approaches 0, P approaches E. We have chosen to eliminate all matches with an expectation greater than two. To test this limit, a set of 13,298 random amino acid sequences was created with the same lengths as the protein sequences of the KGMV library and the same average amino acid composition on two occasions. An all-to-all BLASTp comparison between them was made, and in the two trials, 43 and 13 matches were observed, with an expectation of 10−3 or less. At an expectation of two or less, 14,038 and 22,343 matches were observed in the two comparisons, averaging to 0.35% of the 5.2 million matches observed with the KGMV library. Thus, a limit of 10−3 allows a very small background number of accidental matches and is a conservative choice of expectation limit, whereas a limit of two allows a significant but small number of accidental matches in comparison with the large number observed for the known proteins of the human genome.
Acknowledgments
John Williams carried out much of the data processing and wrote necessary Perl programs, Eric Davidson's laboratory supplied support, and Dixie Mager made crucial criticism of an earlier version.
Abbreviation
- KGMV
known genes maximum variant.
Footnotes
The author declares no conflict of interest.
References
- 1.Ohno S. Evolution by Gene Duplication. New York: Springer; 1970. [Google Scholar]
- 2.Britten RJ. Carnegie Institution Yearbook 64. Washington, DC: Carnegie Institution; 1965. p. 333. [Google Scholar]
- 3.Altschul SF, Madden TL, Schaffer AA, Zhang J, Zhang Z, Miller W, Lipman DJ. Nucleic Acids Res. 1997;25:3389–3402. doi: 10.1093/nar/25.17.3389. [DOI] [PMC free article] [PubMed] [Google Scholar]
- 4.Zimmer EA, Martin SL, Beverley SM, Kan YW, Wilson AC. Proc Natl Acad Sci USA. 1980;77:2156–2162. doi: 10.1073/pnas.77.4.2158. [DOI] [PMC free article] [PubMed] [Google Scholar]
- 5.Castresana J. Nucleic Acids Res. 2002;30:1751–1756. doi: 10.1093/nar/30.8.1751. [DOI] [PMC free article] [PubMed] [Google Scholar]
- 6.Goodier JL, Ostertag EM, Kazazian HH., Jr Hum Mol Gen. 2000;9:653–657. doi: 10.1093/hmg/9.4.653. [DOI] [PubMed] [Google Scholar]
- 7.Cheng Z, Ventura M, She X, Khailovitch P, Graves T, Osoegawa K, Church D, Dejong P, Wilson RK, Paabo S, et al. Nature. 2005;437:88–93. doi: 10.1038/nature04000. [DOI] [PubMed] [Google Scholar]


