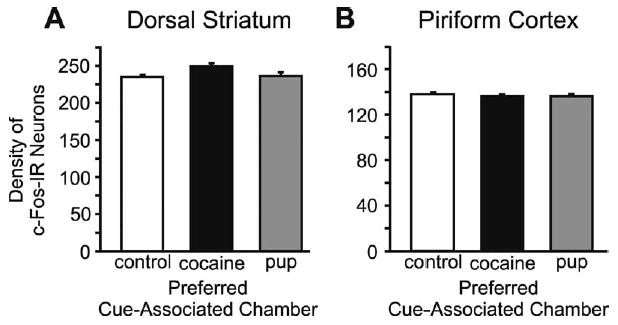
Fig. 9.

(A) Number of c-Fos-IR neurons in the dorsal striatum. (B) Number of c-Fos-IR neurons in the piriform cortex, these were control regions. Histograms from each preference group and controls show the mean (±S.E.M.) number of c-Fos-IR neurons. There were no significant differences among the groups in either structure.
