Abstract
Objectives. Patient data that includes precise locations can reveal patients’ identities, whereas data aggregated into administrative regions may preserve privacy and confidentiality. We investigated the effect of varying degrees of address precision (exact latitude and longitude vs the center points of zip code or census tracts) on detection of spatial clusters of cases.
Methods. We simulated disease outbreaks by adding supplementary spatially clustered emergency department visits to authentic hospital emergency department syndromic surveillance data. We identified clusters with a spatial scan statistic and evaluated detection rate and accuracy.
Results. More clusters were identified, and clusters were more accurately detected, when exact locations were used. That is, these clusters contained at least half of the simulated points and involved few additional emergency department visits. These results were especially apparent when the synthetic clustered points crossed administrative boundaries and fell into multiple zip code or census tracts.
Conclusions. The spatial cluster detection algorithm performed better when addresses were analyzed as exact locations than when they were analyzed as center points of zip code or census tracts, particularly when the clustered points crossed administrative boundaries. Use of precise addresses offers improved performance, but this practice must be weighed against privacy concerns in the establishment of public health data exchange policies.
With the widespread deployment of virtually real-time population health monitoring systems, including syndromic surveillance systems,1,2 there has been an increasing focus on spatial cluster detection as a means of identifying disease outbreaks. These spatial epidemiological methods rely on knowledge of patient locations to detect unusual disease clusters. Patients’ home addresses are recorded in hospital administrative data, but use of this precise information raises privacy concerns.3–5 Consequently, many surveillance systems have begun to use regional locations, such as zip code centroids (center points).6–11 However, this practice can distort the spatial distribution of the original, nonaggregated data, which may adversely affect subsequent spatial analyses.3 Therefore, it is important to study the potential effect that aggregating data to centroids may have on the statistical analyses underlying these systems.12,13
Although there is compelling justification to accurately monitor clinical data for public health purposes, it is important to protect identifiable patient information. The Privacy Rule of the Health Insurance Portability and Accountability Act14 requires that disclosed health information be restricted to the minimum necessary to satisfy its intended purpose. The minimum amount of information necessary for effective syndromic surveillance has not been well investigated. However, the issue has been explored in the context of cancer surveillance. A recent study revealed few differences when late-stage breast and prostate cancer results were compared for different area-specific units (town, census tract, block group) and exact coordinates (the study’s objective was not to search for small area clusters).15 An earlier study showed that small clusters did not characterize breast cancer incidence rates in the region assessed.16
The current practice in syndromic surveillance, in which there is great interest in detecting small, localized clusters, is to store patient locations as either latitude and longitude coordinates of home addresses or, more commonly, as points within administrative regions such as zip code areas or census tracts. The latter practice presumably results in patients being less identifiable as individuals, although extent of anonymity is certain to vary.17,18 A recent study using simulated risk data showed that, even when anonymity is ensured, assigning individuals to census tracts results in maps that do not accurately portray disease risk.19
The goal of this study was to investigate the effects of blurring identifiable patient data by converting a patient’s home address from an exact location to a regional centroid. We assessed outbreak detection by adding synthetic, spatially clustered emergency department visits to authentic background hospital emergency department surveillance data, creating semisynthetic data.20 The clusters were placed in a region densely populated by patients. In previous work, we found that small clusters near hospitals were difficult to detect.21 Yet, one goal of a real-time surveillance system is to detect unusual events early, possibly when only a few individuals have been affected. Depending on the nature of the outbreak, early detection may be critical in minimizing morbidity and mortality.
We used a spatial scan statistic22,23 to determine whether the simulated clusters could be detected. Pilot work indicated that this metric would detect relatively small, compact clusters in the present data. We examined 2 dimensions of cluster detection. One was detection rate, defined simply as the percentage of the semisynthetic data sets containing clusters detected by the spatial scan statistic. The other was accuracy, which we assessed by comparing characteristics of detected clusters with characteristics of simulated clusters. Transferring addresses to the centroids of administrative regions might increase detection rates by essentially amplifying clusters when many cases are concentrated at a single point. By contrast, detection might be more difficult in this case because not only would the simulated cluster points be concentrated, so would points from the background emergency department data.
METHODS
Surveillance Population
Simulated clusters were added to data derived from emergency department visits at an urban, pediatric, tertiary care hospital that participates in the AEGIS health monitoring system.1 Baseline data comprised all emergency room visits occurring between May 11, 2002, and June 22, 2005, in which the chief complaint or diagnosis was indicative of respiratory illness.24 The syndromic surveillance literature has most closely focused on symptoms of respiratory infection because they characterize many conditions of public health interest (e.g., influenza and anthrax).
ArcGIS 9.0 (Environmental Systems Research Institute Inc, Redlands, Calif) was used to geocode (convert to latitude and longitude coordinates) the home address of each patient, and addresses were mapped to census tract and zip code regions defined by the US Census Department. We used XTools Pro (Data East LLC, Novosibirsk, Russia) to calculate the centroid of each region included in the study. The final data set included visits made by patients living within 80 km (50 mi) of the hospital (38 122 visits; 90% of all cases meeting the criteria for respiratory illness). Patient densities were higher closer to the hospital.21 Among the patients included, 3806 (10%) lived 0 to 2 km from the hospital, and 18 634 (49%) lived within 2 to 8 km. Simulated cluster points were inserted into the 2- to 8-km band.
When addresses were converted from their exact locations to centroids, the distance from the original location to a zip code centroid (mean = 1.37 km, SD = 1.03, maximum = 12.39) was greater than the distance to a census tract centroid (mean = 0.64 km, SD = 0.68, maximum = 7.80). The same was true of the band containing the simulated cluster points; the average distance to a zip code centroid was 0.96 km (SD = 0.49), and the average distance to a census tract centroid was 0.39 km (SD = 0.30).
Simulated Clusters
We created 2 sets of simulated disease clusters, one for zip code analyses and one for census tract analyses. We added these clusters to the baseline data to test the effect of moving a point from its exact location to the center of each respective administrative region. We selected cluster parameters that would mimic an early signal of an outbreak first appearing as a small geographic cluster. All simulated clusters contained 10 points and were located along the edge of a circle with a radius of 5 km centered at the hospital, as illustrated in Figure 1 ▶.
FIGURE 1—
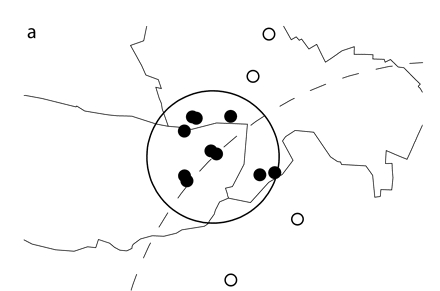
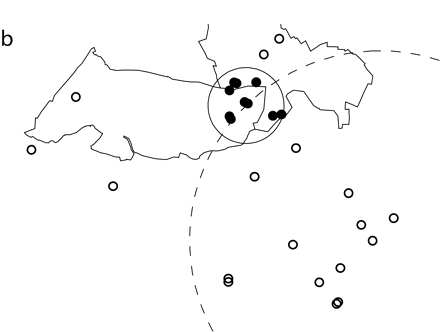
Simulated spatial cluster analyzed through the use of (a) exact locations or (b) zip code centroids.
Note. Ten simulated cluster points were inserted into authentic emergency department data. The simulated points (small dark circles) were randomly scattered within a 1-km circle (solid line) and fell into 2 zip codes of 5 points each. The simulated cluster was located along a circle (dotted line) with a radius of 5 km that was centered at the study hospital. For this figure, points representing patient addresses were moved random short distances from their true locations. Points analyzed as exact latitude and longitude coordinates are shown in part a. The cluster identified by SaTScan contained the 10 simulated points and 4 additional points (small open circles) from the hospital data. For the data shown in part b, points were analyzed as zip code centroids, but exact locations are pictured. The cluster identified by SaTScan contained the 10 simulated points and 18 additional points (small open circles) from the hospital data.
To test the effects of moving points to the center of zip code areas, we created 80 simulated clusters. Cluster points were randomly scattered within circles of 4 radius sizes (0.5, 1, 2, and 3 km). To assess the effects of moving points to census tract centroids, we created 40 simulated clusters; points were scattered within circles of 2 radius sizes (0.5 and 1 km). An open source software tool, AEGIS-CCT (available at http://sourceforge.net/projects/chipcluster),25 was used to create these clusters.
Points from a single cluster may reside in more than 1 administrative region. As a means of testing the effects of cluster points crossing administrative boundaries when these points were analyzed as centroids, the 10 points that made up each cluster were selected so that they fell into a total of 1, 2, 3, or 4 administrative regions. By design, these points were distributed as evenly as possible when they fell into more than 1 region, because this pattern was considered most difficult to detect. For example, when points were dispersed into 2 regions, 5 points were included in each region.
Simulated clusters varied on 2 parameters: radius size and dispersion across administrative boundaries. To allow selection of 5 samples for each radius size and dispersion value, we initially created 17 280 simulated clusters. The underlying geography of the study region affected the range of these parameters. For example, simulated clusters with a 0.5-km radius that included all 10 points in a single zip code area could be readily obtained. There were 1603 initial clusters with these characteristics, and 5 were randomly sampled. However, no initial clusters with a radius of 2 or 3 km included 10 points within a single census tract. Therefore, these 2 radius sizes were not analyzed for census tract regions.
Cluster Detection Test Sets
We added simulated cluster points to authentic emergency department data for the initial target date, June 23, 2002, and the preceding 6 days. This single week of data, which contained the simulated outbreak, was compared with the previous 6 weeks of baseline data. The target date then increased by 5 days. This procedure was repeated until the final target date, June 22, 2005, yielding 220 data sets with which to test each simulated cluster.
To evaluate spatial cluster detection rates in actual emergency department data when no simulated clusters were added, we prepared additional data sets to compare encounters from each target date and the previous 6 days with encounters from the preceding 6 weeks. Although these rates may have reflected previously undetected spatial clustering in the background emergency department data, we treated them as false-positive events.
Cluster Detection
We used a spatial scan statistic22 implemented in the SaTScan program26 to detect spatial clustering. SaTScan creates circles of various sizes around each point and evaluates whether location inside as opposed to outside a given circle is associated with a higher risk of classification as a case (as defined subsequently). For each data set, the program identified the most likely clusters and assigned P values on the basis of 999 Monte Carlo replications. When the P value was less than.05, the presence of clustering was assumed. The output from SaTScan included information regarding individual points contained in each cluster. Consequently, it was possible to compare features of the simulated cluster with features of the most likely cluster identified by SaTScan.
SaTScan was configured to detect purely spatial clusters with a Bernoulli (case–control) model. Cases were defined as all encounters in each data set that occurred during the final (seventh) week assessed. Controls were defined as all encounters in each data set that occurred during the first 6 weeks, during which time it was assumed that no spatial clustering took place. This assumption could not be verified, however, because there was no documentation of known clusters of respiratory cases in the present data. We ran SaTScan 35 200 times (80 simulated clusters × 220 data sets × 2 levels of address precision) to assess the effect of moving a point from its exact location to a zip code centroid and 17 600 times (40 × 220 × 2) to assess the effect of moving a point from its exact location to a census tract centroid.
Other Statistical Analyses
All other statistical analyses were performed with SAS (SAS Institute, Cary, NC). We conducted separate analyses for zip code areas and census tracts so that we could compare the 2 levels of the independent variable, address precision (exact coordinates vs a regional centroid). One dependent variable was detection rate, which was defined as the percentage of significant spatial clusters, that is, those with SaTScan P values below.05. We assessed accuracy with 2 additional dependent variables: proportion of significant clusters containing at least half of the simulated points and number of additional authentic emergency department visits drawn into the clusters.
Two other independent variables were radius size of the simulated cluster and number of regions into which simulated cluster points fell. Generalized estimating equations were used to account for the covariance between observations at the 2 levels of address precision. Preliminary analyses revealed significant interactions between the independent variables. Consequently, we conducted separate analyses for each radius size and number of regions, focusing on the comparison of exact coordinates with regional centroids.
RESULTS
Baseline Spatial Cluster Detection Rates
We examined the assumption that spatial clustering did not occur in the background emergency department data by calculating cluster detection rates for data that did not contain the simulated cluster points. We expected a false-positive rate of 5%. Detection rates did not differ significantly when addresses were converted from exact locations to zip code centroids. Background cluster identification rates were 13% (28 of 220) for exact locations and 9% (20 of 220) for zip code centroids (odds ratio [OR] = 1.46; 95% confidence interval [CI] = 0.79, 2.68). The background cluster detection rate was 11% (25 of 220) when addresses were converted from their exact locations to census tract centroids, and this rate did not differ from the rate observed for exact locations (OR = 1.14; 95% CI = 0.64, 2.02).
Detection of Simulated Clusters by Level of Address Precision
We analyzed overall detection results for exact coordinates and regional centroids. The clusters identified by SaTScan could contain the simulated cluster points, the cluster points from the background emergency department data, or both types of cluster points. Exact coordinates yielded more (12 858; 73%) significant clusters than zip code centroids (7876; 45%; OR = 3.35; 95% CI = 3.20, 3.50). Similarly, exact coordinates yielded more significant clusters (8126; 92%) than census tract centroids (7117; 81%; OR = 2.85; 95% CI = 2.59, 3.13).
As a measure of accuracy, we required that significant clusters contain at least half of the original simulated points. A larger absolute number and a larger proportion of the significant clusters met this requirement when exact coordinates were analyzed. Of the 12858 significant clusters, 12016 (93%) contained 5 to 10 simulated points when they were analyzed as exact coordinates; when these clusters were analyzed as zip code centroids, 6842 (87%) contained 5 to 10 simulated points (OR=2.16; 95% CI=1.96, 2.37). Results were similar when we compared exact coordinates (n= 7997; 98%) with census tract centroids (n= 6796; OR=2.93; 95% CI=2.38, 3.60).
As another measure of accuracy, we calculated the numbers of additional points from the background emergency department data that were drawn into the significant clusters. The clusters contained fewer additional emergency department visit points (i.e., points that were not part of the original simulated cluster) when addresses were analyzed as exact locations (mean = 4, SD = 10, range = 0–111) than when they were analyzed as zip code centroids (mean = 10, SD = 21, range = 0–157). Similarly, fewer additional emergency department visits (mean = 2, SD = 6, range = 0–100) were included in the cluster when these visits were analyzed as exact locations than when they were analyzed as census tract centroids (mean = 4, SD = 11, range = 0–147).
Additional Independent Variables
Effects on detection rates.
The overall results were complicated by interactions between address precision and the other 2 independent variables (simulated cluster radius and number of regions into which the simulated cluster points fell). Therefore, we conducted separate analyses exploring the effects of these variables. Cluster detection rates for precise locations and zip code and census tract centroids are shown in Table 1 ▶. The odds ratios indicate that exact coordinates yielded higher rates than centroids.
TABLE 1—
Percentages of Significant SaTScan Clusters for Points Analyzed as Either Exact Coordinates or Centroids of Zip Code or Census Tracts
| Radius of Simulated Cluster and No. of Regions | Exact Coordinates, % | Centroid, % | Odds Ratio (95% Confidence Interval) |
| Zip code | |||
| 0.5 km | |||
| 1 | 91.5 | 83.3 | 2.18 (1.82, 2.60) |
| 2 | 89.4 | 27.7 | 21.90 (17.70, 27.10) |
| 3 | 89.5 | 58.9 | 5.97 (4.97, 7.19) |
| 4 | 100.0 | 29.1 | ∞ |
| 1 km | |||
| 1 | 100.0 | 87.6 | ∞ |
| 2 | 71.8 | 36.8 | 4.37 (3.81, 5.02) |
| 3 | 91.9 | 45.1 | 13.83 (11.09, 17.26) |
| 4 | 85.5 | 28.3 | 14.90 (12.36, 17.98) |
| 2 km | |||
| 1 | 91.1 | 80.4 | 2.50 (2.08, 3.00) |
| 2 | 59.8 | 31.4 | 3.26 (2.85, 3.72) |
| 3 | 52.0 | 31.8 | 2.32 (2.05, 2.62) |
| 4 | 37.2 | 11.5 | 4.58 (3.76, 5.56) |
| 3 km | |||
| 1 | 96.5 | 94.1 | 1.76 (1.27, 2.43) |
| 2 | 41.1 | 31.3 | 1.53 (1.36, 1.73) |
| 3 | 48.5 | 22.5 | 3.26 (2.81, 3.78) |
| 4 | 23.0 | 16.4 | 1.53 (1.29, 1.80) |
| Census tract | |||
| 0.5 km | |||
| 1 | 100.0 | 99.8 | ∞ |
| 2 | 99.0 | 96.4 | 3.74 (2.13, 6.54) |
| 3 | 93.3 | 70.0 | 5.94 (4.75, 7.43) |
| 4 | 99.7 | 61.5 | 228.47 (73.69, 708.41) |
| 1 km | |||
| 1 | 100.0 | 97.7 | ∞ |
| 2 | 97.1 | 90.1 | 3.67 (2.55, 5.29) |
| 3 | 71.2 | 64.5 | 1.36 (1.22, 1.51) |
| 4 | 78.5 | 66.9 | 1.80 (1.57, 2.06) |
Note. SaTScan was run 1100 times per cell to calculate percentages of clusters significant at P <.05. Number of regions indicates the number of administrative regions (zip code or census tract) into which the 10 simulated cluster points fell.
Accuracy of spatial cluster detection.
As mentioned, as a measure of accuracy, we required that significant clusters contain at least half of the simulated points (Table 2 ▶). When the simulated points fell into multiple administrative regions, exact locations almost always yielded larger proportions of clusters with 5 to 10 simulated points, as well as larger absolute numbers. However, when the simulated points fell into only 1 region, the differences in proportions were small, even when they were statistically significant. Nonetheless, exact coordinates yielded larger absolute numbers of clusters considered accurately detected.
TABLE 2—
Percentages of Significant SaTScan Clusters Containing at Least Half of the Simulated Cluster Points
| Significant Clusters With 5–10 of the Simulated Points | |||
| Radius of Simulated Cluster and No. of Regions | Exact Coordinates,% (No.) | Centroid,% (No.) | Odds Ratio (95% Confidence Interval) |
| Zip code | |||
| 0.5 km | |||
| 1 | 99 (994) | 98 (894) | 1.88 (1.05, 3.38) |
| 2 | 98 (963) | 78 (239) | 13.30 (8.23, 21.48) |
| 3 | 98 (963) | 89 (577) | 5.39 (3.39, 8.57) |
| 4 | 100 (1099) | 79 (253) | 291.0 (39.91, 2122.6) |
| 1 km | |||
| 1 | 99 (1094) | 98 (942) | 4.26 (1.90, 9.54) |
| 2 | 92 (728) | 85 (346) | 2.00 (1.47, 2.73) |
| 3 | 98 (993) | 82 (407) | 12.06 (7.39, 19.68) |
| 4 | 97 (913) | 79 (247) | 8.76 (5.65, 13.60) |
| 2 km | |||
| 1 | 97 (974) | 97 (857) | 1.10 (0.69, 1.74) |
| 2 | 88 (581) | 82 (282) | 1.69 (1.25, 2.27) |
| 3 | 85 (486) | 67 (233) | 2.84 (2.17, 3.71) |
| 4 | 69 (284) | 33 (41) | 4.71 (3.20, 6.92) |
| 3 km | |||
| 1 | 98 (1045) | 99 (1020) | 0.90 (0.47, 1.75) |
| 2 | 75 (340) | 82 (281) | 0.68 (0.52, 0.89) |
| 3 | 81 (434) | 51 (127) | 4.10 (3.09, 5.45) |
| 4 | 49 (125) | 53 (96) | 0.85 (0.62, 1.17) |
| Census tract | |||
| 0.5 km | |||
| 1 | 100 (1100) | 99 (1086) | ∞ |
| 2 | 99 (1081) | 99 (1049) | 1.42 (0.66, 3.03) |
| 3 | 99 (1011) | 91 (702) | 6.53 (3.91, 10.90) |
| 4 | 100 (1093) | 93 (628) | 21.32 (7.65, 59.45) |
| 1 km | |||
| 1 | 100 (1099) | 98 (1053) | 22.96 (3.08, 170.96) |
| 2 | 99 (1056) | 98 (975) | 1.44 (0.72, 2.91) |
| 3 | 94 (736) | 88 (622) | 2.22 (1.62, 3.03) |
| 4 | 95 (821) | 93 (681) | 1.58 (1.12, 2.23) |
To further assess accuracy, we examined the number of emergency department visit points included in significant clusters containing at least 5 to 10 simulated points. These results are presented in Figures 1 ▶ and 2 ▶. We analyzed the same simulated cluster using either exact locations or zip code centroids (Figure 1 ▶). Both clusters identified by SaTScan were significant and contained the 10 original simulated points. Four additional emergency department visits were included in the cluster when points were analyzed as exact locations. However, when points were analyzed as zip code centroids, 18 additional visits were included in the significant cluster.
FIGURE 2—
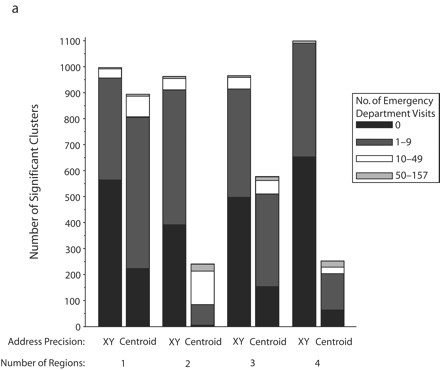
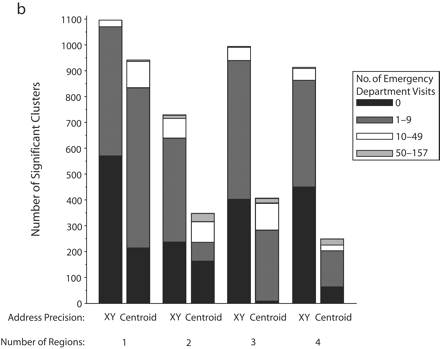
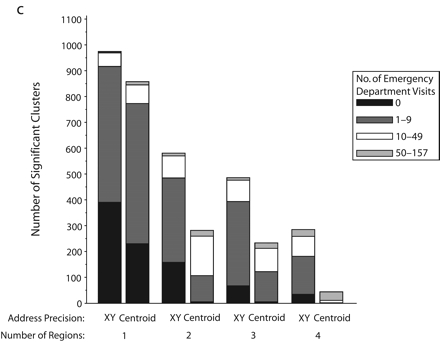
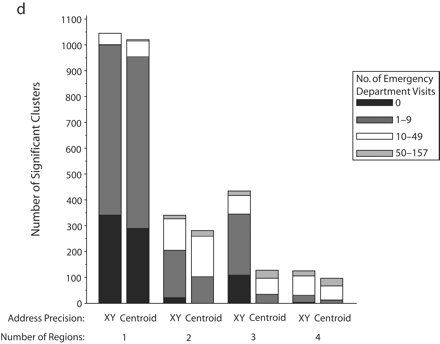
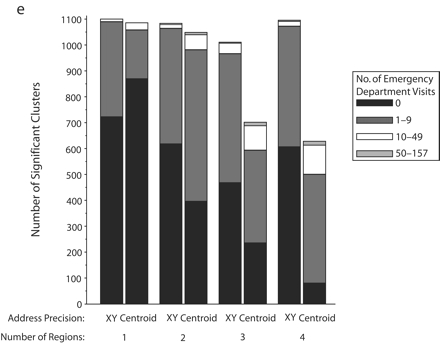
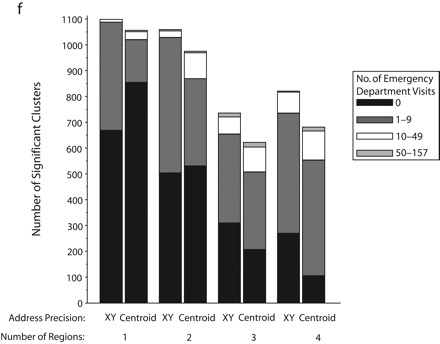
Significant SaTScan clusters that contained at least half of the simulated cluster points, by type of administrative region and radius size of the simulated cluster: zip code area, 0.5-km radius (a); zip code area, 1-km radius (b); zip code area, 2-km radius (c); zip code area, 3-km radius (d); census tract, 0.5-km radius (e); and census tract, 1-km radius (f).
Note. Pairs of bars compare clusters identified by SaTScan when points were analyzed at two levels of address precision, as either exact x-y coordinates or as centroids of administrative regions (zip codes or census tracts). The height of the bars indicates the number of significant clusters that contained at least half (5–10) of the simulated points that were inserted into the data. Bands within the bars indicate the number of additional points in the clusters that came from the background emergency department visits. Number of regions refers to the number of administrative regions into which the simulated cluster points fell.
The individual graphs in Figure 2 ▶ show the total numbers of significant clusters that contained at least half of the simulated points and indicate whether these clusters may have been obscured by inclusion of an excessive number of additional emergency department visit points. The solid black portion of each bar highlights clusters containing only the simulated points. The cross-hatched portion highlights clusters with fewer than 10 additional emergency department visits.
As can be seen in Figure 2 ▶, use of exact locations involved at least 2 advantages over use of centroids. First, a greater proportion of the significant clusters contained 5 to 10 of the original simulated points when they were analyzed as exact locations. Second, relatively few additional emergency department visits were drawn into these clusters. However, there remained some noteworthy portions of clusters with many additional points. Also, when the simulated cluster had a 0.5-km radius and all of its points fell into a single census tract, there appeared to be some advantage to using centroids, given that more of the clusters contained no additional emergency department visits. Nevertheless, the cumulative number of clusters with 0 to 9 additional visits was almost the same for exact coordinates and census tract centroids.
DISCUSSION
Real-time population health monitoring systems, including syndromic surveillance systems, have been developed to detect abnormal patterns of disease.1,6,27 An important decision regarding the design of such systems has been the level of precision at which to store geographic data. Lower resolution data may better protect privacy. Higher resolution data may yield superior detection performance.
Characteristics of the disease cluster itself dictate whether reporting case locations as exact coordinates or as administrative region centroids leads to the highest likelihood of detection. There are clearly circumstances in which knowledge of exact locations yields superior outbreak detection performance. The present results highlight the effects of forgoing address precision and, via scan statistics, using regional centroids for spatial cluster detection.
When a small number of clustered points were dispersed over 1 to 4 regions, the simulated clusters were more accurately detected when they were analyzed as exact locations than when they were analyzed as centroids; that is, more significant clusters were identified, and these clusters were more likely to include at least half of the simulated points. Furthermore, they often contained few surplus points from the background emergency department data.
By contrast, when clusters were analyzed as centroids, it was possible for the detection algorithm to miss all of the simulated points from 1 or more zip code or census tracts, resulting in fewer clusters with at least half of the simulated points being identified. This possibility was especially apparent when the simulated points fell into 2 zip code areas. In this situation, until the simulated cluster radius was quite large (3 km), the number of significant clusters for centroids greatly decreased (relative to exact locations) when the points for one of the zip code areas were missed.
Because census tracts are smaller than zip code areas, distances were smaller when a point moved from its exact location to a census tract centroid than when it moved to a zip code centroid. Consequently, the decrease in detection rates for census tract centroids when the simulated cluster points crossed administrative boundaries was not as dramatic as that observed for zip code areas. Nonetheless, such decreases did occur with increasing numbers of boundaries crossed.
There were some limitations associated with our study. For example, the clusters created were simulated, and thus, they represent only one of many possible scenarios for an actual outbreak. In addition, the simulated clusters were limited to a single size and circular shape, and they were placed within a specific band around a single hospital. This approach enabled us to focus on an important cluster parameter, its dispersion across administrative boundaries. However, other parameters may be important, such as population density around the cluster, which will differ from region to region. Furthermore, other spatial analytic techniques may perform differently than the scan statistic used in this study, particularly if the cluster is not circular in shape.
Also, we focused on 1 form of geographic masking, that is, moving a point to a regional centroid. This approach allowed us to evaluate current syndromic surveillance practices. However, other masking techniques exist for moving points either deterministically or stochastically to new locations, and the effects of these transformations on the results of spatial analyses remain important areas of study.3,28–30
In terms of detecting spatial clusters in the present semisynthetic surveillance data, we found that use of exact locations was generally advantageous, although there were some exceptions when cluster points were contained in a single zip code or census tract. This result illustrates that there are clearly conditions under which the power of spatial cluster detection is improved when exact address information is available. In particular, exact locations yielded improved power when the cluster crossed the artificial, administrative boundaries associated with census tracts and zip code areas. This improved power should be considered and balanced against privacy considerations in determining level of address precision in public health data exchange policies.
Acknowledgments
This work was supported by the National Library of Medicine of the National Institutes of Health (grant R01LM007970–01).
We thank Martin Kulldorff for his advice regarding SaTScan and Christopher A. Cassa for modifications that he made to his cluster creation software tool for use in this study.
Human Participant Protection This study was approved by Children’s Hospital Boston, Committe on Clinical Investigation.
Peer Reviewed
Contributors K. L. Olson contributed to the design of the study, performed all analyses, and was the lead author. S.J. Grannis and K. D. Mandl contributed to the design of the study and interpretation of the results.
References
- 1.Mandl KD, Overhage JM, Wagner MM, et al. Implementing syndromic surveillance: a practical guide informed by the early experience. J Am Med Inform Assoc. 2004;11:141–150. [DOI] [PMC free article] [PubMed] [Google Scholar]
- 2.Henning KJ. What is syndromic surveillance? MMWR Morb Mortal Wkly Rep. 2004;53(suppl):5–11.15714620 [Google Scholar]
- 3.Armstrong MP, Rushton G, Zimmerman DL. Geographically masking health data to preserve confidentiality. Stat Med. 1999;18:497–525. [DOI] [PubMed] [Google Scholar]
- 4.Drociuk D, Gibson J, Hodge J, Jr. Health information privacy and syndromic surveillance systems. MMWR Morb Mortal Wkly Rep. 2004;53(suppl):221–225. [PubMed] [Google Scholar]
- 5.Rushton G, Elmes G, McMaster R. Considerations for improving geographic information system research in public health. USISA J. 2000;12:31–49. [Google Scholar]
- 6.Lober WB, Karras BT, Wagner MM, et al. Roundtable on bioterrorism detection: information system-based surveillance. J Am Med Inform Assoc. 2002;9:105–115. [DOI] [PMC free article] [PubMed] [Google Scholar]
- 7.Heffernan R, Mostashari F, Das D, Karpati A, Kulldorff M, Weiss D. Syndromic surveillance in public health practice, New York City. Emerg Infect Dis. 2004; 10:858–864. [DOI] [PubMed] [Google Scholar]
- 8.Tsui F-C, Espino JU, Dato VM, Gesteland PH, Hutman J, Wagner MM. Technical description of RODS: a real-time public health surveillance system. J Am Med Inform Assoc. 2003;10:399–408. [DOI] [PMC free article] [PubMed] [Google Scholar]
- 9.Lombardo JS, Burkom H, Pavlin J. ESSENCE II and the framework for evaluating syndromic surveillance systems. MMWR Morb Mortal Wkly Rep. 2004; 53(suppl):159–165. [PubMed] [Google Scholar]
- 10.Platt R, Bocchino C, Caldwell B, et al. Syndromic surveillance using minimum transfer of identifiable data: the example of the National Bioterrorism Syndromic Surveillance Demonstration Program. J Urban Health. 2003;80(suppl 1):i25–i31. [DOI] [PMC free article] [PubMed] [Google Scholar]
- 11.Bradley CA, Rolka H, Walker D, Loonsk J. BioSense: implementation of a national early event detection and situational awareness system. MMWR Morb Mortal Wkly Rep. 2005;54(suppl):11–19. [PubMed] [Google Scholar]
- 12.Jacquez GM, Jacquez JA. Disease clustering for uncertain locations. In: Lawson A, Biggeri A, Böhning D, Lesaffre E, Viel J-F, Bertollini R, eds. Disease Mapping and Risk Assessment for Public Health. London, England: John Wiley & Sons Inc; 1999:151–168.
- 13.Jacquez G. Current practices in the spatial analysis of cancer: flies in the ointment. Int J Health Geogr. 2004;3:22. [DOI] [PMC free article] [PubMed] [Google Scholar]
- 14.Centers for Disease Control and Prevention. HIPAA privacy rule and public health: guidance from CDC and the US Department of Health and Human Services. MMWR Morb Mortal Wkly Rep. 2003;52 (suppl):1–20. [PubMed] [Google Scholar]
- 15.Gregorio DI, Dechello LM, Samociuk H, Kulldorff M. Lumping or splitting: seeking the preferred areal unit for health geography studies. Int J Health Geogr. 2005;4:6. [DOI] [PMC free article] [PubMed] [Google Scholar]
- 16.Gregorio DI, Kulldorff M, Barry L, Samociuk H. Geographic differences in invasive and in situ breast cancer incidence according to precise geographic coordinates, Connecticut, 1991–95. Int J Cancer. 2002;100:194–198. [DOI] [PubMed] [Google Scholar]
- 17.Sweeney L. k-anonymity: A model for protecting privacy. Int J Uncertain Fuzziness Knowledge Based Syst. 2002;10:557–570. [Google Scholar]
- 18.Malin B, Sweeney L. How (not) to protect genomic data privacy in a distributed network: using trail reidentification to evaluate and design anonymity protection systems. J Biomed Inform. 2004;37:179–192. [DOI] [PubMed] [Google Scholar]
- 19.Kamel Boulos MN, Cai Q, Padget JA, Rushton G. Using software agents to preserve individual health data confidentiality in microscale geographical analyses. J Biomed Inform. 2006;39:160–170. [DOI] [PubMed] [Google Scholar]
- 20.Mandl KD, Reis BY, Cassa C. Measuring outbreak-detection performance by using controlled feature set simulations. MMWR Morb Mortal Wkly Rep. 2004; 53(suppl):130–136. [PubMed] [Google Scholar]
- 21.Olson KL, Bonetti M, Pagano M, Mandl KD. Real time spatial cluster detection using interpoint distances among precise patient locations. BMC Med Inform Decis Mak. 2005;5:19. [DOI] [PMC free article] [PubMed] [Google Scholar]
- 22.Kulldorff M. A spatial scan statistic. Commun Stat Theory Methods. 1997;26:1481–1496. [Google Scholar]
- 23.Kulldorff M, Heffernan R, Hartman J, Assuncao R, Mostashari F. A space-time permutation scan statistic for disease outbreak detection. PLoS Med. 2005;2:e59. [DOI] [PMC free article] [PubMed] [Google Scholar]
- 24.Beitel AJ, Olson KL, Reis BY, Mandl KD. Use of emergency department chief complaint and diagnostic codes for identifying respiratory illness in a pediatric population. Pediatr Emerg Care. 2004;20:355–360. [DOI] [PubMed] [Google Scholar]
- 25.Cassa C, Olson KL, Mandl KD. A software tool for creating simulated outbreaks to benchmark surveillance systems. BMC Med Inform Decis Mak. 2005;5:22. [DOI] [PMC free article] [PubMed] [Google Scholar]
- 26.Kulldorff M. SaTScan Version 5.0: Software for the Spatial and Space-Time Scan Statistics. Silver Spring, Md: Information Management Services; 2004.
- 27.Rushton G. Public health, GIS, and spatial analytic tools. Annu Rev Public Health. 2003;24:43–56. [DOI] [PubMed] [Google Scholar]
- 28.Cassa CA, Grannis SJ, Overhage JM, Mandl KD. A context-sensitive approach to anonymizing spatial surveillance data: impact on outbreak detection. J Am Med Inform Assoc. 2006;13:160–165. [DOI] [PMC free article] [PubMed] [Google Scholar]
- 29.Kwan M-P, Casas I, Schmitz BC. Protection of geoprivacy and accuracy of spatial information: How effective are geographical masks? Cartographica. 2004;39:15–28. [Google Scholar]
- 30.Leitner M, Curtis A. Cartographic guidelines for geographically masking the locations of confidential point data. Cartographic Perspect. 2004;49:22–39. [Google Scholar]


