

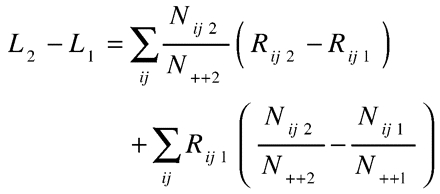
Yang et al.1 applied an underutilized demographic technique, developed by Kitagawa,2 to decompose temporal trends in low birth-weight (LBW) into changes in the distribution of maternal age and parity versus changes in the age- and parity-specific rates of LBW. The authors concluded that temporal increases in LBW were largely the result of changes in age- and parity-specific rates rather than age–parity distributional shifts. The applied method, which elegantly partitions the difference between 2 aggregate rates into differences in factor-specific rates and differences in factor distribution, requires a population standard to which differences in factor-specific rates and proportions are weighted. Although Yang et al. appropriately noted that the size of the 2 components (rates vs distribution) depends on the choice of the standard population, we were puzzled by the authors’ selection of a standard with the age–parity distribution of 1980 and age-and parity-specific LBW rates of 2000 (equation 1a). The authors could have equally arbitrarily specified the reference as having the 2000 age–parity distribution and the 1980 age- and parity-specific rates (equation 1b):
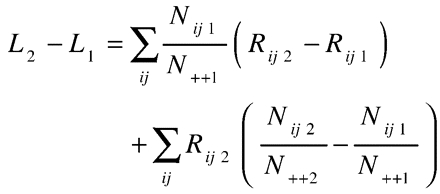
Let L1 and L2 be the crude LBW rates for 1980 and 1990; Nij1/N++1 and Nij2/N++2 the age- and parity-specific proportions of all births in 1980 and 1990, respectively; and Rij1 and Rij2 the age- and parity-specific LBW rates in 1980 and 2000, respectively.
To avoid defining the standard population as having the distribution of one time and the factor-specific rates of the other time when comparing the same population at 2 points in time, Kitagawa proposed a symmetric solution using the average age–parity distribution to weight the rate component and the average age- and parity-specific rates to weight the distribution component (equation 2)2:
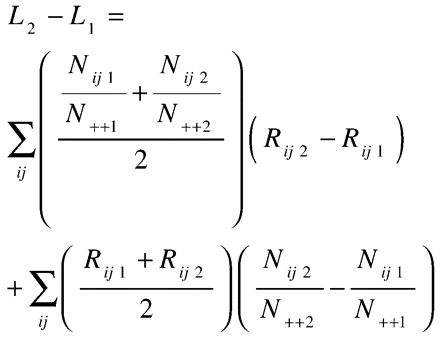
Kitagawa noted that this solution yields estimates that are the average of the components from equations 1a and 1b, which provide the range of variation for each component. By using only equation 1a, Yang et al. calculated only one end of this range. This is analogous to presenting one end of a confidence interval instead of the midpoint. We argue, in agreement with Kitagawa, that equation 2 is the more appropriate solution, because it assumes that both the distribution and the rates changed between the 2 time periods and because it does not favor one time over the other in the weights for the 2 components. Others have developed additional techniques that are useful alternatives under certain conditions.3,4
We venture that Yang et al. may have overestimated the contribution of age–parity distributional changes by applying the now higher LBW rates as weights. Perhaps the authors would consider reporting summary results obtained with our suggested alternative.2 We applaud the use of this underutilized demographic technique and wish only to promote its proper application.
References
- 1.Yang Q, Greenland S, Flanders WD. Associations of maternal age- and parity-related factors with trends in low-birthweight rates: United States, 1980 through 2000. Am J Public Health. 2006;96:856–861. [DOI] [PMC free article] [PubMed] [Google Scholar]
- 2.Kitagawa E. Components of a difference between two rates. J Am Stat Assoc. 1955;50:1168–1194. [Google Scholar]
- 3.Kim YJ, Strobino DM. Decomposition of the difference between two rates with hierarchical factors. Demography. 1984;21:361–372. [PubMed] [Google Scholar]
- 4.Das Gupta P. A general method of decomposing a difference between two rates into several components. Demography. 1978;15:99–112. [PubMed] [Google Scholar]