Abstract
Gram-negative and Gram-positive bacteria are sensed by Toll-like receptor (TLR)4 and TLR2, respectively. TLR4 recruits MyD88 and TRIF, whereas TLR2 recruits MyD88 without TRIF. NOSII and TNFα are central genes in innate immunity and are thought to be differentially regulated by the MyD88 versus TRIF signalling pathways. Here, we have used Gram-positive Staphylococcus aureus, Gram-negative Escherichia coli and highly selective TLR ligands to establish the precise relationship between TLR2, TLR1, TLR6 and TLR4 for NOSII versus TNFα induction.
In murine macrophages at 24 h, E. coli or LPS (TLR4) induced NO and TNFα release. In contrast, S. aureus (TLR2/TLR1/TLR6) or Pam3CSK4 (TLR2/TLR1), or FSL-1 and LTA (TLR2/TLR6) induced TNFα without an effect on NO.
At later time points (48–72 h), S. aureus induced NO release. The ability of S. aureus, but not E. coli or LPS, to induce NO release was inhibited by anti-TNFα-binding antibodies.
At 24 h, LPS synergised with TLR2 ligands to induce NO release and NOSII protein expression. LPS also induced the expression of TLR2 gene expression without affecting levels of TLR4.
Using cells from TLR2−/− or TLR4−/− mice, the ability of LPS to synergise with S. aureus or Pam3CSK4 was found to be dependent on both TLR2 and TLR4.
These observations are the first to clearly delineate the role of separately activating TLR2 and TLR4 in the induction of NOSII and TNFα genes compared with their coinduction when both receptor pathways are activated.
Keywords: Toll-like receptors, nitric oxide, TNF, LPS, PAMPs, purrs, bacteria
Introduction
Pathogens have, within their structure, ‘pathogen-associated molecular patterns' (PAMPs), which are ligands for ‘pattern recognition receptors' (PRRs) expressed on immune cells (Moynagh, 2005). Gram-negative bacteria and LPS activate, and are therefore sensed by, the PRR Toll-like receptor (TLR)4. Gram-positive bacteria or fungi activate TLR2. TLR2 forms heterodimers with either TLR1 or TLR6. There are two well-defined TLR signalling pathways mediated, respectively, by MyD88 (together with MAL) or TRIF (together with TRAM) adapter proteins. TLR4 activation results in the recruitment of both MyD88 and TRIF, whereas TLR2 activation results in the recruitment of MyD88 and not TRIF. MyD88 and TRIF are thought to orchestrate separate gene arms because of temporal differences in how they activate NF-κB (Toshchakov et al., 2002). Nitric oxide synthase II (NOSII) and TNFα are key genes in innate immunity, which are thought to be regulated by separate arms of the MyD88–TRIF adapter protein pathway (Vogel et al., 2003). However, the potential for TLR2 ligands to induce NOSII in macrophages, and the precise need or nature of a priming agent, has not been fully addressed. We have recently shown that in vascular smooth muscle, which may be different to macrophages, NOSII is induced by the TLR2 ligands Staphylococcus aureus and MALP-2 (Cartwright et al., 2005). Thus, the precise nature of how TLR4 versus TLR2 may regulate NOSII and TNFα is not clear. Moreover, the potential for TLR ligands to interact and modulate NOSII versus TNFα has not been fully addressed. Thus, in the current study, we have used murine macrophages as a model to study the responses of whole heat-killed bacteria and selective bacterial TLR ligands on NOSII and TNFα induction. Some of these observations have been published in abstract form (Anandarajah et al., 2003; Belcher et al., 2003).
Methods
All cell culture reagents were supplied by Invitrogen (Paisley, Renfrewshire, U.K.), unless stated otherwise. Primary antibody to NOSII (SC-650) was purchased from Santa Cruz Biotechnology (Santa Cruz, CA, U.S.A.). Goat anti-rabbit IgG-horseradish peroxidase was purchased from Dako Cytomation (Cambridge, U.K.). Primary antibodies to α-tubulin or TNFα were purchased from Abcam (Cambridge, U.K.). All other reagents were from Sigma Chemical Company (Poole, Dorset, U.K.), except for Pam3CSK4 and LTA, LPS and FSL-1, which were purchased from Axxora (UK) Ltd (Nottingham, U.K.).
Culture and preparation of bacteria
The clinical blood culture isolate S. aureus H380 was stored frozen in 15% glycerol and streaked onto agar plates before inoculation of single colonies into RPMI-1640 medium with 10% FCS and glutamine. Cultures were incubated at 37°C overnight and then centrifuged at 800 × g to pellet bacteria. Bacteria were then washed in sterile saline twice, and pellets were re-suspended in sterile saline. Aliquots of the bacterial suspension were serially diluted and plated onto agar in order to quantify the cell density. The bacterial suspensions were then heat treated for 45 min at 70°C to kill all bacteria; sterility was confirmed by plating of the resultant suspension. Suspensions were adjusted to 1010–1012 colony-forming units (CFU) ml−1 and then frozen with 20% glycerol in aliquots before use in cell culture experiments. Escherichia coli, reference strain 0111.B4, was also used.
Cell culture
J774.2, a murine macrophage cell line, was obtained from the European collection of cell cultures and maintained in Dulbecco's modified Eagle's medium supplemented with 10% FCS, 100 U ml−1 penicillin, 100 μg ml−1 streptomycin, 2.5 μg ml−1 amphotericin, 2 mM glutamine and 5 ml nonessential amino acids (media and supplements from Sigma, Dorset, U.K.). Before experimentation, cells were seeded into 96-well plates at a concentration of 105 cells well−1 and allowed to rest for 2 h before stimulation with whole bacteria or selective TLR ligands for 24 h at 37°C in a humidified environment containing 5% CO2. Supernatants were either used immediately for nitrite determination or stored at −80°C for the measurement of TNFα levels. In some experiments, NG-nitro-L-arginine (L-NAME), which inhibits all forms of NOS or the selective NOSII inhibitor N-(3-(aminomethyl)benzyl)acetamidine (1400W), were added 5 min before bacteria or TLR ligands. Concentrations and specific stimuli are described in Results section for individual experiments.
Mouse bone marrow-derived macrophages
Breeding pairs of TLR2−/− and TLR4−/− mice were a kind gift from Dr S. Akira (Osaka University, Osaka, Japan) and were used after at least seven generations of backcrossing to C57BL/6 mice. TLR knockout mice or wild-type controls (C57BL/6) were maintained off site at B.K. (Hull, U.K.); mice were delivered, rested for 24 h before being killed humanly. Bone marrow progenitor cells were obtained by flushing femurs and tibias of 8 to 12-week-old mice with ice-cold complete RPMI-1640 (RPMI-1640 supplemented with 10% FCS, 2 mM glutamine, 5% horse serum and 1 mM sodium pyruvate). Bone marrows were cultured for 7 days in complete RPMI-1640 supplemented with supernatant taken from L929 cells (20%; a murine M-CSF-producing cell line). After 7 days, adherent macrophages were plated in triplicate in 96-well plates at a seeding density of 105 cells well−1 and allowed to rest for 24 h before stimulation with bacterial cell wall component or whole heat-killed bacteria for 24 h at 37°C in a humidified environment containing 5% CO2. Supernatants were either used immediately for nitrite determination (Griess reaction) or stored at −70°C for measurement of TNFα levels. Concentrations and specific stimuli are described in Results section for individual experiments.
Assessment of cell respiration by MTT
The effect of whole bacteria or bacterial cell wall components on J774.2 and bone marrow-derived macrophage metabolism was assessed by measuring the mitochondrial-dependent reduction of 3-[4,5-dimethylthiazol-2-yl]-2,5-diphenyltetrazolium bromide (MTT) (Sigma, Poole, U.K.) to formazan. This was performed following all treatments. None of the treatments described significantly affected MTT.
Measurement of nitrite production by Greiss reaction
The total nitrite concentration was then determined spectrophotometrically by the Greiss reaction (Bishop-Bailey et al., 1997). Briefly, 100 μl of cell-free supernatant was mixed with equal proportions of Greiss reagent (sulphanilamide 0.5%, orthophosphoric acid 2.5% and 0.05% N-(1-naphthyl)ethyl-enediamine). Nitrite levels were measured at 550 nm and results expressed as μM concentration.
Measurement of cytokine production
TNF levels in cell-free supernatant were determined by ELISA using commercially available matched antibody pairs following a protocol furnished by the manufacturers (R & D systems, Abingdon, U.K.). TNF concentrations were measured at 450 nm with a reference filter at 550 nm and results expressed as pg ml−1.
Western blotting
In brief, cells were plated into six-well culture plates and treated with S. aureus, LPS or E. coli for 24 or 48 h. The medium was removed and cells were washed twice with ice-cold PBS. Cells were lysed using HEPES (10 mM) containing MgCl2 (3 mM), KCl (40 mM), glycerol (5%), Nonidet P-40 (0.3%) and PMSF (1 mM). Protein concentration in whole-cell preparations was measured using the Bradford assay. Samples were separated by gel electrophoresis on 6% SDS–polyacrylamide gels; after transfer onto nitrocellulose membranes, NOSII was detected using specific polyclonal rabbit antibody (1 : 1000) and the signal amplified with a goat anti-rabbit IgG-horseradish peroxidase (1 : 1000). Blots were visualised onto film using ECL reagents (Amersham Biotechnology, Oxford, U.K.). After the blots were stripped using Restore Western Blot Stripping Buffer (Pierce, IL, U.S.A.) and probed with α-tubulin (1 : 2000) that was used to confirm equal protein loading between lanes.
Reverse transcriptase–polymerase chain reaction and real-time polymerase chain reaction
Total RNA was isolated from macrophages cells using the RNeasy Mini Kit (Qiagen, Crawley, U.K.). cDNA was generated by reverse transcription using random hexamers. The cDNA (5 μg reaction−1) was used as a template in the subsequent polymerase chain reaction (PCR) analyses. Transcript levels were determined by real-time PCR (Rotor Gene 3000; Corbett Research, Sydney, Australia) using the SyberGreen PCR Master Mix Reagent Kit (Promega, Madison, WI, U.S.A.). The sequences of PCR primers were:
- TLR2:
sense, 5′-GCCACCATTTCCACGGACT; antisense, 5′-GGCTTCCTCTTGGCCTGG.
- TLR4:
sense, 5′-AGAAATTCCTGCAGTGGGTCA; antisense, 5′-TCTCTACAGCTGTTGCTTGCACATGTCA.
Primers were used at a concentration of 1 μM for real time. Cycling conditions for real-time PCR (a total of 45 cycles used) were as follows: step 1, 15 min at 95°C; step 2, 25 s at 65°C (TLR2) or 60°C (TLR4) or 55°C (GAPDH), 25 s at 72°C; step 3, 5 min at 72°C; and step 4, 5 s at 65–99°C. Data from the reaction were collected and analysed by the complementary computer software (Corbett Research). Relative quantifications of gene expression were calculated using standard curves and were normalized to GAPDH.
Statistical analysis
Statistical analysis was preformed using a one-way analysis of variance (ANOVA) followed by a Dunnet's post-test, two-way ANOVA or one-sample t-test for normally distributed data. All data shown are mean±s.e.m.
Results
Gram-positive S. aureus and Gram-negative E. coli differentially regulate NO and TNFα release from J774.2 murine macrophages after 24 h stimulation
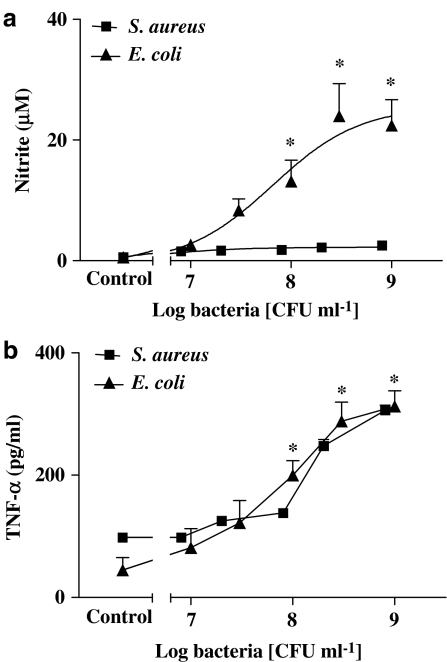
Under basal culture conditions, J774.2 macrophages released low or undetectable levels of NO. However, when cells were stimulated with whole heat-killed E. coli (107–109 CFU ml−1), there was a marked increase in levels of nitrite with an Emax of more than 30 μM nitrite (Figure 1a). Nitrite release was abolished by either L-NAME (1 mM) or 1400W (10 μM) and reduced by more than 80% when cells were pretreated (2 h) with dexamethasone (1 μM) (n=9 for each; data not shown). Similarly, E. coli caused a significant increase in TNFα release (Figure 1b). In contrast, when cells were stimulated with whole heat-killed S. aureus, at similar concentrations, no significant increase in nitrite levels were detected (Figure 1a). S. aureus increased TNFα release by equivalent amounts to those seen with E. coli (Figure 1b). The effects of E. coli or S. aureus on NO and TNFα described above in J774 macrophages were reproduced in primary cultures of murine bone marrow-derived macrophages. Using cells from TLR4−/− or TLR2−/− animals, the effects of E. coli or S. aureus were found to be TLR4- and TLR2-dependent, respectively (n=6–9; data not shown). Macrophages from TLR2−/− or TLR4−/− mice released increased levels of NO when stimulated with IL-1β plus TNFα (10 ng ml−1 each; data not shown).
Figure 1.
Effect of heat-killed Gram-positive and Gram-negative bacteria stimulation for 24 h on nitric oxide and TNF-α production from J774.2 macrophages. J774.2 macrophages were treated with either a Gram-positive bacteria S. aureus or Gram-negative bacteria E. coli (107–109 CFU ml−1) for 24 h after which levels of (a) nitrite and (b) TNF-α were determined. The data represent the mean±s.e.m.; n=9. Statistical differences (compared with control) are denoted by * and are determined where P<0.05 as calculated by ANOVA followed by Dunnet's post-test.
Effects of selective ‘bacterial-TLR ligands' on NO and TNFα production by murine macrophages
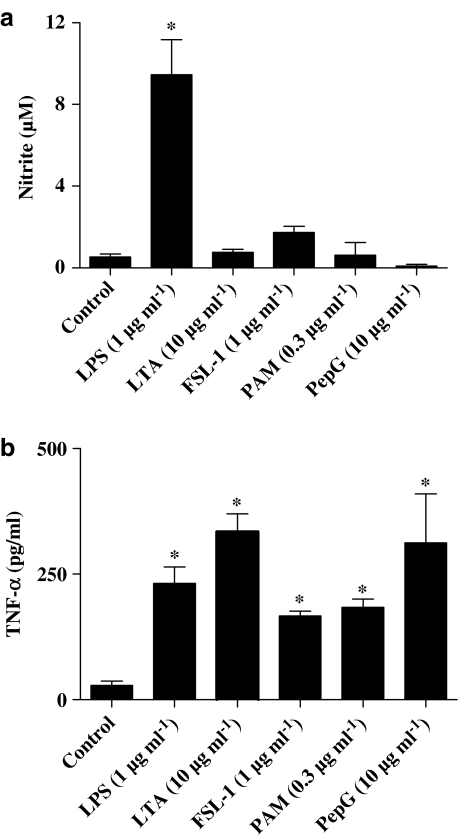
As was the case with the parent whole bacteria, the selective TLR4 ligand, LPS (purified from E. coli isotype 0111.BS; 0.01–1 μg ml−1), induced concentration-dependent corelease of nitrite (Figure 2a) and TNFα (Figure 2b) from J774.2 macrophages. Similarly, LTA (10 μg ml−1) derived from S. aureus, which activates TLR2 to form heterodimers with TLR6, induced the release of TNFα (Figure 2b) but not nitrite (Figure 2a) from J774.2 macrophages. Other selective TLR2 ligands, FSL-1 (1 μg ml−1), which also activates TLR2 and TLR6, or Pam3CSK4 (0.3 μg ml−1), which activates TLR2 and TLR1, also induced cells to release TNFα (Figure 2b) but not NO (Figure 2a).
Figure 2.
Effect of bacterial PAMPs on NO and TNF-α production from J774.2 macrophages over 24 h. J774.2 macrophages were treated with LPS (1 μg ml−1), LTA (10 μg ml−1), peptidoglycan (10 μg ml−1), Pam3CSK4 (0.3 μg ml−1) or FSL-1 (1 μg ml−1) for 24 h, after which levels of (a) nitrite and (b) TNF-α were determined. The data represent the mean±s.e.m.; n=9. Statistical differences (compared with control) are denoted by * and are determined where P<0.05 as calculated by ANOVA followed by Dunnet's post-test.
At later time points S. aureus induces NOSII via a TNFα -dependent pathway
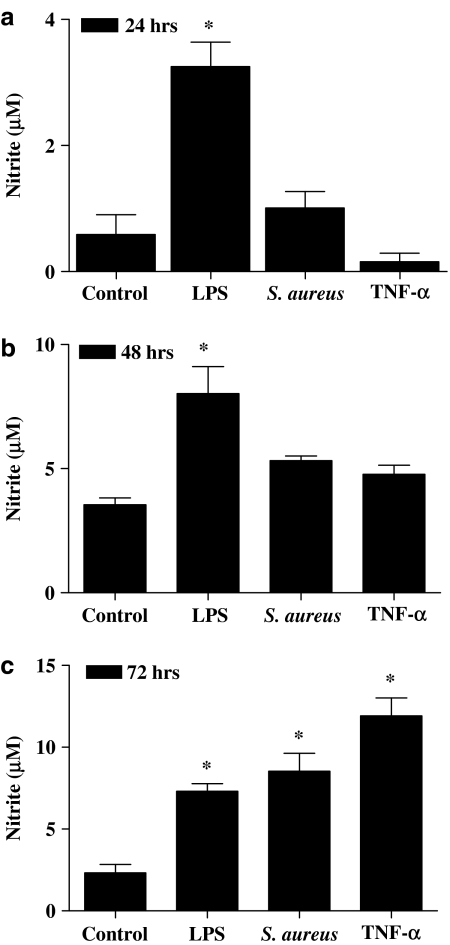
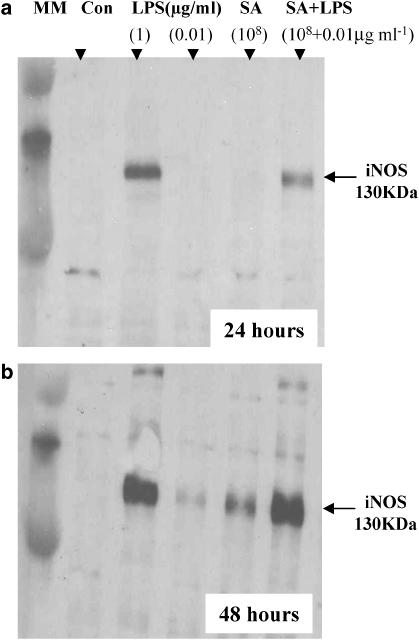
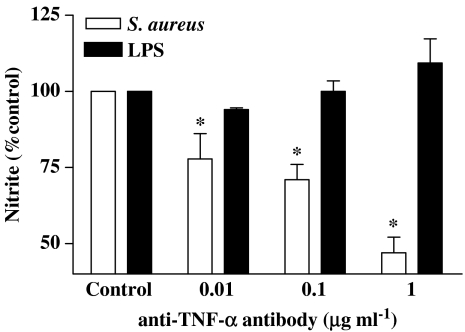
Although S. aureus did not induce NO release after 24 h stimulation (see above), it did at 72 h (Figure 3c). In line with these observations, S. aureus induced NOSII protein at 48 h, but not at 24 h, after stimulation (Figure 4). Like S. aureus, TNFα also induced NO release at later time points (Figure 3c). The ability of LPS (1 μg ml−1) to induce NO release was unaffected by anti-TNFα antibodies (Figure 5). However, the ability of S. aureus (3 × 10⁸ CFU ml−1) to induce NO release was inhibited in a concentration-dependent manner by anti-TNFα -binding antibodies (Figure 5).
Figure 3.
Effect of continued incubation with S. aureus on NO production by J774 macrophages. Macrophages were stimulated with LPS (0.01 μg ml−1), S. aureus (3 × 10⁸ CFU ml−1) or TNF-α (10 ng ml−1) for (a) 24, (b) 48 or (c) 72 h. The data represent the mean±s.e.m.; n=6. Statistical differences (compared with control) are denoted by * and are determined where P<0.05 as calculated by ANOVA followed by Dunnet's post-test.
Figure 4.
Effect of LPS and S. aureus (SA) alone and in combination with NOSII induction at 24 and 48 h in J774 macrophages. Macrophages were treated with LPS at 1 or 0.01 μg ml−1 or with S. aureus (108 CFU ml−1) for (a) 24 or (b) 48 h. NOSII-like immunoreactivity migrated at the predicted molecular weight of 130 kDa.
Figure 5.
Effect of anti-TNF-α-binding antibodies on NO release by J774 macrophages stimulated with LPS (0.1 μg ml−1) or S. aureus (3 × 10⁸ CFU ml−1) for 72 h. Data are the mean±s.e.m. from n=3 experiments. Data were normalised to control and differences in responses calculated using one-sample t-test. Statistical differences (compared with control) are denoted by * and are determined where P<0.05.
Effects of costimulation with TLR2 and TLR4 ligands on NO and TNFα release by murine macrophages
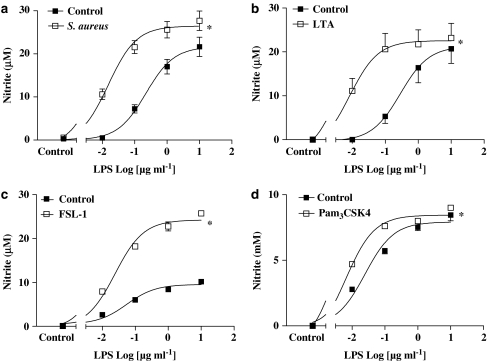
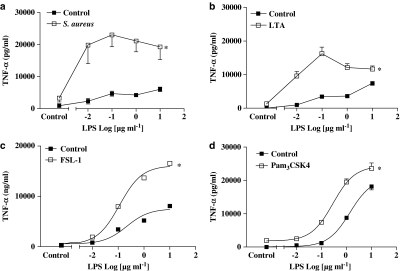
Although TLR2 ligands alone did not induce the release of nitrite by J774.2 macrophages at 24 h (see Figure 1), S. aureus (109 CFU ml−1; Figure 6a), LTA (10 μg ml−1; Figure 6b), FSL-1 (1 μg ml−1; Figure 6c) or Pam3CSK4 (0.3 μg ml−1; Figure 6d) synergised with LPS (0.01–10 μg ml−1) to release NO. In line with observations made with NO, S. aureus (109 CFU ml−1; Figure 7a), LTA (10 μg ml−1; Figure 7b), FSL-1 (1 μg ml−1; Figure 7c) or Pam3CSK4 (0.3 μg ml−1; Figure 7d) synergised with LPS to release TNFα. Similarly to observations made with LTA, Pam3CSK4 or FSL-1, PepG synergised with LPS to release NO but in contrast, to results with other PAMPs, did synergise with LPS to release TNFα from macrophages (data not shown).
Figure 6.
Synergistic effect of LPS in combination with Gram-positive bacteria (S. aureus) or other TLR2 ligands on NO production from J774.2 macrophages at 24 h. J774 macrophages were costimulated for 24 h with different concentrations of LPS and (a) S. aureus (108 CFU ml−1), (b) LTA (10 μg ml−1), (c) FSL-1 (1 μg ml−1) or (d) Pam3CSK4 (0.3 μg ml−1). The data represent the mean±s.e.m. for at least n=9 experiments. Statistical differences (compared with control) are denoted by * and are determined where P<0.05 as calculated by two-way ANOVA.
Figure 7.
Synergistic effect of LPS in combination with Gram-positive bacteria (S. aureus) or other TLR2 ligands on TNF-α production from J774.2 macrophages at 24 h. J774 macrophages were costimulated for 24 h with different concentrations of LPS and (a) S. aureus (108 CFU ml−1), (b) LTA (10 μg ml−1), (c) FSL-1 (1 μg ml−1) or (d) Pam3CSK4 (0.3 μg ml−1). The data represent the mean±s.e.m. for at least n=9 experiments. Statistical differences (compared with control) are denoted by * and are determined where P<0.05 as calculated by two-way ANOVA.
Effects of TLR2 or TLR4 ligands on the expression of TLR2 or TLR4 gene expression
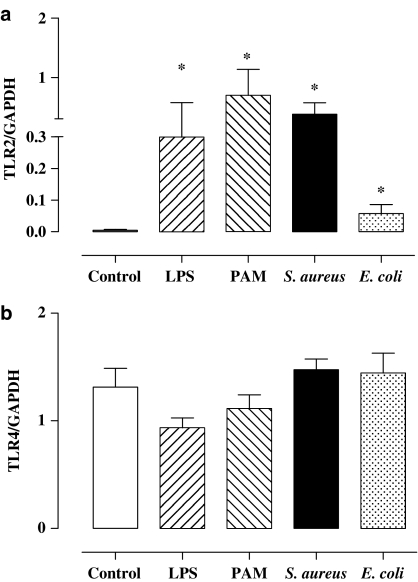
Under control culture conditions, murine macrophages expressed relatively low levels of TLR2 (Figure 8a) compared with levels of TLR4 (Figure 8b). When cells were treated for 3 h with LPS or E. coli to activate TLR4, the levels of TLR2 were increased (Figure 8a). In contrast, neither E. coli nor LPS affected significantly TLR4 expression at this time point (Figure 8b). Interestingly, TLR2 ligands S. aureus and Pam3CSK4 also increase levels of TLR2 (Figure 8a) expression without affecting TLR4 (Figure 8b).
Figure 8.
Effect of TLR2 or TLR4 ligands on the expression of TLR2 and TLR4 gene. J774.2 macrophages were treated for 3 h with LPS (1 μg ml−1), Pam3CSK4 (0.3 μg ml−1), S. aureus (108 CFU ml−1) or E. coli (108 CFU ml−1) and levels of (a) TLR2 mRNA and (b) TLR4 mRNA were determined by RT-PCR. Levels of TLR4 and TLR2 mRNA levels were corrected by expressing data as a ratio of GAPDH in each sample. The data are the mean±s.e.m. for n=6. Statistical differences (compared with control) are denoted by * and are determined where P<0.05 as calculated by one-way ANOVA.
Role of TLR2 and TLR4 in the synergistic activation of macrophages by bacterial ligands
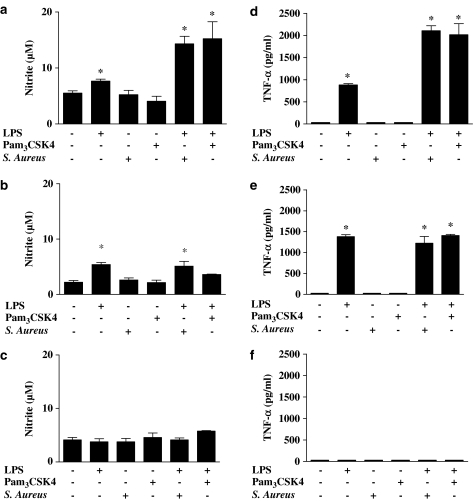
Under control culture conditions, primary bone marrow-derived macrophages from wild-type (C57BL/6) mice released low levels of nitrite (Figure 9a–c) or TNFα (Figure 9d–f). However, threshold concentrations of LPS (0.01 μg ml−1) increased NO and TNFα release by these cells. Threshold concentrations of Pam3CSK4 (30 ng ml−1) or S. aureus (107 CFU ml−1) had no effect on NO release, but did interact with LPS to release NO, and TNFα, in a synergistic manner (Figure 9a and d). LPS and Pam3CSK4 or S. aureus were not able to induce a synergistic release of NO or TNFα in cells from mice deficient in either TLR4 (TLR4−/−) or TLR2 (TLR2−/−) (Figure 9). LPS induced NO and TNFα release in TLR2−/− cells (Figure 9b and e) but not in TLR4−/− cells (Figure 9c and f). When higher concentrations of either Pam3CSK4 (0.3 μg ml−1) or S. aureus (108 CFU ml−1) were used, TNFα release was detected in cells from wild-type or from TLR4−/− mice, but not from TLR2−/− mice (data not shown).
Figure 9.
Effect of threshold concentrations of LPS (0.01 μg ml−1), Pam3CSK4 (0.03 μg ml−1) or S. aureus (108 CFU ml−1) stimulated for 24 h on NO production by bone marrow-derived macrophages from (a) wild-type mice, (b) TLR2−/− mice and (c) TLR4−/− mice. TNF-α levels were measured in the same samples of bone marrow-derived macrophages stimulated for 24 h with threshold concentrations of LPS (0.01 μg ml−1), Pam3CSK4 (0.03 μg ml−1) or S. aureus (108 CFU ml−1) from (d) wild-type mice, (e) TLR2−/− mice and (f) TLR4−/− mice. The data are the mean±s.e.m. for n=9. Statistical differences (compared with control; that is, no treatment) are denoted by * and are determined where P<0.05 as calculated by one-way ANOVA.
Discussion
TLR4 is the PRR for LPS from Gram-negative E. coli. In the current study, we show that in macrophages this is true also for whole bacteria, as the ability of whole E. coli to induce macrophages to release NO or TNFα is absent in cells from TLR4−/− mice. For Gram-positive bacteria, TLR2 is the predominant PRR (Takeuchi et al., 1999; Jimenez et al., 2005). However, unlike TLR4, which acts alone, TLR2 must form heterodimers with either TLR1 or TLR6 before activation occurs. In the current study, we show that TLR4 activation results in the coinduction of NOSII and TNFα in macrophages. In contrast, we show that TLR2 activation, either together with TLR1 or together with TLR6, results in the induction of TNFα alone. We show that Gram-positive and Gram-negative bacteria synergise with each other to release NO and TNFα. This effect is mimicked by selective ligands for TLR4 and TLR2/TLR6 or TLR2/TLR1 and absent in cells from mice lacking TLR4 or TLR2. Finally, we show that when macrophages are exposed to Gram-positive bacteria for prolonged periods of time (48–72 h), they induce NOSII without the need for priming with LPS and that this phenomenon is mediated by the endogenous release of TNFα.
TLR activation leads to the recruitment of the MyD88 and/or the TRIF adapter protein pathways. TLR4 recruits both MyD88 and TRIF, whereas TLR2 recruits MyD88 only. Activation of the MyD88 or TRIF pathways is thought to result in the induction of separate banks of genes because of temporal differences in how NF-κB is activated (Toshchakov et al., 2002). NOSII and TNFα are key genes in innate immunity and in inflammation. Interestingly, the induction of NOSII and TNFα are thought to occur via separate arms of the adapter protein pathways. TNFα is induced following the activation of MyD88, whereas NOSII is thought to require TRIF activation before induction can occur. In a study of the effects of LPS and TLR2 agonists on RAW 264.7 macrophages, NF-κB, activated protein-1 (AP-1) and mitogen-activated protein (MAP) kinases were all similarly activated by both TLR2 and TLR4 ligands, while differentially releasing TNF and NO (Jones et al., 2001). This shows that different TLR proteins are capable of activating distinct cellular responses, in spite of many of their shared signalling capacities. TNF release following TLR stimulation is achieved by NF-κB activation, whereas induction of NOSII is affected by NF-κB-induced IFN-β stimulation of IRF-3 (Vogel et al., 2003). Differential activation by TLR2 and TLR4 of this part of the signalling pathway is unexplored and is a possible explanation of the findings presented in this study. In the current study, we show that TLR4 ligands (whole Gram-negative E. coli or purified LPS) activate macrophages to release NO and TNFα. This observation is consistent with others in the literature and fully supports the notion that they are activating cells via TLR4 and the subsequent recruitment of MyD88 and TRIFF. However, our study is the first to show that Gram-positive bacteria stimulate the release of TNFα without inducing NOSII in macrophages. This result may be surprising because whole bacteria contain a number of PAMPs, which may act together to influence the TRIF, as well as the MyD88 pathways. In line with observations with whole Gram-positive bacteria, we also found that ligands for either TLR2 and TLR6 (LTA, FSL-1) or TLR2 and TLR1 (Pam3CSK4) induced macrophages to release TNFα, but not NO. These observations clearly establish pharmacologically that NO and TNFα are on separate gene arms in macrophages and that their selective or corelease defines the role-specific TLRs and adapter proteins.
Although S. aureus did not induce NOSII at 24 h, a time where LPS or E. coli had produced clear effects on this gene, it did induce at later time points. Specifically, increased levels of NOSII protein were detected at 48 h after stimulation with S. aureus and increased product (nitrite) was detected at 72 h, consistent with the predicted time lag needed for the product to accumulate. The ability of S. aureus, unlike that of E. coli, to induce NO release was mediated by TNFα. The likely course of events, therefore, is that TLR2 activation leads to TNFα release, which then acts in an autocrine manner to induce the expression of NOSII. It is interesting that although TLR4 activation results in both NO and TNFα, TNFα does not contribute to levels of NO made, illustrating the importance of the TRIF/TRAM pathway drive in direct induction of NOSII.
Others have found that TLR4 and TLR2 ligands can synergise for the release of TNFα (Sato et al., 2000; Beutler et al., 2001) or that priming of cells with INF-γ can induce macrophages to release NO in response to TLR2 ligands. The synergy we report here is between LPS (or whole E. coli bacteria) and whole Gram-positive bacteria or selective TLR2 ligands. We have previously shown that, in contrast to the results we show here with macrophages, blood vessels sense Gram-positive bacteria differently. In the case of vascular smooth muscle, Gram-positive bacteria (S. aureus) induces NOSII, COX-2 and hyporeactivity (Cartwright et al., 2005; Jimenez et al., 2005). In the case of blood vessels, the effect of S. aureus is mimicked by TLR2–TLR6 ligands (and not TLR2–TLR1 ligands; Cartwright et al., 2005). In the current study, we found that although the selective ligands of either TLR2–TLR6 or TLR2–TLR1 were unable to induce NO release directly from macrophages, they readily synergised with LPS to release NO from macrophages.
Others have found that LTA (derived from S. aureus) induced NOSII in macrophages (Kengatharan et al., 1996). It has been proposed that the biological activity of different preparations of LTA may contain contaminating LPS. Gao et al. (2001) found that commercial LTA triggered the release of NO from murine macrophages because it contained LPS contamination, as determined by positive limulus amoeocyte lysate activity. The hydrophilic LTA fraction was inactive. In this study, we have used butanol-extracted LTA (Morath et al., 2002), which preserves the high degree of D-alanine substitution in native LTA (Fischer & Rosel, 1980). This has been shown to be free from the LPS contamination associated with some of the commercially available early preparations of LTA.
The synergy observed appears to be dependent on both TLR2 and TLR4, as co-administration of Pam3CSK4 and LPS to primary peritoneal macrophages from TLR2 and TLR4 knockout mice resulted in the loss of synergistic release of both TNF and NO. The exact mechanisms remain unclear and remain the subject of investigation. However, we found that TLR2 gene expression was modified when cells were stimulated. TLR2 gene levels were found to be relatively low in macrophages, but greatly increased when cells were activated with LPS, Pam3CSK4, S. aureus or E. coli. In contrast, TLR4 levels were found to be relatively high and unaffected when cells were treated with LPS, Pam3CSK4, S. aureus or E. coli. These observations are in keeping with others in the literature (Matsuguchi et al., 2000; Moller et al., 2005) and provide a potential explanation of how TLR4 ligands may ‘prime' responses to TLR2 ligands. For a synergistic response to occur, the order in which cells are exposed to ligands may be important. In our study, agonists and bacteria were administered concurrently. Other studies have also shown synergy between other TLR2 agonists and LPS if they are administered concurrently (Sato et al., 2000). However, preexposure to one ligand, before subsequent exposure to another, may lead to crosstolerance rather than synergy. Macrophages pretreated with MALP-2 showed reduced production of TNFα in response to LPS (Sato et al., 2000). Pretreatment of macrophages with LPS inhibited TNF release in response to zymosan, a TLR2 agonist, whereas zymosan pretreatment augmented release of both TNF in response to LPS (West et al., 1995). Thus, it appears that the mechanisms by which different microbial products influence responses to one another is highly complex.
In our study, stimulation of cells with PepG and LPS resulted in synergistic release of NO but not TNF. This is in contrast to the TLR2 ligands and whole bacteria, which resulted in synergistic release of both mediators. The explanation for this may lie in PepG's use of unique recognition receptors (Travassos et al., 2004). Although TLRs are the most extensively studied pathogen-associated molecular pattern receptors, the family of intracellular NOD proteins has also been shown to recognise bacterial products within the cytosol. The NOD1 and NOD2 proteins are thought to be the sole sensors of PepG and it is thought that earlier reports suggesting TLR2 might sense PepG were probably owing to impure preparations. It is likely that the NOD receptor also facilitate the synergistic responses of PepG. In a study using primary human cells, NOD1 activation synergistically increased TLR-induced responses (Van Heel et al., 2005). Crosstalk between pattern recognition pathways may permit enhanced innate immune response against polymicrobial infection (Wang et al., 2001).
A number of clinical studies have reported a higher mortality associated with polymicrobial infection (Weinstein et al., 1983; Brun-Buisson et al., 1996). These results imply that, during sepsis, even low levels of microbial toxins that may elicit only small immune cell responses on their own may contribute significantly to inflammation, through synergy with other microbial components. Differential activation of pathways and subsequent modulation of inflammatory responses may contribute to the haemodynamic disturbance, shock and multiple organ failure and higher mortality in sepsis owing to polymicrobial infection. Our findings may be important to the understanding of the host response to mixed bacterial infection.
Acknowledgments
This work was funded by grants from the British Heart Foundation, the Medical Research Council and the NHLI. This study is dedicated to the memory of Dr Jasmine Anandarajah whose contribution to this study was substantial. She is particularly acknowledged for her own scientific contribution as well as her enthusiasm and willingness to help others in their work.
Abbreviations
- 1400W
N-(3-(aminomethyl)benzyl)acetamidine
- E. coli
Escherichia coli
- L-NAME
NG-nitro-L-arginine
- LPS
lipopolysaccharide
- LTA
lipoteichoic acid
- MyD88
myeloid differentiation factor 88
- NOS
nitric oxide synthase
- TLR
Toll-like receptors
- TRIF
TIR domain-containing adapter-inducing interferon
- S. aureus
Staphylococcus aureus
References
- ANANDARAJAH J., FLEET M.R., WALTERS M.J., BELCHER P.E., SRISKANDAN S., MITCHELL J.A. Gram positive and Gram negative bacteria synergise to cause nitric oxide synthase induction in murine macrophages. Br. J. Pharmcol. 2003;140:5P. [Google Scholar]
- BELCHER P.E., EVANS T.W., SRISKANDAN S., MITCHELL J.A. Gram-positive Staphylococcus aureus contrasts with Gram-negative Escherichia coli in the induction of tumour factor-alpha and nitric oxide from macrophages. Br. J. Anaesthesia. 2003;90:540P–541P. [Google Scholar]
- BEUTLER E., GELBART T., WEST C. Synergy between TLR2 and TLR4: a safety mechanism. Blood Cells Mol. Dis. 2001;27:728–730. doi: 10.1006/bcmd.2001.0441. [DOI] [PubMed] [Google Scholar]
- BISHOP-BAILEY D., LARKIN S.W., WARNER T.D., CHEN G., MITCHELL J.A. Characterization of the induction of nitric oxide synthase and cyclo-oxygenase in rat aorta in organ culture. Br. J. Pharmacol. 1997;21:125–133. doi: 10.1038/sj.bjp.0701100. [DOI] [PMC free article] [PubMed] [Google Scholar]
- BRUN-BUISSON C., DOYON F., CARLET J. Bacteremia and severe sepsis in adults: a multicenter prospective survey in ICUs and wards of 24 hospitals. French Bacteremia-Sepsis Study Group. Am. J. Respir. Crit. Care Med. 1996;154:617. doi: 10.1164/ajrccm.154.3.8810595. [DOI] [PubMed] [Google Scholar]
- CARTWRIGHT N., SRISKANDAN S., QUESNIAUX V., RYFFEL B., EVANS T.W., MITCHELL J.A. Role of TLR2 and TLR6 in vascular dysfunction induced by Gram positive bacteria. Br. J. Pharmacol. (pA2 online) 2005;3:152P. [Google Scholar]
- FISCHER W., ROSEL P. The alanine ester substitution of lipoteichoic acid (LTA) in Staphylococcus aureus. FEBS Lett. 1980;119:224–226. doi: 10.1016/0014-5793(80)80257-2. [DOI] [PubMed] [Google Scholar]
- GAO J.J., Q XUE E.G., ZUVANICH K.R., HAGH I., MORRISON D.C. Commercial preparations of lipoteichoic acid contain endotoxin that contributes to activation of mouse macrophages in vitro. Infect. Immun. 2001;69:751–757. doi: 10.1128/IAI.69.2.751-757.2001. [DOI] [PMC free article] [PubMed] [Google Scholar]
- JIMENEZ R., BELCHER E., SRISKANDAN S., LUCAS R., MCMASTER S., VOJNOVIC I., WARNER T.D., MITCHELL J.A. Role of Toll-like receptors 2 and 4 in the induction of cyclooxygenase-2 in vascular smooth muscle. Proc. Natl. Acad. Sci. U.S.A. 2005;102:4637–4642. doi: 10.1073/pnas.0407655101. [DOI] [PMC free article] [PubMed] [Google Scholar]
- JONES B.W., HELDWEIN K.A., MEANS T.K., SAUKKONEN J.J., FENTON M.J. Differential roles of Toll-like receptors in the elicitation of proinflammatory responses by macrophages. Ann. Rheum. Dis. 2001;60 (Suppl 3):iii6–iii12. doi: 10.1136/ard.60.90003.iii6. [DOI] [PMC free article] [PubMed] [Google Scholar]
- KENGATHARAN M., DE KIMPE S.J., THIEMERMANN C. Analysis of the signal transduction in the induction of nitric oxide synthase by lipoteichoic acid in macrophages. Br. J. Pharmacol. 1996;117:1163–1172. doi: 10.1111/j.1476-5381.1996.tb16711.x. [DOI] [PMC free article] [PubMed] [Google Scholar]
- MATSUGUCHI T., MUSIKACHAROEN T., OGAWA T., YOSHIKAI Y. Gene expressions of Toll-like receptor 2, but not Toll-like receptor 4, is induced by LPS and inflammatory cytokines in mouse macrophages. J. Immunol. 2000;165:5767–5772. doi: 10.4049/jimmunol.165.10.5767. [DOI] [PubMed] [Google Scholar]
- MOLLER A.S., OVSTEBO R., HAUG K.B., JOO G.B., WESTVIK A.B., KIERULF P. Chemokine production and pattern recognition receptor (PRR) expression in whole blood stimulated with pathogen-associated molecular patterns (PAMPs) Cytokine. 2005;32:304–315. doi: 10.1016/j.cyto.2005.11.008. [DOI] [PubMed] [Google Scholar]
- MORATH S., GEYER A., SPREITZER I., HERMANN C., HARTUNG T. Structural decomposition and heterogeneity of commercial lipoteichoic acid preparations. Infect. Immun. 2002;70:938–942. doi: 10.1128/iai.70.2.938-944.2002. [DOI] [PMC free article] [PubMed] [Google Scholar]
- MOYNAGH P.N. TLR signalling and activation of IRFs: revisiting old friends from the NF-kappaB pathway. Trends Immunol. 2005;26:469–476. doi: 10.1016/j.it.2005.06.009. [DOI] [PubMed] [Google Scholar]
- SATO S., NOMURA F., KAWAI T., TAKEUCHI O., MUHLRADT P.F., TAKEDA K., AKIRA S. Synergy and cross-tolerance between toll-like receptor (TLR) 2- and TLR4-mediated signaling pathways. J. Immunol. 2000;165:7096–7101. doi: 10.4049/jimmunol.165.12.7096. [DOI] [PubMed] [Google Scholar]
- TAKEUCHI O., HOSHINO T., KAWAI H., SANJO H., TAKADA T., OGAWA K., TAKEDA K., AKIRA S. Differential roles of TLR2 and TLR4 in recognition of Gram-negative and Gram-positive bacterial cell wall components. Immunity. 1999;11:443–451. doi: 10.1016/s1074-7613(00)80119-3. [DOI] [PubMed] [Google Scholar]
- TOSHCHAKOV V., JONES B.W., PERERA P.Y., THOMAS K., CODY M.J., ZHANG S., WILLIAMS B.R., MAJOR J., HAMILTON T.A., FENTON M.J., VOGEL S.N. TLR4, but not TLR2, mediates IFN-beta-induced STAT1alpha/beta-dependent gene expression in macrophages. Nat. Immunol. 2002;3:392–398. doi: 10.1038/ni774. [DOI] [PubMed] [Google Scholar]
- TRAVASSOS L.H., GIRARDIN S.E., PHILPOTT D.J., BLANOT D., NAHORI M.A., WERTS C., BONECA I.G. Toll-like receptor 2-dependent bacterial sensing does not occur via peptidoglycan recognition. EMBO Rep. 2004;5:1000–1006. doi: 10.1038/sj.embor.7400248. [DOI] [PMC free article] [PubMed] [Google Scholar]
- VAN HEEL D.A., GHOSH S., BUTLER M., HUNT K., FOXWELL B.M., MENGIN-LECREULX D., PLAYFORD R.J. Synergistic enhancement of Toll-like receptor responses by NOD1 activation. Eur. J. Immunol. 2005;35:2471–2476. doi: 10.1002/eji.200526296. [DOI] [PubMed] [Google Scholar]
- VOGEL S.N., FITZGERALD K.A., FENTON M.J. TLRs: differential adapter utilization by toll-like receptors mediates TLR-specific patterns of gene expression. Mol. Interv. 2003;3:466–477. doi: 10.1124/mi.3.8.466. [DOI] [PubMed] [Google Scholar]
- WANG J.E., JORGENSEN P.F, ELLINGSEN E.A., ALMIOF M., THIEMERMANN C., FOSTER S.J., AASEN A.O., SOLBERG R. Peptidoglycan primes for LPS-induced release of proinflammatory cytokines in whole human blood. Shock. 2001;16:178–182. doi: 10.1097/00024382-200116030-00002. [DOI] [PubMed] [Google Scholar]
- WEINSTEIN M.P., MURPHY J.R., RELLER L.B., LICHTENSTEIN K.A. The clinical significance of positive blood cultures: a comprehensive analysis of 500 episodes of bacteremia and fungemia in adults. II. Clinical observations, with special reference to factors influencing prognosis. Rev. Infect. Dis. 1983;5:54–70. doi: 10.1093/clinids/5.1.54. [DOI] [PubMed] [Google Scholar]
- WEST M.A., BENNET T., CLAIR L. Reprogrammed macrophage tumor necrosis factor and interleukin-1 release with inflammatory pretreatment: differential regulation by endotoxin and zymosan. J. Trauma. 1995;39:404–410. doi: 10.1097/00005373-199509000-00002. [DOI] [PubMed] [Google Scholar]


