Abstract
We present a novel angle-resolved low coherence interferometry scheme for rapid measurement of depth-resolved angular scattering distributions to enable determination of scatterer size via elastic scattering properties. Depth resolution is achieved using a superluminescent diode in a modified Mach-Zehnder interferometer with the mixed signal and reference fields dispersed by an imaging spectrograph. The spectrograph slit is located in a Fourier transform plane of the scattering sample, enabling angle-resolved measurements over a 0.21 radian range. The capabilities of the new technique are demonstrated by recording the distribution of light scattered by a sub-surface layer of polystyrene microspheres in 40 milliseconds. The data are used to determine the microsphere size with good accuracy. Future clinical application to measuring the size of cell nuclei in living epithelial tissues using backscattered light is discussed.
1. Introduction
Angle-resolved low coherence interferometry (a/LCI) has been developed as a means to obtain sub-surface structural information by examining the angular distribution of scattered light [1–3]. The a/LCI technique combines the ability of low coherence interferometry to detect singly scattered light from sub-surface sites with the capability of light scattering methods to obtain structural information with sub-wavelength precision and accuracy [2,4]. a/LCI has been successfully applied to measuring cellular morphology in tissues [3] and in vitro [4] as well as diagnosing intraepithelial neoplasia [5] and assessing the efficacy of chemopreventive agents [6] in an animal model of carcinogenesis. The latter study was significant because it used a/LCI to prospectively grade tissue samples without tissue processing, demonstrating the potential of the technique as a biomedical diagnostic.
The initial prototype a/LCI system [1, 2] and the faster, second generation system [3] both relied on time domain depth scans, implemented by mechanically adjusting the length of the reference arm of the interferometer and serial scanning of the detected scattering angle. However, it has recently been shown that improvements in signal-to-noise, and commensurate reductions in data acquisition time are possible by recording the depth scan in the Fourier (or spectral) domain [7–9]. Indeed, recent implementations of Fourier (spectral) domain optical coherence tomography (OCT) have obtained high quality images with high frame rates [10–12]. While these new OCT implementations achieve 2–3 μm resolution, which is insufficient for quantitative comparisons of cellular features, light scattering based techniques can obtain structural information with sub-wavelength precision and accuracy [2,4].
This paper presents a new a/LCI technique, Fourier domain a/LCI (faLCI), which combines the Fourier domain concept with the use of an imaging spectrograph to record the angular distribution in parallel. The use of an imaging spectrograph to examine the angular distribution of light scattered by biological tissues was introduced by Kim, et al. [13] and later applied to study neoplasia in an animal model of carcinogenesis [14]. However, these studies did not achieve depth resolution, as they only detected scattered intensity and focused on bulk tissue properties and absorptive spectral features. In faLCI, depth-resolution is achieved by Fourier transforming the spectrum of two mixed fields with the angle-resolved measurements obtained by locating the entrance slit of the imaging spectrograph in a Fourier transform plane to the sample. The capabilities of faLCI are demonstrated below by extracting the size of polystyrene beads in a depth-resolved measurement. The results are discussed in the context of future application of faLCI to probe nuclear morphology of sub-surface cells.
2. Experimental scheme
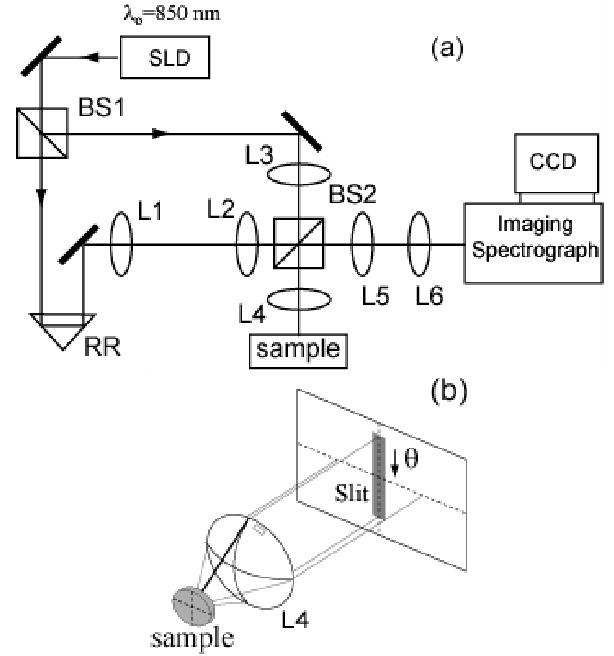
The faLCI scheme is based on a modified Mach-Zehnder interferometer (Fig. 1(a)). Broadband light from a superluminescent diode (Output Power = 3 mW, λo=850 nm, Δλ=20 nm FWHM ) is split into a reference beam and an input beam to the sample by beamsplitter BS1. The path length of the reference beam is set by adjusting retroreflector RR, but remains fixed during measurement. The reference beam is expanded using lenses L1 and L2 (f1 = 1.5 cm, f2 = 15 cm) to create illumination which is uniform and collimated upon reaching the spectrograph slit. Lenses L3 and L4 are arranged to produce a collimated pencil beam incident on the sample. By displacing lens L4 vertically relative to lens L3, the input beam is made to strike the sample at an angle of 0.10 radians relative to the optical axis. This arrangement allows the full angular aperture of L4 to be used to collect scattered light. The light scattered by the sample is collected by lens L4 (f4 = 3.5 cm) and relayed by a 4f imaging system (lenses L5 and L6) such that the Fourier plane of lens L4 is reproduced in phase and amplitude at the spectrograph slit. The scattered light is mixed with the reference field at BS2 with the combined fields falling upon the entrance slit to an imaging spectrograph (SP2150i, Acton Research). Fig. 1(b) shows the distribution of scattering angle across the dimension of the slit. The mixed fields are dispersed with a high resolution grating (1200 l/mm) and detected using a cooled CCD (1340 X 400, 20 μm X 20 μm pixels, Spec10:400, Princeton Instruments).
Fig. 1.

(a) Schematic of faLCI system. (b) Illustration relating detected scattering angle to slit of spectrograph.
3. Theory of detected signal
The detected signal is a function of vertical position on the spectrograph slit, y, and wavelength λ, once the light is dispersed by the spectrograph. The detected signal at pixel (m, n) can be related to the signal and reference fields (Es, Er) as:
| (1) |
where φ is the phase difference between the two fields and 〈...〉 denotes an ensemble average in time. The interference term is extracted by measuring the intensity of the signal and reference beams independently and subtracting them from the total intensity.
In order to obtain depth resolved information, the wavelength spectrum at each scattering angle is interpolated into a wavenumber (k = 2 π / λ) spectrum and Fourier transformed to give a spatial cross correlation, ΓSR (z) for each vertical pixel yn:
| (2) |
The reference field takes the form:
| (3) |
where ko (yo) and Δk (Δy) represent the center and width of the Gaussian wavevector (spatial) distribution and Δl is the selected path length difference. The scattered field takes the form
| (4) |
where Sj represents the amplitude distribution of the scattering originating from the jth interface, located at depth lj. The angular distribution of the scattered field is converted into a position distribution in the Fourier image plane of lens L4 through the relationship y = f4 θ For the pixel size of the CCD (20 μm), this yields an angular resolution of 0.57 mrad and an expected angular range of 228 mrad.
Inserting Eqs. (3) and (4) into Eq. (2) and noting the uniformity of the reference field (Δy >> slit height) yields the spatial cross correlation at the nth vertical position on the detector:
| (5) |
Evaluating this equation for a single interface yields:
| (6) |
Here we have assumed that the scattering amplitude S does not vary appreciably over the bandwidth of the source. This expression shows that we obtain a depth resolved profile of the scattering distribution with each vertical pixel corresponding to a scattering angle.
4. Results
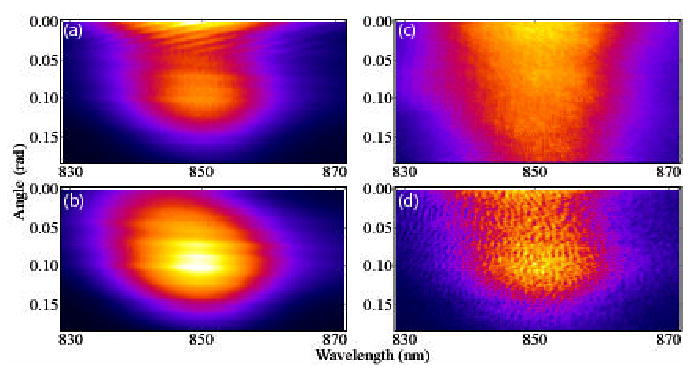
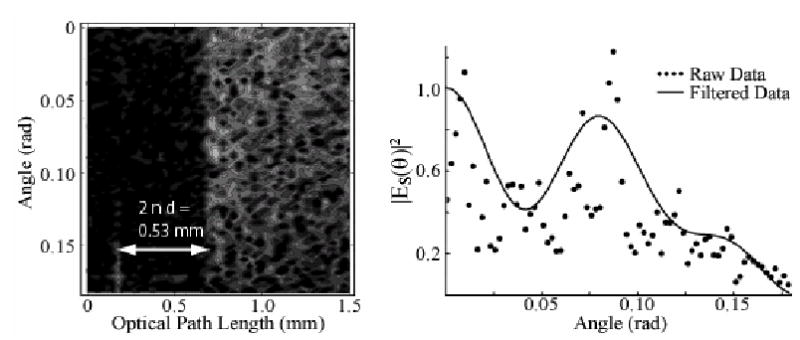
Figure 2(a) shows typical data representing the total detected intensity (Eq. (1)) of the sum of the reference field and the field scattered by a sample of polystyrene beads, given as a function of wavelength and angle, given with respect to the backwards scattering direction. This data was acquired in 40 milliseconds and records data over 186 mrad, approximately 85% of the expected range, with some loss of signal at higher angles. Figures 2(b) and 2(c) show the intensity of the reference and signal fields respectively. Upon subtraction of the signal and reference fields from the total detected intensity, the interference between the two fields is realized in Fig. 2(d). At each angle, interference data are interpolated into k-space and Fourier transformed to give the angular depth resolved profiles, presented as a contour plot in Fig. 3.
Fig. 2.

Typical faLCI data for sample of polystyrene beads. (a) Total signal, acquired in 40 msec, (b) reference field intensity, (c) signal field intensity and (d) extracted interference signal.
Fig. 3.

Axial spatial cross-correlation function for coverslip sample as a function of depth and angle. Note width of coverslip is correctly determined. Right plot shows angular distribution taken by ensemble averaging over 0.2 mm (~ 1 MFP) closest to surface (points). Low pass filter allows a noise reduction (line).
In the experiments, the sample consists of polystyrene mic rospheres (n=1.59, 10.1 μm mean diameter, 8.9% variance, NIST certified, Duke Scientific) suspended in a mixture of 80% water and 20% glycerol (n=1.36) to provide neutral buoyancy. The solution was prepared to obtain a scattering length l = 200 μm. The sample is contained in a round well (8mm diameter, 1mm deep) behind a glass coverslip (thickness, d ~ 170 μm). The sample beam is incident on the sample through the coverslip. The round trip thickness through the coverslip (2 n d = 2 (1.5) (170 μm) = 0.53 mm) shows the depth resolved capability of the approach. The data are ensemble averaged by integrating over one mean free path (MFP). As shown previously [2], a spatial average can enable a reduction of speckle when using low-coherence light to probe a scattering sample. To simplify the fitting procedure, the scattering distribution is low pass filtered to produce a smoother curve, with the cutoff frequency chosen to suppress spatial correlations on length scales above 16μm.
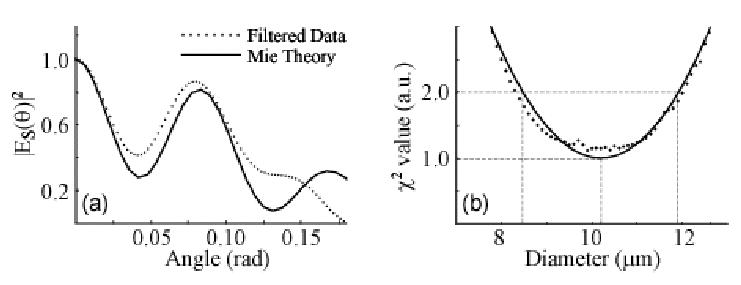
Comparison of the scattering distribution to the prediction of Mie theory enables a size determination to be made. The best fit (Fig. 4(a)) is determined by minimizing the Chi-squared between the data and theory (Fig. 4(b)), yielding a size of 10.2 +/− 1.7 μm, in excellent agreement with the true size. The measurement error is larger than the variance of the bead size, most likely due to the limited range of angles recorded in the measurement
Fig. 4.

Size determination made using faLCI data. (a) Filtered data is compared to best fit Mie theory as determined by (b) Chi-squared minimization. Determine size: 10.2 +/− 1.7 μm compared with 10.1 μm actual size.
5. Discussion
The anticipated application of faLCI is to determining the size of nuclei in the basal layer of epithelial tissues , approximately 100μm below the surface, to detect early stage cancer. Thus, the depth probed in the above data is sufficient for this application. The great advancement of the faLCI system is the 104 reduction (300 sec to 40 msec) in data acquisition time when compared to previous a/LCI implementations [3,4]. We note that faLCI is a new data acquisition technique for a/LCI. As such the introduction of faLCI does not impact the efficacy of the analysis method used to determine structure from a/LCI measurements, a proven process for determining structure based on elastic scattering properties [2–6], including accounting for a distribution in the size of scatterers [2–4] and determining the size of sub-surface epithelial cell nuclei [3–5]. We emphasize that it is the decreased data acquisition time of faLCI which opens the possibility of clinical application.
However, in order to accomplish this, several further improvements in the setup will be needed. In biological media, the relative refractive indices are lower for organelles (1.03–1.06) compared to microspheres (1.21) and thus smaller scattering signals are expected. The use of a higher power light source will permit smaller signals to be detected. In addition, expanding the angular range should improve the accuracy of the size determination. Finally, a fiber optic based implementation must be developed to enable endoscopic application.
In conclusion, we have demonstrated that faLCI can recover structural information with good accuracy from sub-surface layers based on measuring elastic scattering properties through the angular distribution of backscattered light. The faLCI technique achieves fast measurements by obtaining the depth-resolved and angle-resolved scattering amplitudes in parallel instead of serially as was done previously. The improved acquisition rate of the new optical system makes a/LCI measurements a potentially feasible clinical method for detecting nuclear morphological changes associated with early stage cancer.
Acknowledgments
We thank Adam Curry and Ashutosh Chilkoti for allowing time on the spectrograph system. J. Pyhtila is supported by an NIH training grant (NIBIB T32 EB001040) and this work was supported by grants from the NIH (NCI R21-CA109907) and NSF (BES 03-48204)
References
- 1.Wax A, Yang CH, Dasari RR, Feld MS. “Measurement of angular distributions by use of low-coherence interferometry for light-scattering spectroscopy,”. Opt Lett. 2001;26:322–324. doi: 10.1364/ol.26.000322. [DOI] [PubMed] [Google Scholar]
- 2.Wax A, Yang C, Backman V, Kalashnikov M, Dasari RR, Feld MS. “Determination of particle size using the angular distribution of backscattered light as measured with low-coherence interferometry,”. J Opt Soc Am A. 2002;19:737–744. doi: 10.1364/josaa.19.000737. [DOI] [PubMed] [Google Scholar]
- 3.Pyhtila JW, Graf RN, Wax A. “Determining nuclear morphology using an improved angle-resolved low coherence interferometry system,”. Opt Express. 2003;11:3473–3484. doi: 10.1364/oe.11.003473. http://www.opticsexpress.org/abstract.cfm?URI=OPEX-11-25-3473. [DOI] [PubMed] [Google Scholar]
- 4.Wax A, Yang C, Backman V, Badizadegan K, Boone CW, Dasari RR, Feld MS. “Cell organization and sub-structure measured using angle-resolved low coherence interferometry.,”. Biophys J. 2002;82:2256–2264. doi: 10.1016/S0006-3495(02)75571-9. [DOI] [PMC free article] [PubMed] [Google Scholar]
- 5.Wax A, Yang CH, Muller MG, Nines R, Boone CW, Steele VE, Stoner GD, Dasari RR, Feld MS. “In situ detection of neoplastic transformation and chemopreventive effects in rat esophagus epithelium using angle-resolved low-coherence interferometry,”. Cancer Res. 2003;63:3556–3559. [PubMed] [Google Scholar]
- 6.Wax A, Pyhtila JW, Graf RN, Nines R, Boone CW, Dasari RR, Feld MS, Steele VE, Stoner GD. “In situ monitoring of neoplastic transformation and assessing efficacy of chemopreventive agents in rat esophagus epithelium using angle-resolved low-coherence interferometry,”. Proceedings of the AACR. 2004;45 [Google Scholar]
- 7.Choma MA, Sarunic MV, Yang CH, Izatt JA. “Sensitivity advantage of swept source and Fourier domain optical coherence tomography,”. Opt Express. 2003;11:2183–2189. doi: 10.1364/oe.11.002183. http://www.opticsexpress.org/abstract.cfm?URI=OPEX-11-18-2183. [DOI] [PubMed] [Google Scholar]
- 8.de Boer JF, Cense B, Park BH, Pierce MC, Tearney GJ, Bouma BE. “Improved signal-to-noise ratio in spectral-domain compared with time-domain optical coherence tomography,”. Opt Lett. 2003;28:2067–2069. doi: 10.1364/ol.28.002067. [DOI] [PubMed] [Google Scholar]
- 9.Leitgeb R, Hitzenberger CK, Fercher AF. “Performance of fourier domain vs. time domain optical coherence tomography,”. Opt Express. 2003;11:889–894. doi: 10.1364/oe.11.000889. http://www.opticsexpress.org/abstract.cfm?URI=OPEX-11-8-889. [DOI] [PubMed] [Google Scholar]
- 10.Leitgeb RA, Drexler W, Unterhuber A, Hermann B, Bajraszewski T, Le T, Stingl A, Fercher AF. “Ultrahigh resolution Fourier domain optical coherence tomography,”. Opt Express. 2004;12:2156–2165. doi: 10.1364/opex.12.002156. http://www.opticsexpress.org/abstract.cfm?URI=OPEX-12-10-2156. [DOI] [PubMed] [Google Scholar]
- 11.Nassif NA, Cense B, Park BH, Pierce MC, Yun SH, Bouma BE, Tearney GJ, Chen TC, de Boer JF. “In vivo high-resolution video-rate spectral-domain optical coherence tomography of the human retina and optic nerve,”. Opt Express. 2004;12:367–376. doi: 10.1364/opex.12.000367. http://www.opticsexpress.org/abstract.cfm?URI=OPEX-12-3-367. [DOI] [PubMed] [Google Scholar]
- 12.Wojtkowski M, Srinivasan VJ, Ko TH, Fujimoto JG, Kowalczyk A, Duker JS. “Ultrahigh-resolution, high-speed, Fourier domain optical coherence tomography and methods for dispersion compensation,”. Opt Express. 2004;12:2404–2422. doi: 10.1364/opex.12.002404. http://www.opticsexpress.org/abstract.cfm?URI=OPEX-12-11-2404. [DOI] [PubMed] [Google Scholar]
- 13.Kim YL, Liu Y, Wali RK, Roy HK, Goldberg MJ, Kromin AK, Chen K, Backman V. “Simultaneous measurement of angular and spectral properties of light scattering for characterization of tissue microarchitecture and its alteration in early precancer,”. IEEE J Sel Top Quant Elec. 2003;9:243–256. [Google Scholar]
- 14.Roy HK, Liu Y, Wali RK, Kim YL, Kromine AK, Goldberg MJ, Backman V. “Four-dimensional elastic light-scattering fingerprints as preneoplastic markers in the rat model of colon carcinogenesis,”. Gastroenterology. 2004;126(4):p. 1071–1081. doi: 10.1053/j.gastro.2004.01.009. [DOI] [PubMed] [Google Scholar]


