Abstract
We present an experimental study of Ogston-like sieving process of rod-like DNA in patterned periodic nanofluidic filter arrays. The electrophoretic motion of DNA through the array is described as a biased Brownian motion overcoming periodically modulated free energy landscape. A kinetic model, constructed based on the equilibrium partitioning theory and the Kramers’ theory, explains the field-dependent mobility well. We further show experimental evidence of the crossover from Ogston-like sieving to entropic trapping, depending on the ratio between nanofilter constriction size and DNA size.
Perhaps the most important application of electromigration of polyelectrolytes in confining environments is the size fractionation of biomolecules with gel electrophoresis. Based on the ratio of the radius of gyration Rg of the molecule to the characteristic pore size a of the gel, three different separation regimes have been identified as Ogston sieving (Rg/a<1), entropic trapping (Rg/a~1), and biased reptation (Rg/a>1) [1]. In Ogston sieving, molecular sieving occurs because of steric hindrance of the molecules within the nanopore. Since Rg/a<1, the molecules move freely through the gel matrix, assuming their unperturbed coiled conformation. The standard model for interpreting mobility μ in the Ogston sieving regime is the so-called “extended Ogston model” [2], where the relative mobility μ*, the ratio between the mobility μ in gel and the free solution mobility μ0, of a molecule of given size is assumed to equal the partition coefficient K of the molecule in the gel (K revolves around excluded volume in general configuration space). Even though the assumption of μ*=μ/μ0=K has never been properly tested experimentally, largely because the mobility μ and the partition coefficient K of the molecule cannot be measured independently for a gel system, the extended Ogston model has been applied as the theoretical basis for the widely accepted empirical method proposed by Ferguson for determining the molecular weights of biomolecules [3]. As a near-equilibrium theory, the extended Ogston model is also known for failing to explain field-dependent mobility shifts that occur in a medium-to-high field gel electrophoresis [1, 3].
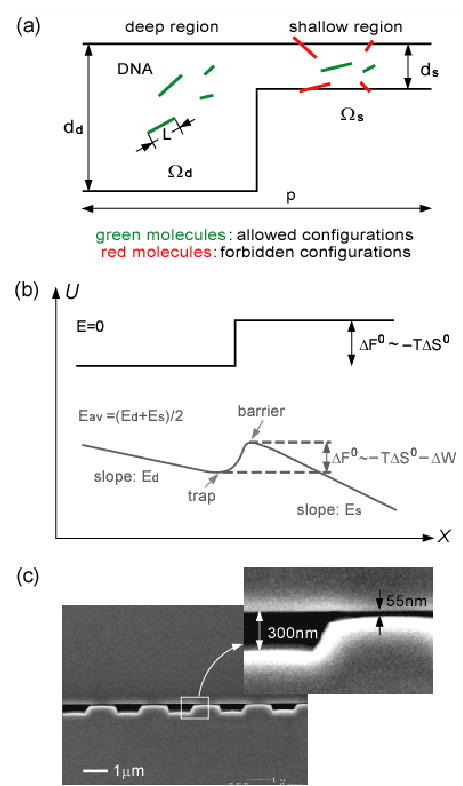
The theoretical study of sieving mechanisms in gel electrophoresis has been limited by the lack of well-controlled experimental platforms for correlating the size and shape of the sieving pores to the observed molecular dynamic behavior. Recently, various microfabricated structures have been proposed as an alternative to the gels [4]. These regular sieving structures have also proven ideal for theoretical study of molecular dynamics and stochastic motion in confining spaces [5]. More recently, patterned periodic nanofluidic filter (nanofilter) arrays were shown to provide fast separation of biomolecules such as proteins [6]. In this Letter, by using a theoretical model based on the equilibrium partitioning theory, we quantitatively characterized the sieving process of rigid, rod-like DNA (New England Biolabs, 50- to 1600-base pairs (bp)) in different microfabricated periodic nanofilter arrays. The nanofilter, which serves as the model pore-constriction system, consists of a deep region and a confining shallow region [Fig. 1]. The depth of the shallow region (ds) is of the same order of magnitude as the size of probing DNA molecules. Details of the nanofilter array structure and fabrication are described in Ref. [6]. The nanofilter array was filled with Tris-Borate-EDTA 5× buffer to diminish the effect of electroosmotic flow [7]. For fluorescence detection, DNA were labeled with YOYO-1 dye (Molecular Probes) with a dye-to-bp ratio of 1:20; at this ratio, dye intercalation extends DNA length by about 6% [8].
FIG. 1.

(a) Partitioning of rigid, rod-like DNA across a nanofilter that consists of a deep region (dd) and a shallow region (ds) of equal length. The period and width of one nanofilter is p and w, respectively. (b) Free energy landscapes experienced by DNA while crossing a nanofilter (black curve: E=0, grey curve: Eav>0). Es, Ed: electric fields in shallow and deep regions, respectively. Eav: average electric field over the nanofilter. DNA preserve the free draining property in the shallow and deep region, resulting in the slopes for both regions proportional solely to the local electric field. (c) SEM images of alternating deep (300 nm) and shallow (55 nm) regions. p=2 μm.
The electrophoretic drift of DNA through the nanofilter is essentially an electric-field-driven partitioning process [1]. Compared with the high-entropy deep region, the limited DNA configurational space inside the shallow region creates a configurational entropic barrier for DNA passage at the abrupt interface between the deep and shallow regions [9]. This configurational entropic barrier originates from the steric constraints that prevent a partial overlap of DNA with the wall, and is different from the conformational entropic barrier associated with deformation and entropic elasticity [10]. The configurational entropic barrier is −TΔS0~−kBTln(Ωs/Ωd) (T: absolute temperature, S0: configurational entropy, kB: Boltzmann’s constant, Ωs/Ωd: ratio of accessible microscopic configuration state integrals within shallow and deep regions) [9]. By definition, Ωs/Ωd is equal to K (K=Ks/Kd), the ratio of the partition coefficients in the shallow and deep regions. The partitioning of rigid molecules in various nanopore geometries has been studied both analytically and numerically with geometrical and statistical arguments [9]. In the dilute solution limit, the partition coefficients Ki (i=s, d) of thin rod-like DNA of length L in both shallow and deep regions are calculated as
| (1) |
where βi=L / di (scaled molecular length) and pi =w / di (scaled nanofilter width). For the DNA lengths tested (with contour length l and persistence length lp), L can be safely treated as equal to the DNA’s mean end-to-end distance <R2>½ calculated from the Kratky-Porod model [11]
| (2) |
The motion of DNA through the nanofilter array can be described as a biased thermally activated process overcoming periodically modulated free energy barriers ΔF0 [Fig. 1(b)]. The free energy landscape U tilted by the electric field Eav contains local maxima (barriers) and minima (traps), similar to a double well potential [12]. We define τtravel as the DNA drift time between two consecutive trapping events, so τtravel=L/μmaxEav, where μmax =4dsdsμ0/(ds+ ds)2 is the maximum sieving free mobility inside the nanofilter. μmax is obtained by linearly extrapolating the mobility data μ to zero DNA length under various Eav. μmax shows little variance and is practically independent of Eav. After DNA reaches a trap, it is trapped for a certain lifetime τtrap before it enters the nanofilter constriction. The relative mobility μ* therefore can be written as μ*=μ/μmax=τtravel/(τtravel+τtrap).
Two energy terms are included in the barrier ΔF0 expression (ΔF0 =−TΔS0−ΔW) [Fig. 1(b)]. The positive −TΔS0 term accounts for the entropic energy increase for DNA entering a confining nanofilter constriction. The ΔW term accounts for the electrical potential energy drop in the translation of DNA over the nanofilter barrier along the field direction. Approximately, ΔW=NqEavdd (N: DNA bp number, q: effective charge per bp derived from μ0) [13]. Eav effectively lowers the energy barrier in the field direction. When Eav→0, |TΔS0/ΔW|»1, the entropic energy dominates. This regime provides the greatest size selectivity, but the separation speed and thus efficiency are severely reduced. When |TΔS0/ΔW|«1, the trapping effect becomes negligible and no separation should be expected [6]. The optimized separation performance is expected when |TΔS0/ΔW|~1. Since ΔF0 in this regime is comparable to or larger than kBT, kesc, the escape transition rate for DNA to surmount the barrier, as well as the mean trapping time τtrap, can be obtained from a simplified version of the Kramers’ theory for the overdamped regime [14]
| (3) |
where γ is the DNA friction constant and γ ~N. Based on the energy landscape U depicted in Fig. 1(b), τtrap can be calculated as
| (4) |
where α is a constant with a unit of sec·V/(bp·m2) and ɛ is the reduced electric field (ɛ =ΔW/kBT) [1]. The trapping time in Ref. [14] showed a similar dependence on
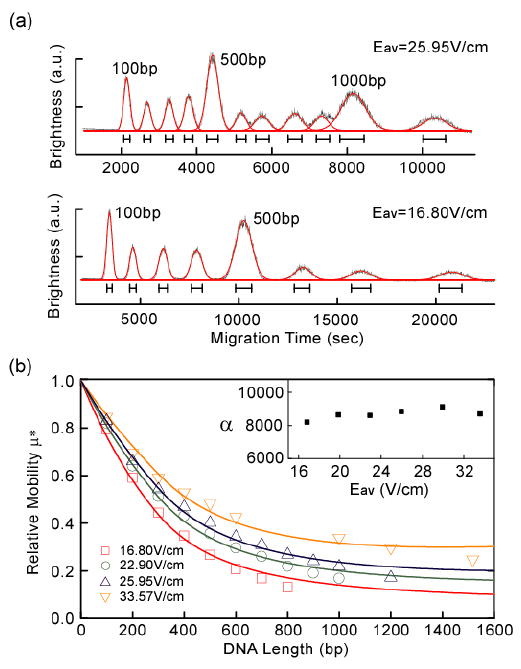
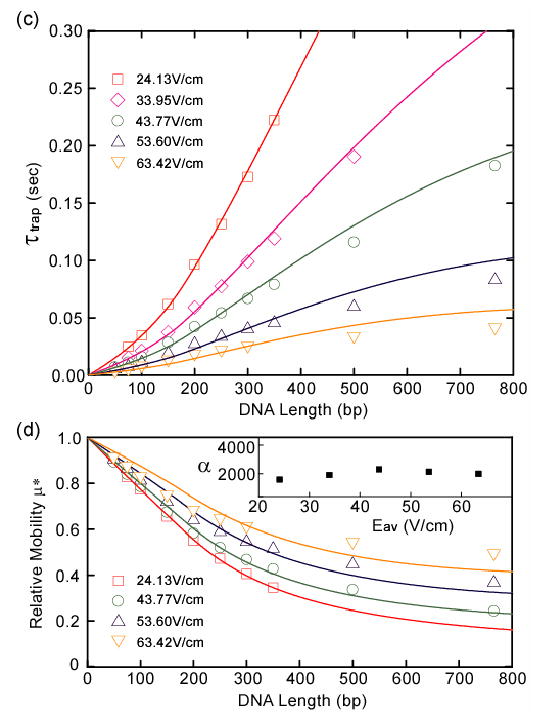
Mobility μ was determined by measuring an ensemble-averaged band migration time Ttravel over thousands of nanofilters under various Eav. Figure 2(a) shows separation of 100-bp DNA ladder in an 80 nm nanofilter array. The experimental data of μ* and τtrap for 100-bp DNA ladder [Fig. 2(b)] and low molecular weight DNA ladder [Fig. 2(c–d)] agree well with the theoretical curves calculated from Eq. (4), especially in the regime of low field (Eav<30V/cm) and short DNA [15]. The best fitting constant α was found fairly constant for all the Eav. The near-equilibrium state of DNA crossing a nanofilter can be estimated with the reduced electric field ɛ [1]. When Eav<30V/cm, ɛ is less than 0.1 for DNA of one persistence length. The small ɛ values associated with low fields validate our near-equilibrium kinetic model, and further suggest the trivial role of the exponential term exp(−ɛ ) in Eq. (4) for fitting the experimental data in the low field regime. The factor is explicitly derived from both the equilibrium partitioning (K) and the double well potential , and clearly serves as the determinant for the fitting. The exp(−ɛ ) term only plays a role as Eav increases and thus ΔW becomes more comparable to the entropic barrier. From our kinetic model, the intrinsic size selectivity of the nanofilter array dμ*/dN(N→0) is calculated as dμ*/dN(N→0)~−(LEav)−1. Therefore reduced L decreases τtravel and reduced Eav maximizes the entropic barriers, all accentuating the size-differentiating barrier surmounting process and leading to greater size selectivity [6]. Our kinetic model also implicitly defines a critical field ɛc above which the electric force overcomes the entropic force (ΔW>−TΔS0). By combining Eq. (1) and the expression of ΔW, we calculated ɛc in the short DNA limit to be independent of N and , where ds accounts for the nanofilter sieving property.
FIG. 2.


(a) 100-bp DNA ladder separated in a nanofilter array (ds=80 nm, dd=580 nm, and p=4 μm). Electropherograms (grey) were taken 1 cm from the injection point. Gaussian functions (red) were used for fitting and the black bars label the peak widths (±s.d.). (b) Relative mobility μ* of 100-bp DNA ladder with solid fitting curves. The ±s.d. of μ* derived from the half peak width are all less than 4%, so statistical error bars for μ* are not plotted. The inset shows the best fitting constant α for different field strengths. α has a mean about 8684 and a ±s.d. about 3%. (c–d) Mean trapping time τtrap (c) and relative mobility μ* (d) with the best fitting curves. τtrap and μ* were measured for low molecular weight DNA ladder in a nanofilter array with ds=55 nm, dd=300 nm, and p=1 μm. Separation length was 5 mm and τtrap=Ttravel/5000−τtravel. The ± s.d. of μ* are all less than 6%, so statistical error bars for μ* are not plotted. The inset shows α with a mean about 1990 and a ±s.d. about 13%. All the fitting curves in (b–d) are calculated with q=2.49 × 10⁻²¹ J/V·bp, lp=53 nm, and l=0.36·N nm.
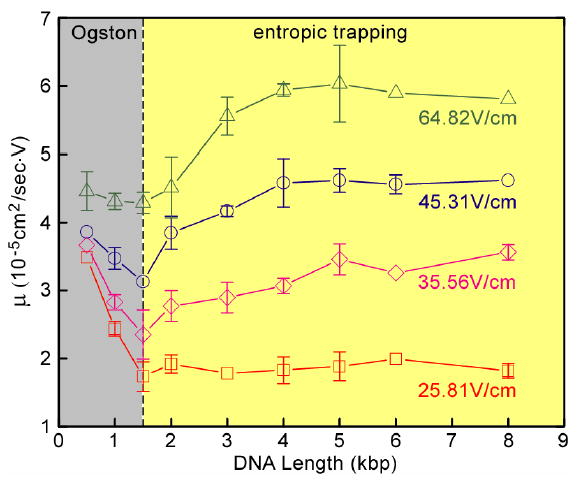
The experimental data in Fig. 2 deviated slightly from the theoretical curves as the DNA length increases to several persistence lengths. This is expected since for long DNA, other degrees of entropic freedom, such as internal conformation, become non-negligible in the kinetics of crossing the nanofilter barriers. The (conformational) entropic trapping mechanism was used to explain separation of long DNA (>5 kilobase pairs (kbp)) in similar intervening entropic barriers where longer DNA were found to advance faster than shorter ones because of their greater hernia nucleation possibility [16]. We demonstrate the crossover from Ogston sieving to entropic trapping by measuring mobility of DNA of a size ranging from 0.5–8 kbp in a 73 nm nanofilter array. The radius of gyration Rg of these DNA, estimated from the Kratky–Porod model, span a range of 40–220 nm, covering the region around Rg/ds~1. Figure 3 clearly shows two distinct sieving regimes as evidenced by the valleys existing on the mobility curves. The left side of the valley is Ogston sieving, and μ decreases as DNA length increases. The right side shows evidence of entropic trapping, and μ increases with DNA length. The transition points under different Eav are all at about DNA of 1.5 kbp, where Rg(1.5 kbp)~80 nm, comparable to ds=73 nm. This observation supports that the transition regime between Ogston sieving and entropic trapping is around Rg/ds~1. Eav shows different effects on the trapping in the two regimes: in Ogston sieving, the higher barrier height associated with lower Eav leads to greater size selectivity (as seen with the steeper curves); as in entropic trapping, nanofilter shows little size selectivity at low Eav, but mobility curves become steeper as Eav increases. All the mobility curves reach a plateau as DNA length becomes larger than about 5 kbp. The complex field effect pattern near the transition regime cannot be explained by the simple kinetic model proposed in Ref. [16], and further more detailed characterization needs to be conducted.
Fig. 3.

Mobility μ as a function of DNA length. DNA fragments were extracted after agarose gel separation. The nanofilter array has ds=73 nm, dd=325 nm, p=1 μm. The relative large statistical error bars (drawn if larger than the symbol) is likely due to the low DNA concentrations. The grey and yellow areas indicate Ogston sieving and entropic trapping, respectively. The transition points are marked with the vertical dashed line drawn for DNA length=1.5-kbp.
We acknowledge support from NSF (CTS-0347348), NIH (EB005743), and Singapore-MIT Alliance (SMA-II, CE program). J. Yoo was supported by the Caltech Summer Undergraduate Research Program. We thank P. Mao for helping take the SEM images.
References
- 1.Viovy JL. Slater GW, et al. Rev Mod Phys. Electrophoresis. 2000;2002;7223:813. 3791. [Google Scholar]
- 2.Ogston AG. Rodbard D, Chrambach A. Trans Faraday Soc. Proc Natl Acad Sci U S A. 1958;1970;5465:1754. 970. [Google Scholar]
- 3.Ferguson KA. Metab Clin Exp. 1964;13:985. [Google Scholar]; Tietz D. Advances in Electrophoresis. Vol. 2. VCH Publishers; New York: 1988. pp. 109–169. [Google Scholar]
- 4.Volkmuth WD, Austin RH. Han J, Craighead HG. Huang LR, et al. Huang LR, Cox EC, Austin RH, Sturm JC. Nature. Science. Nat Biotechnol. Science. 1992;2000;2002;2004;35828820304:600. 1026, 1048, 987. [Google Scholar]
- 5.Bakajin OB, et al. Tegenfeldt JO, et al. Phys Rev Lett. Proc Natl Acad Sci U S A. 1998;2004;80101:2737. 10979. [Google Scholar]
- 6.Fu J, Mao P, Han J. Appl Phys Lett. 2005;87:263902. doi: 10.1063/1.2149979. [DOI] [PMC free article] [PubMed] [Google Scholar]
- 7.Han J, Craighead HG. Anal Chem. 2002;74:394. doi: 10.1021/ac0107002. [DOI] [PubMed] [Google Scholar]
- 8.Smith DE, Perkins TT, Chu S. Macromolecules. 1996;29:1372. [Google Scholar]
- 9.Giddings JC, Kucera E, Russell CP, Myers MN. J Phys Chem. 1968;72:4397. [Google Scholar]
- 10.Turner SWP, Cabodi M, Craighead HG. Nykypanchuk D, Strey HH, Hoagland DA. Phys Rev Lett. Science. 2002;2002;88297:128103. 987. doi: 10.1103/PhysRevLett.88.128103. [DOI] [PubMed] [Google Scholar]
- 11.Rubenstein M, Colby RH. Polymer Physics. Oxford; New York: 2003. [Google Scholar]
- 12.Risken H. The Fokker-Planck Equation. Springer-Verlag; Berlin: 1996. [Google Scholar]
- 13.The characteristic diffusion length l* estimated from the Peclet number is always greater than dd Therefore, the nanofilter transition region radius is approximately equal to dd, which leads to ΔW=NqEavdd
- 14.Stockmayer WH. In: Molecular Fluids. Balian R, Weill G, editors. Gordon & Breach; London: 1976. [Google Scholar]; Ajdari A, Prost J. Proc Natl Acad Sci U S A. 1991;88:4468. doi: 10.1073/pnas.88.10.4468. [DOI] [PMC free article] [PubMed] [Google Scholar]
- 15.Stellwagen NC, Gelfi C, Righetti PG. Biopolymers. 1997;42:687. doi: 10.1002/(SICI)1097-0282(199711)42:6<687::AID-BIP7>3.0.CO;2-Q. μ0 of dsDNA decreases by about 2% over the 400- to 100-bp range ( However, this small μ0 decrease should not affect our arguments. [DOI] [PubMed] [Google Scholar]
- 16.Han J, Turner SW, Craighead HG. Phys Rev Lett. 1999;83:1688. [Google Scholar]


