Abstract
OBJECTIVE—To determine the precision and agreement of synovial fluid (SF) cell counts done manually and with automated counters, and to determine the degree of variability of the counts in SF samples, kept in the tubes used for routine white blood cell (WBC) counts—which use liquid EDTA as anticoagulant—at 24 and 48 hours at 4°C, and at room temperature. METHODS—To determine precision, cell counts were repeated 10 times—both manually and by an automated counter—in a SF sample of low, medium, and high cellularity. The variances were calculated to determine the interobserver variation in two manual (M1,M2) and two automated cell counts (C1,C2). The agreement between a manual (M1) and automated counter (C1) results, was analysed by the Bland and Altman method and the difference against the mean of the two methods was plotted. Then, the mean difference between the two methods was estimated and the standard deviation of the difference. To determine the effects of storage, SF samples were kept in a refrigerator at 4°C, and at room temperature; cell counts were done manually (M1) and automatically (C1) at 24 and 48 hours and the changes analysed by the Bland and Altman method. The variances were compared using an F test. RESULTS—(1) Precision. With the manual technique, the coefficients of variation were 27.9%, 14%, and 10.7% when used for counting the SF with low (270), medium (6200), and high cellularities (25 000). With the automated technique the coefficients of variation were 20%, 3.4%, and 2.9% in the same SF samples. In the fluids of medium and high cellularity, the variances of the automated cell counts were significatively lower (F test, p<0.002) than those of the manual counts. (2) Interobserver variation. The variance between C1 and C2 (25 SF) was significatively lower (F test, p<0.002) than that of the manual counts (41 SF). (3) Agreement between the two techniques (100 SF). For cellularities above 2000 cells/mm3, the manual method gave results between +10% to −34% of the results obtained by the coulter. For cellularities below 2000 cells/mm3, manual cell counts were between +60 to −1280 cells/mm3 of those obtained by the automated counter. (4) Influence of storage. The coulter counts of SF samples preserved at 4°C showed less variance (F test, p<0.05) than the manual counts. The worst results were obtained in manual counts of SF samples kept at room temperature; these samples at 48 hours showed a variation between −47% to 42% of the initial results. CONCLUSIONS—Automated cell count of the SF offers advantages: it gives higher precision and consumes less time. The stability of the samples preserved in the EDTA tubes used for routine WBC counts is of additional interest, because if delay cannot be avoided, the results of the WBC counts are still accurate at 24 and even at 48 hours, at least for clinical purposes.
Full Text
The Full Text of this article is available as a PDF (132.6 KB).
Figure 1 .
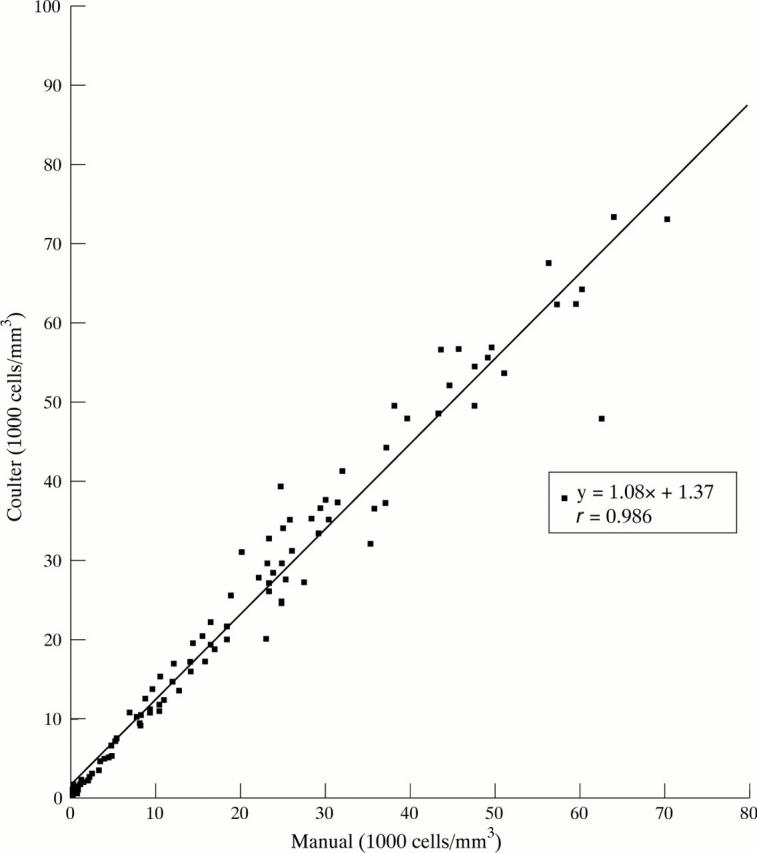
Comparison between an automated and a manual cell count in 100 samples of synovial fluids, showing an excellent correlation (r = 0.986).
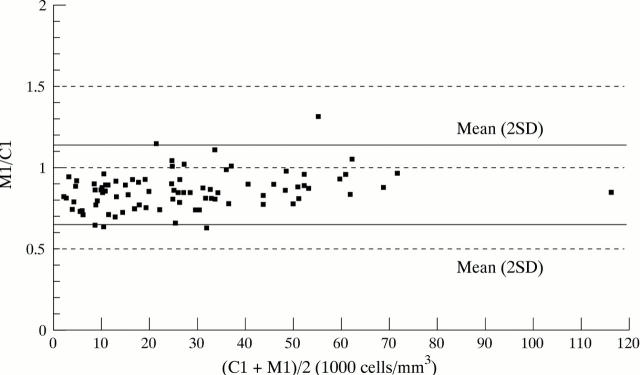
Figure 2 .
Ratio between manual (M1) and coulter (C1) counts (M1/C1) against the mean (C1+M1)/2 (Bland and Altman 11 (see Methods for details)). It shows that for cellularities above 2000 cells/mm3, manual counts were between +10% to −34% of the corresponding counts done by a coulter machine.
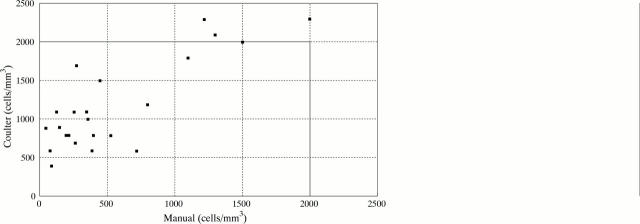
Figure 3 .
Manual and coulter counts in the samples in which manual counts were lower/equal to 2000 cells/mm3. Only three SF samples classified after manual counting as non-inflammatory (<2000 cells/mm3), were classified as inflammatory (>2000 cells/mm3) by a count done with a coulter machine.
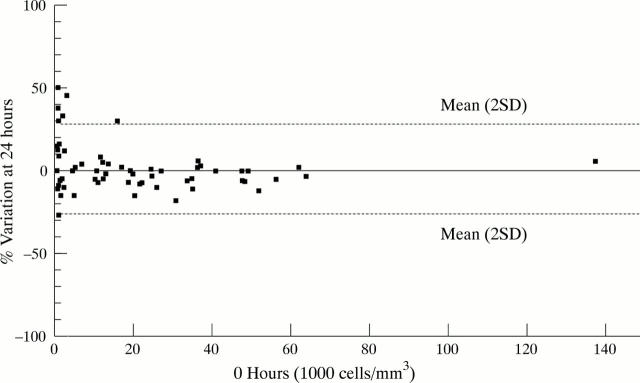
Figure 4 .
Ratio of coulter cell counts on fresh samples and aliquots kept at 24 hours at 4°C (Bland and Altman 11). There is little variation in cell counts.
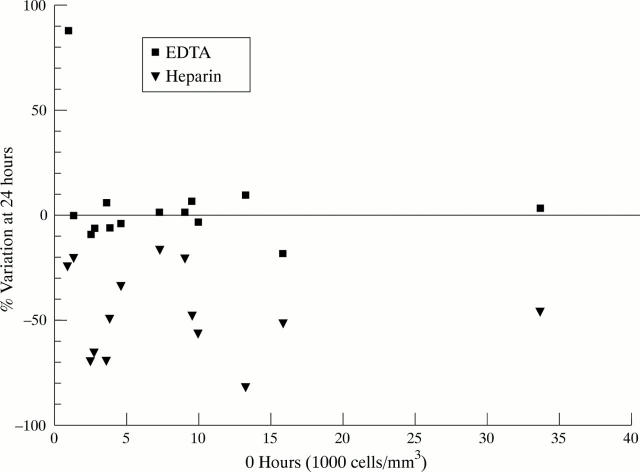
Figure 5 .
Ratio of coulter cell count preserved in EDTA and heparin, on fresh samples and at 24 hours at room temperature (Bland and Altman 11). The samples kept in EDTA show little variation while those in heparin show a drop in their cellularity.


