Abstract
OBJECTIVES—To assess the outcome of core decompression in the treatment of osteonecrosis of the femoral head related to the volume of necrotic bone measured according to a previously reported method. METHODS—Twenty hips corresponding to strictly Ficat stage II underwent magnetic resonance imaging and the volume of necrotic bone was expressed as a percentage of the volume of the entire head measured on each slice. All hips underwent core decompression and the outcome was evaluated at 24 months. The primary evaluation criterion was radiological appearance: the outcome was considered as good if the hip remained stage II and poor if the disease progressed. RESULTS—Twenty four months after core decompression, half the cases remained stable and in half the disease had progressed. Outcome seemed to be related to the volume of necrotic bone (average 22% in the good outcome group versus 45% in the poor outcome group (p = 0.0051)) and was independent of risk factors, age, and histological type. CONCLUSIONS—The volume of necrotic bone should be taken into account in the evaluation of any treatment, bearing in mind that in more than one third of cases this volume will probably decrease, especially at the beginning of the disease process.
Full Text
The Full Text of this article is available as a PDF (114.2 KB).
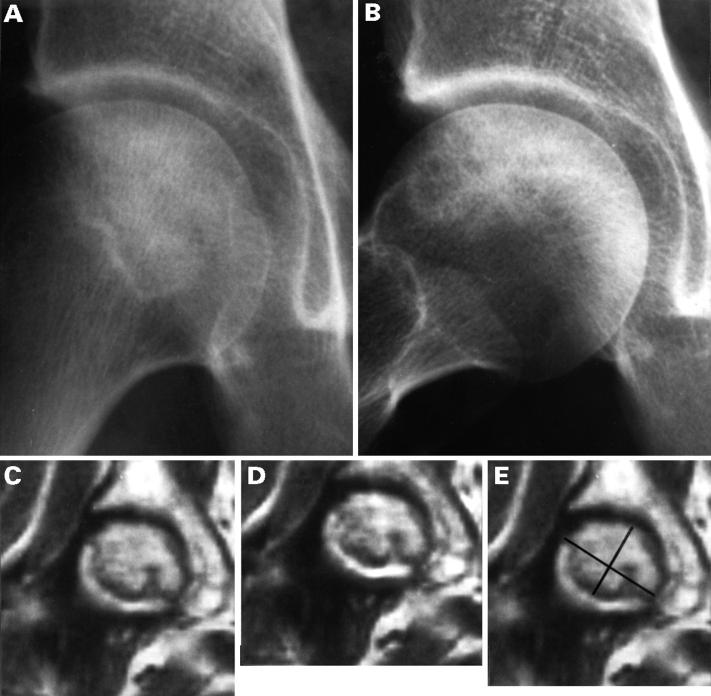
Figure 1 .
Case 2 , 56 year old women. Right hip: (A) on AP view a linear sclerotic line at the junction of femoral head and neck delineates a sclerotic area in the centre of the head; (B) on profile, the sclerotic zone is limited to the anterosuperior part of the head. On both views the femoral head is spherical (stage II); (C) MRI, T1 weighted image (TE: 500 ms, TR: 34 ms) a concave superiorly low signal intensity line delineates the necrotic area; (D) T2 weighted image (TE: 2000 ms, TR: 50 ms) the same line is observed, with a high signal intensity band at the convex aspect of the line ("double rim sign"); (E) on the T1 weighted image, the necrotic area is assimilated to a rectangle whose length and width are measured with a magnifying glass graduated in tenths of a millimetre.


