Abstract
OBJECTIVE—To determine if a single time point estimation of chondroitin sulphate (CS) or keratan sulphate (KS) epitopes, hyaluronan (HA), or total glycosaminoglycans (GAG) in knee synovial fluid at time of hospital referral can predict subsequent radiographic progression of knee osteoarthritis. METHODS—Two groups of hospital referred patients with knee osteoarthritis were compared: (1) a "progressive" group (n = 45), showing further reduction in radiographic joint space of at least one grade (0-3) in at least one compartment; and (2) a "non-progressive" group (n = 25) in whom radiographs showed no change during the mean follow up period of 2.3 years (median 2, range 1 to 5 years). Knee synovial fluid obtained at the first visit was examined by ELISA for: CS epitopes, using monoclonal antibodies 3B3 and 7D4; KS epitope, using monoclonal antibody 5D4; and HA, using biotinylated HA binding region of cartilage proteoglycan. Total sulphated GAG were measured by dye binding with 1:9 dimethylmethylene blue. RESULTS—In patients with bilateral synovial fluid data right and left knee values were closely correlated for all variables. There were no significant differences between CS and KS epitopes, HA, total sulphated GAG, or ratios of individual CS or KS epitopes to total GAG, between progressive and non-progressive groups. CONCLUSIONS—Single time point estimation of CS, KS, HA, or total GAG in synovial fluid does not distinguish radiographically progressive and non-progressive knee osteoarthritis patients followed for two years.
Full Text
The Full Text of this article is available as a PDF (157.3 KB).
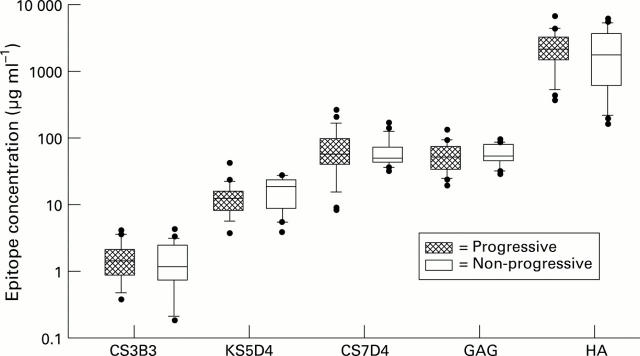
Figure 1 .
Comparison between progressive and non-progressive groups for all epitopes measured. The central solid line represents the median, with the box representing the middle 50% of the data. The error bar cap lines mark the 10th and 90th centiles. Dots represent individual data points outside the 10th and 90th centiles. CS3B3, chondroitin sulphate epitope 3B3; KS5D4, keratan sulphate epitope 5D4; CS7D4, chondroitin sulphate epitope 7D4; GAG, total sulphated glycosaminoglycans; HA, hyaluronan.
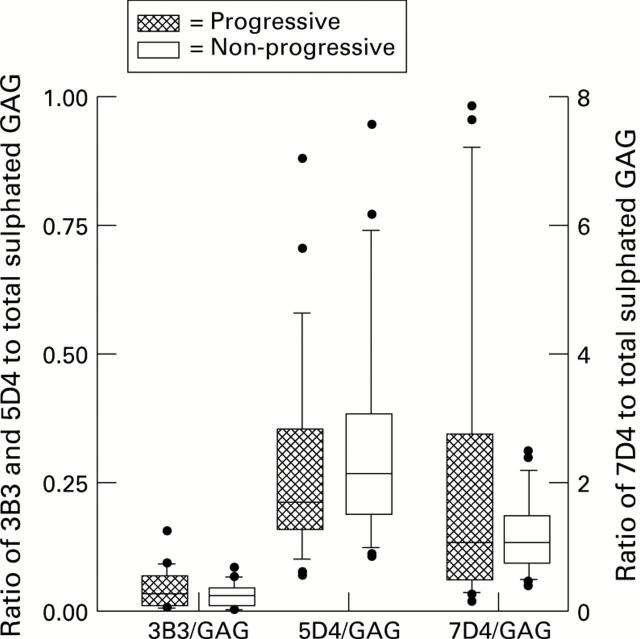
Figure 2 .
Comparison between progressive and non-progressive groups for ratio of chondroitin sulphate and keratan sulphate epitopes to total sulphated glycosaminoglycans. The central solid line represents the median, with the box representing the middle 50% of the data. The error bar cap lines mark the 10th and 90th centiles. Dots represent individual data points outside the 10th and 90th centiles. The left hand y axis is used for 3B3/GAG and 5D4/GAG. The right hand y axis is used for 7D4/GAG.


