Abstract
We have determined the crystal structure at 2.3-Å resolution of an amino-terminal segment of human insulin receptor substrate 1 that encompasses its pleckstrin homology (PH) and phosphotyrosine binding (PTB) domains. Both domains adopt the canonical seven-stranded β-sandwich PH domain fold. The domains are closely associated, with a 720-Å2 contact surface buried between them that appears to be stabilized by ionic, hydrophobic, and hydrogen bonding interactions. The nonconserved 46-residue linker between the domains is disordered. The PTB domain peptide binding site is fully exposed on the molecular surface, as is a large cationic patch at the base of the PH domain that is a likely binding site for the head groups of phosphatidylinositol phosphates. Binding assays confirm that phosphatidylinositol phosphates bind the PH domain, but not the PTB domain. Ligand binding to the PH domain does not alter PTB domain interactions, and vice versa. The structural and accompanying functional data illustrate how the two binding domains might act cooperatively to effectively increase local insulin receptor substrate 1 concentration at the membrane and transiently fix the receptor and substrate, to allow multiple phosphorylation reactions to occur during each union.
Activated insulin receptor (IR) tyrosine-phosphorylates itself and the IR substrates (IRS proteins), which consequently associate with and activate Src homology 2 domain enzymes (1, 2). This cascade of intracellular events is essential for insulin’s metabolic effects, a point that is underscored by the development of diabetes in mice after targeted deletion of insulin, IR, or IRS genes (proteins) (3). Growth factor, cytokine, and antigen receptors are linked like the IR, via associated tyrosine kinase activities and Src homology 2 domain enzymes, to downstream cellular effects such as differentiation, growth, morphology, and survival. But unlike IR, these alternative receptors do not have primary effects on nutrient uptake and storage.
Subcellular localization appears to be a critical determinant of receptor tyrosine kinase specificity (4). Notably, many other receptor tyrosine kinases activate phosphatidylinositol (PI) 3 kinase, but it is only during insulin signaling that PI3 kinase is required for regulating metabolic homeostasis. As an example of this complexity, insulin and platelet-derived growth factor (PDGF) both activate PI3 kinase in cultured adipocytes, but insulin stimulates glucose uptake and PDGF does not (5, 6). Potential differences between these signaling systems may provide clues about how insulin uniquely regulates metabolism. As one key distinction, PI3 kinase binds PDGF receptors directly, presumably at the plasma membrane, whereas PI3 kinase binds IRS proteins in insulin-stimulated cells. The IRS proteins must colocalize with IR, at least transiently, at or near the plasma membrane. But phosphorylated IRS proteins may be able to relocate to alternative sites in the cell (7, 8), whereas the movements of membrane-spanning receptors are restricted to plasma membrane and endosome compartments.
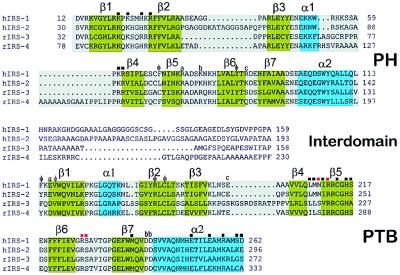
The four known IRS proteins have closely related targeting regions, suggesting common mechanisms for subcellular localization (9–12). Each targeting region is subdivided into a pleckstrin homology (PH) domain and a phosphotyrosine binding (PTB) domain (Fig. 1). Along with phosphorylation by IR, the unique tandem arrangement, amino-terminal location, and high sequence homology of the PH and PTB domains defines the IRS protein family. Sequence homology outside of the targeting region, in what is referred to as the activation domain, is much lower and limited to the short tyrosine-based motifs that bind and activate Src homology 2 domain proteins. To investigate potential mechanisms of IRS signaling, we have solved the crystal structure of the amino terminal targeting region of IRS-1 and analyzed ligand binding characteristics of its PH and PTB domains.
Figure 1.
Sequence alignment of the amino-terminal domains of human IRS-1 and IRS-2 and rat IRS-3 and IRS-4. Secondary structural elements of IRS-1 are shown above the alignments, and colored green (β-sheets) or turquoise (α-helices). Residues of the PTB domain that bind IR are labeled with red (phosphate binding) or black (all others) squares (13). PH domain residues forming the cationic patch at its base are labeled with black squares. Residues that are buried at the interface between domains are identified either as contributing to the hydrophobic patch (φ) or as a specific interaction [e.g., the PH domain residue labeled a (Arg-75) forms a salt bridge with PTB domain residue a (Glu-162), etc.]. Note the high degree of residue conservation at the interface and the great variability in length and composition of the interdomains of the four proteins.
MATERIALS AND METHODS
Crystallization.
A fragment of human IRS-1 (residues 4–271) was expressed as a glutathione S-transferase (GST) fusion protein in Escherichia coli and isolated by glutathione-agarose affinity chromatography. A slightly smaller fragment (4–267), obtained by cleaving the eluted fusion protein with bovine thrombin (10 units/mg protein) (13), was further purified by Mono-Q (Amersham Pharmacia Biotech) column chromatography. Crystals were grown at room temperature by vapor diffusion in hanging drops containing equal volumes of protein solution (10 mg/ml in 25 mM Tris, pH 8.0, 200 mM NaCl, and 10 mM DTT) and reservoir solution (1.7 M sodium phosphate, pH 7.5, and 10 mM DTT). The crystals reached maximal dimensions of 0.2 × 0.2 × 0.3 mm over several days; they belong to hexagonal spacegroup P65 (a = b = 120.44 Å, c = 79.60 Å) and contain two molecules per asymmetric unit. Crystals were transferred stepwise into reservoir solution containing 20% glycerol for cryogenic data collections.
Structure Determination.
Diffraction data were recorded with a MarResearch Image Plate detector mounted on an Elliot GX-13 rotating anode source with mirror optics. Oscillation images (0.5°) were integrated and scaled with the programs marxds and marscale (14). The structure was determined by a combination of single isomorphous replacement (SIR) and molecular replacement (MR). Three independent data sets were obtained from single crystals that had been incubated for 12 h in mother liquor containing 1 mM methylmercury nitrate. Heavy atom positions were located by Patterson and difference Fourier methods with the CCP4 program package (15). Heavy atom parameters were refined and phases were calculated with mlphare; anomalous data were included in the phase calculations (15). Unambiguous solutions to rotational and translational searches were obtained for the PTB domain portion of the structure by using the IRS-1 PTB domain (13) as a search model and the program amore (16). SIR and MR phase information was combined by using the program sigmaa (15). Electron density maps were improved by real space noncrystallographic symmetry averaging by using the program dm (17). Skeletonization of the improved map with bones (18) allowed an α carbon model of the pleckstrin PH domain to be fit as a rigid body adjacent to the PTB domain. The model was refined by using noncrystallographic symmetry restraints, simulated annealing, and positional refinement, and it was manually refitted by using the programs xplor (19) and o (18). Water molecules were added manually. The final model includes all residues of the PH (12–116) and PTB (160–264) domains and 90 solvent molecules. Residues 117–159 corresponding to the interdomain linker are disordered.
Binding Assays.
PI phosphate binding analyses were conducted as described (20). Synthetic, water-soluble [3H]dioctanoyl PI(3,4,5)P3 (5 × 10⁷ cpm/mmol) (21) was incubated (1 h, 21°C) with glutathione agarose beads containing ≈3.5 mM of one of the following GST/human IRS-1 fusion proteins: GST/PH-PTB (residues 4–271), GST/PTB domain (144–316), GST/PH domain (13–116), or GST alone, in 30 mM Hepes buffer, pH 7.0, containing 100 mM NaCl, 1.0 mM EDTA, and 0.02% NP-40. Supernatant solutions were used to determine binding affinities according to the equation [bound] = Bmax × [free]/(KD + [free]), where [bound] and [free] refer to bound and free concentrations of [3H]PI(3,4,5)P3, Bmax is the amount bound under saturating conditions, and KD is the dissociation constant.
Methods for using the BIAcore Biosensor (Amersham Pharmacia) to determine KD values have been described (22). Peptides were immobilized to a CM5 chip through the ɛ-amino group of C-terminal Lys. Peptide accessibility was confirmed by antiphosphotyrosine antibody (4G10) binding. Binding was measured between PH-PTB and PTB domain proteins (without fusions) and peptide IRpY960 (Ac-LYASSNPApYLSASDVK-NH2) and its scrambled counterpart (Ac-YLSDVASLpYASPANSK-NH2). Data were analyzed by using the Eadie Hofstee equation, cRU = (−cRU/[protein])KD + cRUmax (22).
RESULTS AND DISCUSSION
Structures of the PH and PTB Domains.
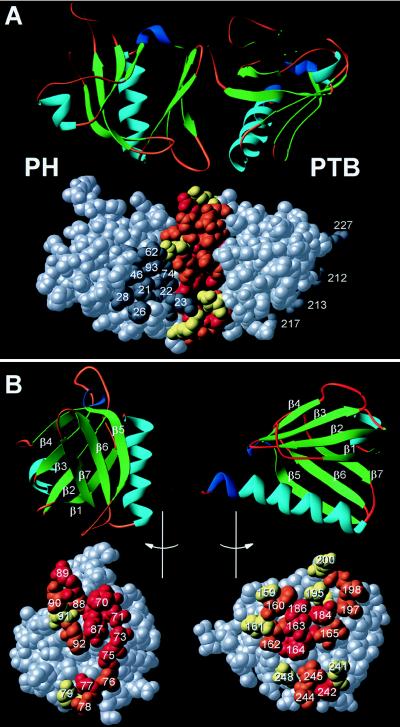
Residues 4–267 of human IRS-1 were crystallized, and the structure was solved by molecular replacement and single isomorphous replacement methods. The structure has been refined to crystallographic R value of 19%, by using data to 2.3-Å resolution. Details of the structure determination and refinement are presented in Table 1. The PH and PTB domains both adopt the conserved PH domain fold, a seven-stranded, antiparallel β-sandwich that is capped at one end by an α-helix (Figs. 2 and 3). No electron density is observed for the interdomain linker region (residues 117–159). Considering the linker composition, this is not surprising; 26 (60%) of the 43 residues are glycine, alanine, and serine (Fig. 1). Unlike the PH and PTB domains, whose sequences are well conserved, interdomain linkers of the four IRS proteins vary greatly in length, from 28 to 51 residues, and composition (Fig. 1), suggesting that this region of each IRS protein serves similarly as a flexible tether between PH and PTB domains.
Table 1.
Summary of single isomorphous replacement phase determination and refinement statistics
| Crystal
|
||||
|---|---|---|---|---|
| Native | MeHgNO3 | MeHgNO3 | MeHgNO3 | |
| Data collection | ||||
| Max. resolution (Å) | 2.3 | 2.7 | 2.8 | 3.1 |
| Completeness (%) | 97 | 58 | 80 | 91 |
| Rsym (%) | 6.3 | 5.9 | 5.3 | 7.7 |
| Rder (%) | 34 | 32 | 33 | |
| Phasing power (Acen/Cen) | 2.22/1.56 | 2.14/1.59 | 2.11/1.50 | |
| Number of sites | 2 | 2 | 2 | |
| Reflections, observed | 91,581 | 19,398 | 26,511 | 25,198 |
| Reflections, unique | 29,443 | 10.489 | 13,339 | 11,085 |
| Refinement statistics | ||||
| Refinement resolution | 8.0–2.3 Å | |||
| Reflections used | 26,412 | |||
| Completeness of working set (1σ/2σ) | 82%/57% | |||
| Rwork factors (1σ/2σ) | 22.4/19.1 | |||
| Rtest factors (1σ/2σ) | 27.5/24.7 | |||
| rms deviation bond lengths/bond angles | 0.008 Å/1.38° | |||
| B-value (average/bonded SD) | 3.61 Å/2.06 Å2 | |||
Space group, P65. Unit cell, a = b = 120.44, c = 79.60. Rsym = ∑ |I-〈I〉|/∑I, where I is the observed intensity and 〈I〉 is the average intensity of multiple observations of symmetry related reflections. Rder = ∑ ∥ FPH|− |FP∥/∑|Fp|, where |FP| is the protein structure factor amplitude and |FPH| is the heavy atom structure factor amplitude. Phasing power = rms (|FH|/E), where |FH| is the heavy atom structure factor amplitude and E is the residual lack of closure error. Figure of merit = 〈∑P(α)eiα/∑P(α)〉, in which α is the phase and P(α) is the phase probability distribution. R = ∑∥Fo|−|Fc∥/∑|Fo|, where Rtest is calculated for a randomly chosen 5% of reflections, Rwork is calculated for the remaining 95% of reflections used for structure refinement.
Figure 2.
Structure of the IRS-1 targeting domain. (A) Ribbon diagram of the PH-PTB structure, with β-sheets shaded green, α-helices in turquoise, 310 turns colored indigo, and intervening coils or loops in brown. Corey–Pauling–Koltun space-filling model oriented as the ribbon diagram; residues within the PTB domain binding site (facing away) and putative PH domain binding site are colored dark gray and numbered; residues at the interface between the two domains are colored according to percent buried: red, 50–100%; orange, 25–50%; and yellow, 1–25%. (B) The PH/PTB domain interface viewed as an open book. The PH and PTB domains each were rotated 90o, relative to their orientations in A, but in opposite directions to expose the buried surface between them. Elements of secondary structure and contact residues are labeled.
Figure 3.
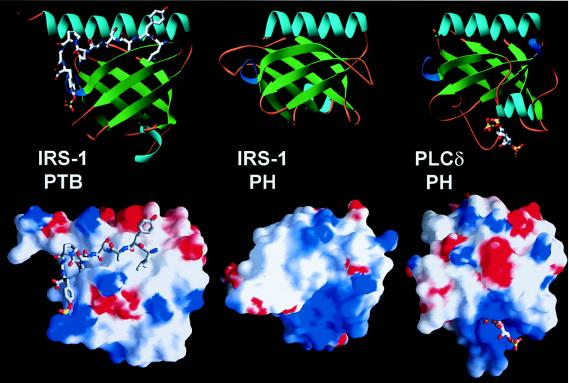
Structure and function of individual domains. Ribbons (Upper) and surface potential (Lower) diagrams of the IRS-1 PTB and PH domains and the PLC-δ1 PH domain are similarly oriented. The IRS-1 PTB domain is bound to the IR juxtamembrane NPXpY peptide; the PLC-δ1 PH domain is bound to Ins(1,4,5)P3. Solvent-accessible surfaces are shaded according to electrostatic potential, −5 kt/e, red to +7 kt/e, blue, by using the program grasp. The Ins(1,4,5)P3 binding pocket at the base of the PLC-δ1 domain is positively charged. An analogous pocket is at the base of the IRS-1 PH domain; the PTB domain has a distinct mode of binding.
The PTB domain portion of the tandem PH-PTB domain structure is essentially identical to that of the isolated IRS-1 domain we reported previously (13, 23). The PTB domains of IRS-1, IRS-2, IRS-3, and IRS-4 are highly homologous (35% identity; 59–67% similarity) and are expected to have essentially identical structures. No recognizable sequence homology is shared between IRS PTB domains and Shc or Shc-like PTB domains (24). Nevertheless, the Shc (25), X11 (26), and Numb (27) PTB domains also adopt the general PH domain fold, but these domains are much longer than PH and IRS PTB domains due to long insertions between the β1 and β2 strands.
The PH domain portion of the IRS-1 structure contains a short α-helix (α1), in addition to the seven β-strands and the longer helix (α2) common to PH domains (Figs. 2 and 3). The PH domain β3/β4 loop and the α1-helix within it pack against strands β2, β3, and β4 of the back PH domain β-sheet. Interactions between four aromatic side chains appear to fix the short α1-helix and β3/β4 loop to the body of the domain (Tyr-18, Phe-29, Tyr-47, and Trp-53). An α-helix within the β3/β4 loop of the β spectrin PH domain packs similarly against its back β-sheet (28). PH domains of the other IRS proteins undoubtedly have very similar structures, sharing 23.5% identity and 40–50% similarity (Fig. 1). PH domains in general have much lower sequence homology, instead being defined by six blocks in conserved patterns of hydrophobic and hydrophilic residues (29, 30).
An Interface Between PH and PTB Domains.
There are two PH domains and two PTB domains in the asymmetric unit of our crystals. Each PH domain interacts with two PTB domains. The more extensive interaction buries 720 Å2 of potentially accessible surface between domains; the smaller interaction buries 345 Å2 of potentially accessible surface. Because the linker is disordered, it is not possible to unequivocally establish covalent connections between domains. Nevertheless, the more extensive orientation illustrated in Fig. 2 appears more likely to represent the physiologically relevant interface. The PH and PTB domains are closely associated and arranged with the front sheet of the PH domain (β5, β6, and β7) packed against the back of the PTB domain (β1, β2, β3, and α2). A hydrophobic patch between the domains is formed by Phe-70 and Tyr-87 of the PH domain and Phe-160, Val-163, Arg-184, and Cys-186 of the PTB domain. The interaction appears to be further stabilized by numerous potential hydrogen bonds, including Asn-71 to Phe-160; Arg-75 to Val-163; Asp-77 and Ser-78 to Asp-242; Thr-88, Arg-89, and Glu-91 to Arg-184; Asp-90 to Asn-198; and Asn-73 to Val-163; and potential salt bridges between side chains of Arg-75 and Glu-162; Lys-79 and both Asp-242 and Asp-241; and Arg-89 and Glu-200. Residues at the 720-Å2 interface are conserved between IRS proteins, suggesting that interactions between domains in IRS-2, IRS-3, and IRS-4 might similarly occur. Conserved residues at the interface include Tyr-87, Phe-160, Val-163, Arg-184, and Cys-186 that form the hydrophobic patch between domains (the Arg-184 guanidinium group also hydrogen bonds backbone carbonyls of Thr-88, Arg-89, and Glu-91), Arg-75, Lys-79, Glu-162, Glu-200, Asp-241, and Asp-242 (Fig. 1). Supporting this possibility, the IRS-2 PH domain can substitute for the IRS-1 domain of a chimeric IRS protein transfected into cells; residues at the interface are not conserved in PH and PTB domains from alternative, non-IRS proteins, and function is lost when the IRS-1 PH domain is substituted with one of these other PH domains (31).
The alternative orientation that buries 345 Å2 of potentially accessible surface more likely represents crystal packing. Here, two loops of the PH domain (β2/β3 and β3/β4) contact an edge at the bottom of the PTB domain (strands β1 and β2 and loop β3/β4). There are two potential hydrogen bonds (Lys-196 to Gly-39 and Asn-198 to Glu-45) and a small hydrophobic patch formed by Ile-182, Leu-197, and Pro-60 between the domains.
Ligand Binding.
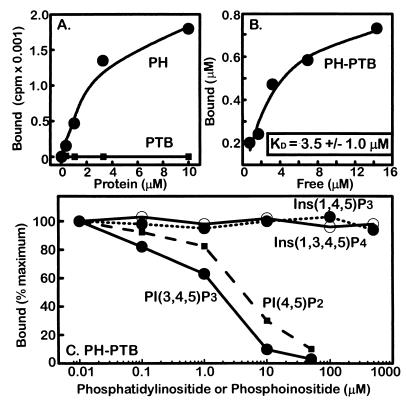
Although ligands were not present during the crystallization of IRS-1 (4–267), previous studies illustrate mechanisms of IR juxtamembrane recognition by the IRS-1 PTB domain (13, 23). PH domains from different proteins bind phosphatidylinositides and inositol phosphates (InsPs) within a cluster of basic residues located at the base of each of these domains (Fig. 3) (30). Although physiological ligands for the IRS-1 PH domain have not been reported, the clustering of cationic residues on its surface predicted similar binding characteristics. Direct assays demonstrate that phosphatidylinositides bind the IRS-1 PH domain but not its PTB domain (Fig. 4; Table 2). [3H]dioctanoyl PI(3,4,5)P3, a synthetic, water-soluble form of PI(3,4,5)P3 containing two octanoic acids in place of the natural, long-chain fatty acids, was used in direct binding assays to avoid some of the complexity of analyzing protein binding to lipid bilayers and micelles (20). GST/PTB domain fusion proteins bind NPXpY peptides (13, 32), but do not bind the phosphatidylinositides or InsPs used in this study (Fig. 4). A previous report of IRS-1 PTB domain binding to InsPs may reflect contributions from the cationic polyhistidine fusion protein used (33). Because the GST/PH-PTB domain fusion protein is more stable than the GST/PH domain, and the presence of PTB domain does not interfere with the measurements, the tandem construct was used in many PI phosphate and InsP binding assays. [3H]dioctanoyl PI(3,4,5)P3 binds the tandem PH-PTB domain with a KD value of 3.5 ± 1.0 μM.
Figure 4.
Binding assays. (A) The PH domain binds [3H]dioctanoyl PI(3,4,5)P3; the PTB domain does not. We are not reporting KD values for interactions with the isolated PH domain protein because of its inherent instability. (B) The IRS-1 PH-PTB domain protein binds [3H]dioctanoyl PI(3,4,5)P3 with a KD value of 3.5 ± 1.0 μM. (C) Binding of phosphatidylinositides to the PH-PTB protein. Competition assays were used to determine relative affinities of PH-PTB toward phosphatidylinositides and phosphoinositides, by using [3H]dioctanoyl PI(3,4,5)P3 as the tracer.
Table 2.
Competitive binding of PH-PTB to phosphatidylinositides and inositol phosphates using [3H]dioctanoyl P(3,4,5)IP3 as tracer
| Competitor | IC50, μM | Competitor | IC50, μM |
|---|---|---|---|
| PI(3,4,5)P3 | 2.2 ± 0.6 | Ins(1,3,4,5)P4 | >100 |
| PI(4,5)P2 | 2.5 ± 0.3 | Ins(1,4,5)P3 | >100 |
| PI(3,4)P2 | 16.0 ± 6.3 | Ins(1,3,4)P3 | >100 |
| PI(4)P | 13.7 ± 3.4 | Ins(4)P | >100 |
| PI(3)P | >50 | — | — |
| PI | >50 | Myoinositol | >1000 |
[3H]dioctanoyl PI(3,4,5)P3 was used in competition assays to compare relative affinities of unlabeled PI phosphate and InsPs (Table 2). Micelles containing synthetic dipalmitoyl (C16) PI(3,4,5)P3 compete with [3H]dioctanoyl PI(3,4,5)P3 for binding, with an estimated IC50 value of 2.2 ± 0.6 μM. Micelles containing brain PI(4,5)P2 bind with slightly weaker relative affinity (IC50 = 3.5 ± 0.6 μM), whereas micelles containing PI(3,4)P2 and PI(4)P bind with significantly lower affinity (IC50 = 16.0 ± 6.3 μM and 13.7 ± 3.4 μM, respectively). Competition is undetectable with micelles containing PI(3)P or PI (IC50 >50 μM). Because PI(3,4,5)P3 and PI(4,5)P2 bind with highest affinity, and PI(3,4)P2 and PI(4)P bind with 4- to 8-fold lower affinity, phosphorylation at the D-5 position contributes to affinity and specificity. PI(3)P and PI, which differ from PI(3,4)P2 and PI(4)P by the absence of the D-4 phosphate, have even weaker (undetectable) binding. Therefore, the D-4 and D-5 phosphates are critical determinants for IRS-1 PH domain binding to phosphatidylinositides, whereas the D-3 phosphate has little role in these interactions, as was recently predicted (34).
Diacylglycerol portions of PI phosphates appear to be important for the interactions, as Ins(1,3,4,5)P4, Ins(1,4,5)P3, and Ins(1,3,4)P3, corresponding to the headgroups of PI(3,4,5)P3, PI(4,5)P2, and PI(3,4)P2, respectively, do not compete with [3H]dioctanoyl PI(3,4,5)P3 (Table 2). In parallel experiments we asked whether [3H]InsPs bind directly to the tandem IRS-1 PH-PTB domain. Consistent with the competition studies, tritiated Ins(1,3,4,5)P4, Ins(1,4,5)P3, and Ins(1,3,4)P3 show negligible binding. The structure of the phospholipase C (PLC)-δ1 PH domain bound to Ins(1,4,5)P3 provides a high-resolution example of ligand binding within a cationic patch at the base of the domain (35) (Fig. 3). Residues in the β1/β2 and β3/β4 loops of the PLC-δ1 domain contribute to the patch and polarity of the domain. Clustered cationic residues at the base of the IRS-1 PH domain include Lys-21, Lys-23, His-26, Arg-28, Lys-61, and Arg-62 (Figs. 1 and 3). These residues also are found within the β1/β2 and β3/β4 loops, suggesting similar functions. Substitution of Lys-30, Lys-32, or Arg-40 in the PLC-δ1 PH domain, which correspond structurally to IRS-1 residues Lys-21, Lys-23, and Arg-28, diminishes affinity for Ins(1,4,5)P3 (36). Anionic peptides (37) likely bind the same site, although the physiological relevance of these interactions remains obscure.
By identifying distinct ligands for the two IRS domains, we were able to determine whether binding to one domain influences the binding affinity or specificity of the other domain. Phosphopeptide binding measurements were made by using biospecific interaction analysis (22). PTB domain or PH-PTB domain solutions were passed over Biosensor chips containing immobilized IRpY960 peptide, a high-affinity ligand for the PTB domain. Calculated KD values are 2.6 ± 0.1 μM and 2.2 ± 1.4 μM, respectively. Identical experiments, conducted with PH-PTB domain solutions equilibrated with 20 μM dioctanoyl PI(3,4,5)P3, yielded a similar KD value (3.8 ± 1.2 μM). The converse experiment, measurement of PH domain binding to dioctanoyl PI(3,4,5)P3, was conducted as described in previous sections, but measurements were made in the absence (KD = 3.9 ± 0.7 μM) or presence of 100 μM IRpY960 peptide (KD = 7.6 ± 2.9 μM) or 100 μM of its scrambled counterpart (KD = 10.1 ± 4.1 μM). Thus binding to either domain within the PH-PTB targeting region of IRS-1 does not alter the binding properties of the other domain, indicating that there is no cross-talk between domains.
Model of IR/IRS Signaling.
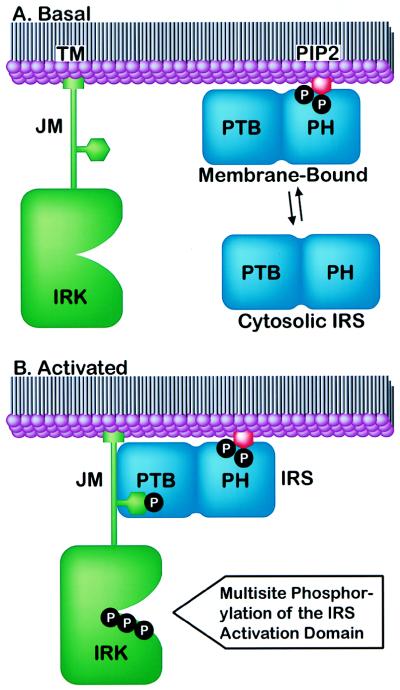
The structure and accompanying functional data suggest that the two targeting domains of IRS-1 act cooperatively. The PH domain binds PI phosphates in the following rank order: PI(3,4,5)P3 = PI(4,5)P2 > PI(3,4)P2 = PI(4)P > PI(3)P = PI. In unstimulated cells the PH domain may interact primarily with membranes containing PI(4,5)P2, the most abundant phosphatidylinositide. On insulin stimulation, PI(3,4,5)P3 and P(3,4)P3 levels increase locally and may contribute additional sites for IRS-1 interaction. PH domain binding alters subcellular distribution of IRS-1, moving it from the three-dimensional cytosol compartment to the two-dimensional plasma membrane. PH domain binding simultaneously increases concentrations of IRS-1 in the IR compartment and positions the PTB domain and IR for productive binding (Fig. 5). With receptor and substrate thus fixed at a site distinct from the catalytic kinase domain, each union between IR and IRS-1 can culminate in the phosphorylation of multiple tyrosines in the IRS-1 activation domain (containing ≈1,000 residues and >15 potential tyrosine phosphorylation sites). This provides a mechanism for amplifying the insulin signal in cells to unique targets that affect nutrient uptake and storage.
Figure 5.
Model for insulin signaling through the IR/IRS axis. (A) Under basal conditions in the absence of insulin, IR (green) is not phosphorylated (TM, transmembrane domain; JM, juxtamembrane domain; IRK, IR kinase). IRS (blue) associates reversibly with PI(4,5)P2 (red) in the plasma membrane. Phosphates are represented by the letter P within closed black circles. (B) Insulin stimulates IR activation, leading to phosphorylation of three Tyr residues in the activation loop of IRK and one in the JM NPXY motif. Membrane-bound IRS proteins associate with the receptor JM, which transiently fixes the two proteins for phosphorylation of multiple tyrosine residues in the IRS activation domain.
Acknowledgments
We thank S. Harrison (Howard Hughes Medical Institute, Harvard University) and L. Rameh and L. Cantley (Harvard Medical School) for support and advice. Financial support was provided by the National Institutes of Health (DK43123 and DK51729 to S.E.S.) and Burroughs-Wellcome Fund (M.J.E. and S.E.S.). S.D.-P. and E.A.O. are recipients of National Research Service Award fellowships from the National Institutes of Health (DK09517 and DK09146). The Joslin Diabetes Center biochemistry facility is supported by a Diabetes and Endocrinology Research Center grant from the National Institutes of Health.
ABBREVIATIONS
- PH
pleckstrin homology
- PTB
phosphotyrosine binding
- IR
insulin receptor
- IRS
IR substrate
- PI
phosphatidylinositol
- GST
glutathione S-transferase
- PLC
phospholipase C
- InsP
inositol phosphate
Footnotes
Data deposition: The structure factors have been deposited in the Protein Data Bank, www.rcsb.org (PDB ID code 1QQG).
References
- 1.Lee J, Pilch P F. Am J Physiol. 1995;266:C319–C334. doi: 10.1152/ajpcell.1994.266.2.C319. [DOI] [PubMed] [Google Scholar]
- 2.White M F. Recent Prog Horm Res. 1998;53:119–138. [PubMed] [Google Scholar]
- 3.Taylor S I. Cell. 1999;97:9–12. doi: 10.1016/s0092-8674(00)80709-6. [DOI] [PubMed] [Google Scholar]
- 4.Pawson T, Scott J D. Science. 1997;278:2075–2080. doi: 10.1126/science.278.5346.2075. [DOI] [PubMed] [Google Scholar]
- 5.Isakoff S J, Taha C, Rose E, Marcusohn J, Klip A, Skolnik E Y. Proc Natl Acad Sci USA. 1995;92:10247–10251. doi: 10.1073/pnas.92.22.10247. [DOI] [PMC free article] [PubMed] [Google Scholar]
- 6.Wiese R J, Mastick C C, Lazar D F, Saltiel A R. J Biol Chem. 1995;270:3442–3446. doi: 10.1074/jbc.270.7.3442. [DOI] [PubMed] [Google Scholar]
- 7.Heller-Harrison R A, Morin M, Guilherme A, Czech M P. J Biol Chem. 1996;271:10200–10204. doi: 10.1074/jbc.271.17.10200. [DOI] [PubMed] [Google Scholar]
- 8.Clark S F, Martin S, Carozzi A J, Hill M M, James D E. J Cell Biol. 1998;140:1211–1225. doi: 10.1083/jcb.140.5.1211. [DOI] [PMC free article] [PubMed] [Google Scholar]
- 9.Sun X J, Rothenberg P, Kahn C R, Backer J M, Araki E, Wilden P A, Cahill D A, Goldstein B J, White M F. Nature (London) 1991;352:73–77. doi: 10.1038/352073a0. [DOI] [PubMed] [Google Scholar]
- 10.Sun X J, Wang L-M, Zhang Y, Yenush L, Myers M G, Glasheen E, Lane W S, Pierce J H, White M F. Nature (London) 1995;377:173–177. doi: 10.1038/377173a0. [DOI] [PubMed] [Google Scholar]
- 11.Lavan B E, Lane W S, Lienhard G E. J Biol Chem. 1997;272:11439–11443. doi: 10.1074/jbc.272.17.11439. [DOI] [PubMed] [Google Scholar]
- 12.Lavan B E, Fantin V R, Chang E T, Lane W S, Keller S R, Lienhard G E. J Biol Chem. 1997;272:21403–21407. doi: 10.1074/jbc.272.34.21403. [DOI] [PubMed] [Google Scholar]
- 13.Eck M J, Dhe-Paganon S, Trub T, Nolte R, Shoelson S E. Cell. 1996;85:695–705. doi: 10.1016/s0092-8674(00)81236-2. [DOI] [PubMed] [Google Scholar]
- 14.Kabsch W J. J Appl Crystrallogr. 1988;21:916–924. [Google Scholar]
- 15.Collaborative Computational Project 4. Acta Crystallogr D. 1994;50:760–776. [Google Scholar]
- 16.Navaza J. In: Molecular Replacement: Proceedings of the CCP4 Study Weekend. Dodson E J, Gover S, Wolf W, editors. Daresbury, U.K.: Science and Engineering Research Council; 1992. pp. 87–90. [Google Scholar]
- 17.Cowtan K. Joint CCP 4 ESF-EACBM Newsl Protein Crystallogr. 1994;31:34–38. [Google Scholar]
- 18.Jones T A, Zou J Y, Cowan S W, Kjeldgaard M. Acta Crystallogr A. 1991;47:110–119. doi: 10.1107/s0108767390010224. [DOI] [PubMed] [Google Scholar]
- 19.Brunger A T. x-plor, Version 3.1: A System for X-Ray Crystallography and NMR. New Haven, CT: Yale Univ. Press; 1992. [Google Scholar]
- 20.Rameh L E, Arvidsson A, Carraway K L, Couvillon A D, Rathbun G, Crompton A, VanRenterghem B, Czech M P, Ravichandran K S, Burakoff S J, et al. J Biol Chem. 1997;272:22059–22066. doi: 10.1074/jbc.272.35.22059. [DOI] [PubMed] [Google Scholar]
- 21.Wang D S, Chen C S. J Org Chem. 1996;61:5905–5910. [Google Scholar]
- 22.Ottinger E A, Botfield M, Shoelson S E. J Biol Chem. 1998;273:729–733. doi: 10.1074/jbc.273.2.729. [DOI] [PubMed] [Google Scholar]
- 23.Zhou M-M, Huang B, Olejniczak E T, Meadows R P, Shuker S B, Miyazaki M, Trub T, Shoelson S E, Fesik S W. Nat Struct Biol. 1996;3:388–393. doi: 10.1038/nsb0496-388. [DOI] [PubMed] [Google Scholar]
- 24.Bork P, Margolis B. Cell. 1995;80:693–694. doi: 10.1016/0092-8674(95)90347-x. [DOI] [PubMed] [Google Scholar]
- 25.Zhou M-M, Ravichandran K S, Olejniczak E T, Petros A M, Meadows R P, Harlan J E, Wade W S, Burakoff S J, Fesik S W. Nature (London) 1995;378:584–592. doi: 10.1038/378584a0. [DOI] [PubMed] [Google Scholar]
- 26.Zhang Z, Lee C H, Mandiyan V, Borg J P, Margolis B, Schlessinger J, Kuriyan J. EMBO J. 1997;16:6141–6150. doi: 10.1093/emboj/16.20.6141. [DOI] [PMC free article] [PubMed] [Google Scholar]
- 27.Li S-C, Zwahlen C, Vincent S J, McGlade C J, Kay L E, Pawson T, Forman-Kay J D. Nat Struct Biol. 1998;5:1075–1083. doi: 10.1038/4185. [DOI] [PubMed] [Google Scholar]
- 28.Macias M J, Musacchio A, Ponstingl H, Nilges J, Saraste M, Oschkinat H. Nature (London) 1994;369:675–677. doi: 10.1038/369675a0. [DOI] [PubMed] [Google Scholar]
- 29.Musacchio A, Gibson T, Rice P, Thompson J, Saraste M. Trends Biochem Sci. 1993;18:343–348. doi: 10.1016/0968-0004(93)90071-t. [DOI] [PubMed] [Google Scholar]
- 30.Lemmon M A, Ferguson K M. Curr Top Microbiol Immunol. 1998;228:39–74. doi: 10.1007/978-3-642-80481-6_3. [DOI] [PubMed] [Google Scholar]
- 31.Burks D J, Pons S, Towery H, Smith-Hall J, Myers M G, Jr, Yenush L, White M F. J Biol Chem. 1997;272:27716–27721. doi: 10.1074/jbc.272.44.27716. [DOI] [PubMed] [Google Scholar]
- 32.Wolf G, Trub T, Ottinger E, Groninga L, Lynch A, White M, Miyazaki M, Lee J, Shoelson S E. J Biol Chem. 1995;270:27407–27410. doi: 10.1074/jbc.270.46.27407. [DOI] [PubMed] [Google Scholar]
- 33.Takeuchi H, Matsuda M, Yamamoto T, Kanematsu T, Kikkawa U, Yagisawa H, Watanabe Y, Hirata M. Biochem J. 1998;334:211–218. doi: 10.1042/bj3340211. [DOI] [PMC free article] [PubMed] [Google Scholar]
- 34.Isakoff S J, Cardozo T, Andreev J, Li Z, Ferguson K M, Abagyan R, Lemmon M A, Aronheim A, Skolnik E Y. EMBO J. 1998;17:5374–5387. doi: 10.1093/emboj/17.18.5374. [DOI] [PMC free article] [PubMed] [Google Scholar]
- 35.Ferguson K M, Lemmon M A, Schlessinger J, Sigler P B. Cell. 1995;83:1037–1046. doi: 10.1016/0092-8674(95)90219-8. [DOI] [PubMed] [Google Scholar]
- 36.Yagisawa H, Sakuma K, Paterson H F, Cheung R, Allen V, Hirata H, Watanabe Y, Hirata M, Williams R L, Katan M. J Biol Chem. 1998;273:417–424. doi: 10.1074/jbc.273.1.417. [DOI] [PubMed] [Google Scholar]
- 37.Burks D J, Wang J, Towery H, Ishibashi O, Lowe D, Riedel H, White M F. J Biol Chem. 1998;273:31061–31067. doi: 10.1074/jbc.273.47.31061. [DOI] [PubMed] [Google Scholar]


