Abstract
OBJECTIVE—The objective of this study was to quantify selected features of chronic synovial tissue inflammation by computerised image analysis and to validate the results by comparison with conventional microscopic measurements. METHODS—Synovial biopsy samples were obtained from the knee joints of patients with chronic arthritis and prepared for immunohistochemical analysis using standard techniques. Following the development of special software, four parameters of chronic synovial inflammation were evaluated: intimal layer thickness, CD3+ cell infiltration, CD8+ cell infiltration and vascularity. Intimal layer thickness was expressed in microns. The intensity of CD3+ and CD8+ cell infiltration was expressed as the percentage area of the tissue section occupied by positively stained cells. Vascularity was expressed as the percentage area occupied by blood vessels. Conventional quantitative microscopic analysis was also undertaken and the results from both methods compared. RESULTS—Seventy eight tissue sections were selected for study. Measurements of intimal layer thickness by both techniques correlated strongly: r = 0.85, p = 0.0006. Measurements of CD8+ cell infiltration, usually widely dispersed, also correlated well: r = 0.64, p = 0.005. Measurements of CD3+ cell infiltration, often densely aggregated, correlated less well: r = 0.55, p = 0.02. Measurements of vascularity demonstrated no statistically significant correlation: r = 0.41, p = 0.07. Proficiency in the use of computerised image analysis was readily acquired. CONCLUSION—Computerised image analysis was successfully applied to the measurement of some features of synovial tissue inflammation. Further software development is required to validate measurement of blood vessels of variable size.
Full Text
The Full Text of this article is available as a PDF (19.5 MB).
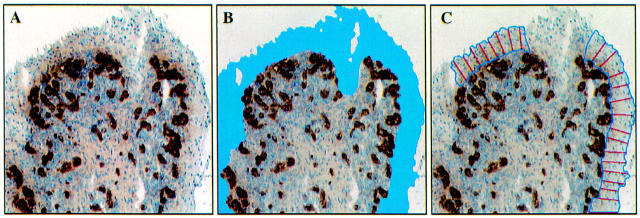
Figure 1 .
Automated measurement of lining layer thickness. The tissue section is stained for von Willebrand factor (A). The lining layer contains no blood vessels and is easily identified (B). Perpendicular lines at 20-30 µm intervals represent the lining layer thickness (C). The middle section of the lining layer is interupted by a cutting artefact.
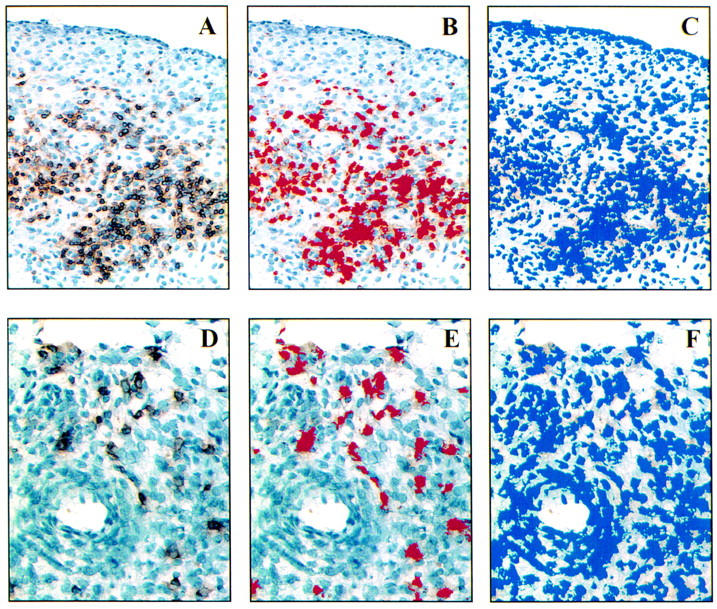
Figure 2 .

Automated measurement of CD3+ and CD8+ cell infiltration. The panels illustrate the interactive steps in the computerised image analysis routine for quantifying areas occupied by CD3+ cells (A, B, C) and CD8+ cells (D, E, F). Panels on left (A and D) demonstrate the digital images of stained cells acquired from the microscope. The middle panels (B and E) outline in pseudocolours the area occupied by immunohistochemically stained cells as judged by the computer. Panels on right (C and F) illustrate the total area of haematoxylin stained nucleated cells outlined in pseudocolours. The area occupied by CD3+ cells is 18 200 µm2 (B) and of total haematoxylin stained 53 100 µm2 (C) representing an incidence of 34.3% CD3+ cells in this area. CD8+ cells covers an area of 3400 µm2 (E) and total cells 29 700 µm2 (F), indicating 11.4% CD8+ T cells in this field.
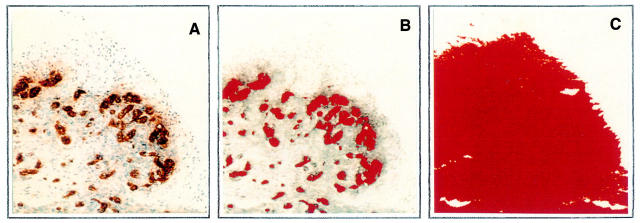
Figure 3 .
Automated measurement of vascularity. Following staining with von Willebrand factor the left panel (A) represents the digital image of blood vessels acquired from the microscope. The middle panel (B) outlines in pseudocolour the area occupied by the blood vessels, including the endothelial cells and lumen. The right panel (C) illustrates the total tissue area analysed for vascularity depicted in red pseudocolour by the computer. The blood vessels occupy an area of 29 300 µm2 (B) while the total tissue area is 143 000 µm2 (C), meaning that the vascular area in this field represent 20.5% of the total area.
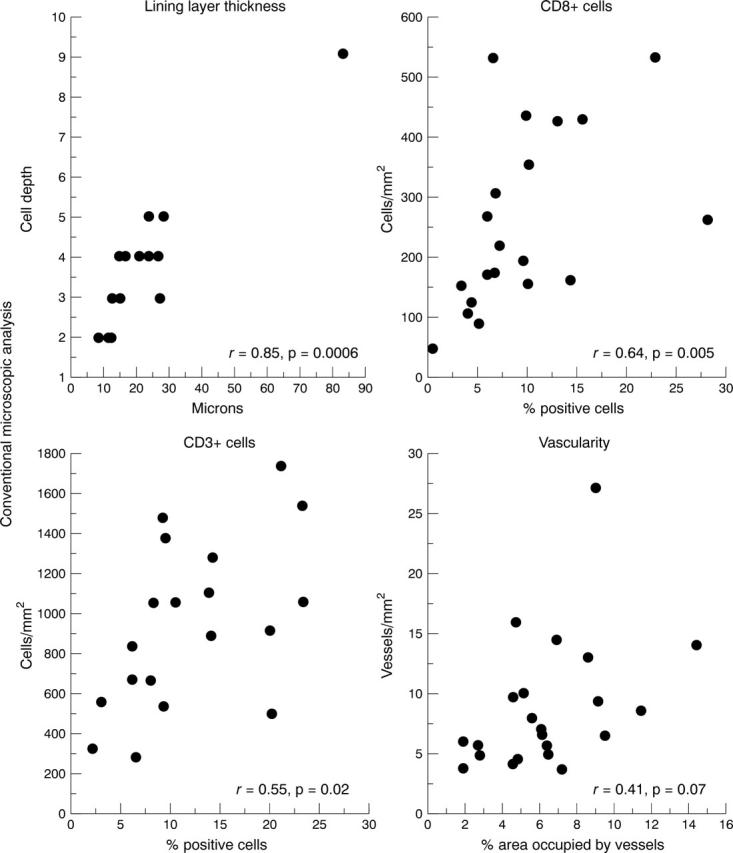
Figure 4 .

Correlations between computerised image analysis and conventional microscopic analysis of synovial tissue inflammation using Spearman rank correlation statistics.
Selected References
These references are in PubMed. This may not be the complete list of references from this article.
- Bjork L., Fehniger T. E., Andersson U., Andersson J. Computerized assessment of production of multiple human cytokines at the single-cell level using image analysis. J Leukoc Biol. 1996 Feb;59(2):287–295. doi: 10.1002/jlb.59.2.287. [DOI] [PubMed] [Google Scholar]
- Bresnihan B., Cunnane G., Youssef P., Yanni G., Fitzgerald O., Mulherin D. Microscopic measurement of synovial membrane inflammation in rheumatoid arthritis: proposals for the evaluation of tissue samples by quantitative analysis. Br J Rheumatol. 1998 Jun;37(6):636–642. doi: 10.1093/rheumatology/37.6.636. [DOI] [PubMed] [Google Scholar]
- Cunnane G., Bresnihan B., FitzGerald O. Immunohistologic analysis of peripheral joint disease in ankylosing spondylitis. Arthritis Rheum. 1998 Jan;41(1):180–182. doi: 10.1002/1529-0131(199801)41:1<180::AID-ART24>3.0.CO;2-V. [DOI] [PubMed] [Google Scholar]
- Firestein G. S., Paine M. M., Boyle D. L. Mechanisms of methotrexate action in rheumatoid arthritis. Selective decrease in synovial collagenase gene expression. Arthritis Rheum. 1994 Feb;37(2):193–200. doi: 10.1002/art.1780370207. [DOI] [PubMed] [Google Scholar]
- Firestein G. S., Paine M. M., Littman B. H. Gene expression (collagenase, tissue inhibitor of metalloproteinases, complement, and HLA-DR) in rheumatoid arthritis and osteoarthritis synovium. Quantitative analysis and effect of intraarticular corticosteroids. Arthritis Rheum. 1991 Sep;34(9):1094–1105. doi: 10.1002/art.1780340905. [DOI] [PubMed] [Google Scholar]
- Kohlberger P. D., Obermair A., Sliutz G., Heinzl H., Koelbl H., Breitenecker G., Gitsch G., Kainz C. Quantitative immunohistochemistry of factor VIII-related antigen in breast carcinoma: a comparison of computer-assisted image analysis with established counting methods. Am J Clin Pathol. 1996 Jun;105(6):705–710. doi: 10.1093/ajcp/105.6.705. [DOI] [PubMed] [Google Scholar]
- Litton M. J., Dohlsten M., Hansson J., Rosendahl A., Ohlsson L., Kalland T., Andersson J., Andersson U. Tumor therapy with an antibody-targeted superantigen generates a dichotomy between local and systemic immune responses. Am J Pathol. 1997 May;150(5):1607–1618. [PMC free article] [PubMed] [Google Scholar]
- Litton M. J., Dohlsten M., Lando P. A., Kalland T., Ohlsson L., Andersson J., Andersson U. Antibody-targeted superantigen therapy induces tumor-infiltrating lymphocytes, excessive cytokine production, and apoptosis in human colon carcinoma. Eur J Immunol. 1996 Jan;26(1):1–9. doi: 10.1002/eji.1830260102. [DOI] [PubMed] [Google Scholar]
- Ong S. H., Jin X. C., Jayasooriah, Sinniah R. Image analysis of tissue sections. Comput Biol Med. 1996 May;26(3):269–279. doi: 10.1016/0010-4825(96)00004-2. [DOI] [PubMed] [Google Scholar]
- Tak P. P., Taylor P. C., Breedveld F. C., Smeets T. J., Daha M. R., Kluin P. M., Meinders A. E., Maini R. N. Decrease in cellularity and expression of adhesion molecules by anti-tumor necrosis factor alpha monoclonal antibody treatment in patients with rheumatoid arthritis. Arthritis Rheum. 1996 Jul;39(7):1077–1081. doi: 10.1002/art.1780390702. [DOI] [PubMed] [Google Scholar]
- Tak P. P., van der Lubbe P. A., Cauli A., Daha M. R., Smeets T. J., Kluin P. M., Meinders A. E., Yanni G., Panayi G. S., Breedveld F. C. Reduction of synovial inflammation after anti-CD4 monoclonal antibody treatment in early rheumatoid arthritis. Arthritis Rheum. 1995 Oct;38(10):1457–1465. doi: 10.1002/art.1780381012. [DOI] [PubMed] [Google Scholar]
- Wong A. J., Kohn G. J., Schwartz H. J., Ruebner B. H., Lawson M. J. Colorectal cancer and noncancer patients have similar labeling indices by microscopy and computed image analysis. Hum Pathol. 1995 Dec;26(12):1329–1332. doi: 10.1016/0046-8177(95)90297-x. [DOI] [PubMed] [Google Scholar]
- Youssef P. P., Haynes D. R., Triantafillou S., Parker A., Gamble J. R., Roberts-Thomson P. J., Ahern M. J., Smith M. D. Effects of pulse methylprednisolone on inflammatory mediators in peripheral blood, synovial fluid, and synovial membrane in rheumatoid arthritis. Arthritis Rheum. 1997 Aug;40(8):1400–1408. doi: 10.1002/art.1780400807. [DOI] [PubMed] [Google Scholar]
- Youssef P. P., Smeets T. J., Bresnihan B., Cunnane G., Fitzgerald O., Breedveld F., Tak P. P. Microscopic measurement of cellular infiltration in the rheumatoid arthritis synovial membrane: a comparison of semiquantitative and quantitative analysis. Br J Rheumatol. 1998 Sep;37(9):1003–1007. doi: 10.1093/rheumatology/37.9.1003. [DOI] [PubMed] [Google Scholar]
- Youssef P. P., Triantafillou S., Parker A., Coleman M., Roberts-Thomson P. J., Ahern M. J., Smith M. D. Effects of pulse methylprednisolone on cell adhesion molecules in the synovial membrane in rheumatoid arthritis. Reduced E-selectin and intercellular adhesion molecule 1 expression. Arthritis Rheum. 1996 Dec;39(12):1970–1979. doi: 10.1002/art.1780391205. [DOI] [PubMed] [Google Scholar]
- Youssef P. P., Triantafillou S., Parker A., Coleman M., Roberts-Thomson P. J., Ahern M. J., Smith M. D. Variability in cytokine and cell adhesion molecule staining in arthroscopic synovial biopsies: quantification using color video image analysis. J Rheumatol. 1997 Dec;24(12):2291–2298. [PubMed] [Google Scholar]


