Abstract
OBJECTIVE—Raised serum C reactive protein (CRP) and hyaluronate (HA) concentrations predict the progression of knee osteoarthritis (OA) in the long term but the consistency of these relations with time is unknown. The purpose of this work was therefore to determine if raised CRP and HA at entry and three years before entry (−3 years) predict radiological progression of knee OA in a group of patients between entry and five years. METHODS—Knee radiographs from 90 patients with knee OA at entry and five years follow up were assessed for progression of disease over five years. The concentrations of serum CRP and HA were measured at entry (n=90) and also in 40 serum samples available from −3 years. Odds ratios (OR) for predicting progression were calculated by logistic regression. RESULTS—Serum CRP at entry was not predictive of progression between entry and five years (OR 1.12, 95% CI 0.81, 1.55) but serum CRP at −3 years was predictive of progression (OR 1.90, 95% CI 1.01, 3.28). Serum HA concentration at entry predicted progression between entry and five years (OR 2.32, 95% CI 1.16, 4.66). CONCLUSION—These results are consistent with previous reports relating to HA, and suggest that raised serum CRP reflects events that precede a period of later radiographic progression in knee OA. However, because of the large overlap between groups, the serum CRP or HA concentration are not good predictors of individual patient progression and have a poor sensitivity and specificity.
Full Text
The Full Text of this article is available as a PDF (125.1 KB).
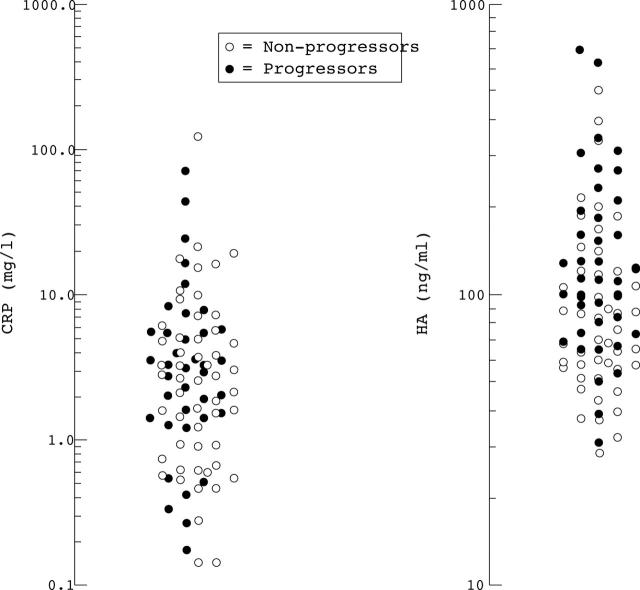
Figure 1 .
Serum CRP and serum HA concentrations in all patients (n=90) at entry.
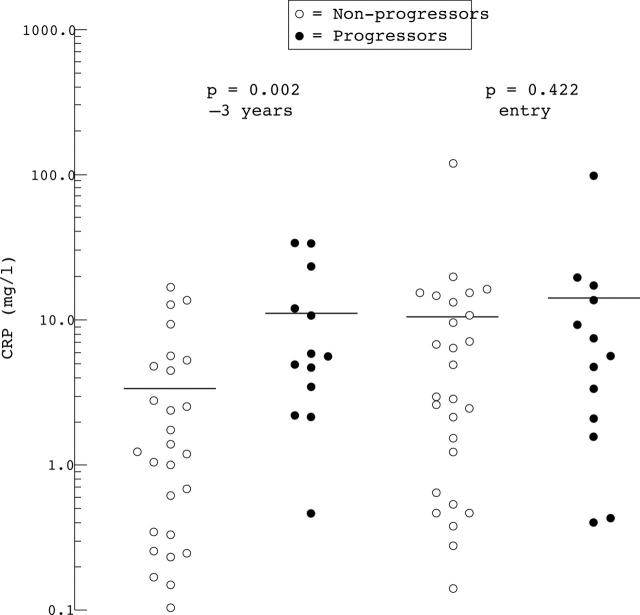
Figure 2 .
Serum CRP concentrations at −3 years and at entry in relation to disease outcome for the 40 patients in whom both samples were available. The horizontal bars indicate the mean in each group, p values are from Mann-Whitney U test.
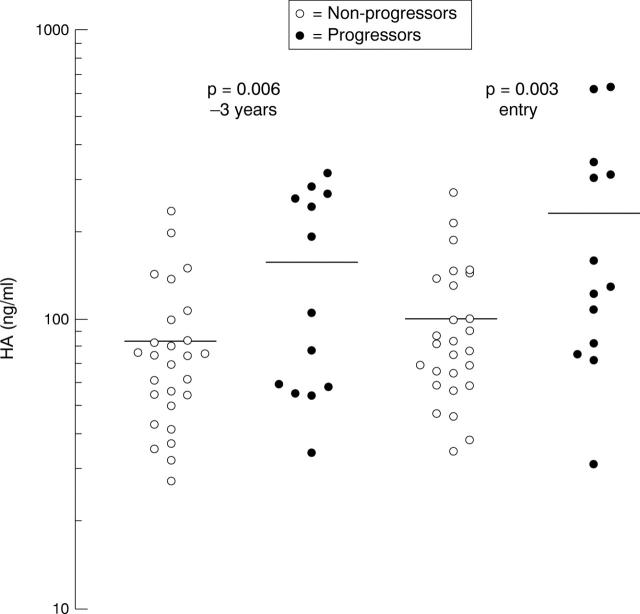
Figure 3 .
Serum HA concentrations at −3 years and at entry in relation to disease outcome for the 40 patients in whom both samples were available. The horizontal bars indicate the mean in each group, p values are from Mann-Whitney U test.


