

Full Text
The Full Text of this article is available as a PDF (275.8 KB).
Figure 1 .
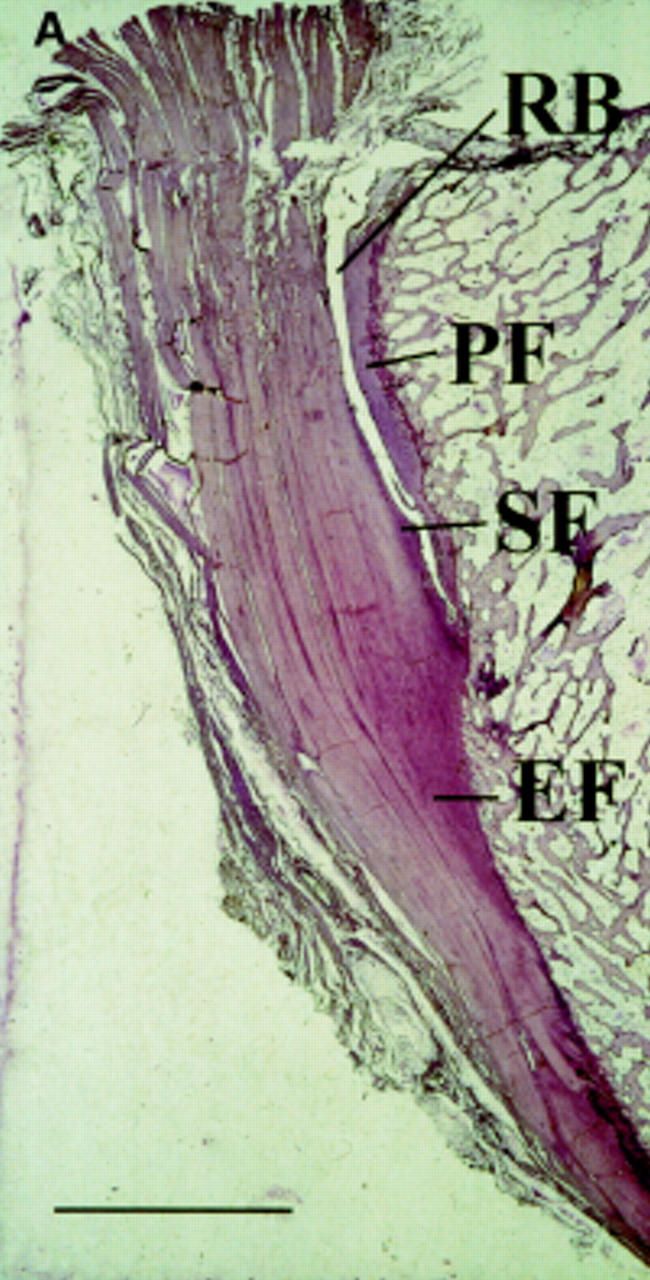

(A) Low power view of the attachment of the Achilles tendon to the calcaneus to show the complexity of structures that jointly comprise the enthesis. These structures include the enthesis fibrocartilage (EF), sesamoid fibrocartilage (SF), periosteal fibrocartilage (PF), and the retrocalcaneal bursa (RB). Toluidine blue. Scale bar 0.5 cm. (B) A high power view of the enthesis of the supraspinatus tendon in the region of the tidemark (T). This highly basophilic line is a calcification front separating the zones of calcified and uncalcified fibrocartilage. It is relatively straight and this contrasts with the irregularity of the junction between the calcified fibrocartilage (CF) and the underlying bone (B) (junction marked with *). It is such interdigitations that help to hold the two tissues together. Note that the fibrocartilage cells (FC) are more conspicuous in the region of uncalcified fibrocartilage. Haematoxylin and eosin. Scale bar 100 µm. (Courtesy of Dr M Benjamin, University of Cardiff, Wales.)
Figure 2 .

Low power view of a normal sacroiliac joint showing the synovial membrane (left) and its attachment to the cartilage (centre), the bone marrow at the right bottom with the attached subchondral bone and cartilage above and numerous blood vessels in the subchondral area. (Courtesy of Professor D Gardener, University of Edinburgh, Scotland.)
Figure 3 .

Sacroiliac joint biopsy specimen of a 29 year old male patient with ankylosing spondylitis and bilateral inflammatory low back pain located to the right side and a disease duration of 7.5 years. The biopsy specimen shows a subchondral cellular infiltrate partly invading the cartilage. Fibroblasts and activated lymphocytes are seen in the infiltrate. In between are areas of calcification and bone formation. (Haematoxylin and eosin staining, magnification 250×.)
Figure 4 .

T1 weighted magnetic resonance image after application of gadolinium-DTPA, performed when the patient reported pronounced left sided, low back complaints for the first time (starting about four weeks ago, severity index of 8 on a visual analogue scale of 0 to 10), showed a high and steep contrast enhancement (Fenh 94%) in the left subchondral zone on the iliac side, in the left joint space, and at the left posterior joint capsule, with extension to the pericapsular tendinous and muscular attachments. The left anterior aspect likewise shows signs of moderate capsulitis. The linear contrast enhancement of the right anterior portion of the capsular ligaments that extends to the anterior iliac periosteum may still be regarded as normal capsular enhancement. Because MRI depicted no signs of chronic inflammatory changes and the anterior joint spaces on both sides were still smoothly demarcated, the overall appearance was classified as MRI stage 0X/0B according to Brandt et al.74
Figure 5 .

Magnetic resonance imaging subtraction image of a 32 year old HLA-B27+ patient with undifferentiated spondyloarthropathy showing acute fasciitis plantaris (all the white appearing enhancement after gadolinium application corresponds to oedema and inflammation). Reproduced with permission of the copyright holders from Akt Rheumatol 2000;25:1-9.