Abstract
OBJECTIVE—Sacroiliitis is a hallmark of the spondyloarthropathies (SpA). The degree of inflammation can be quantified by magnetic resonance imaging (MRI). The aim of this study was to further elucidate the pathogenesis of SpA by quantitative cellular analysis of immunostained sacroiliac biopsy specimens and to compare these findings with the degree of enhancement in the sacroiliac joints (SJ) as detected by dynamic MRI. METHODS—The degree of acute sacroiliitis detected by MRI after intravenous administration of gadolinium-DTPA was quantitatively assessed by calculating the enhancement observed in the SJ and chronic changes were graded as described in 32 patients with ankylosing spondylitis (n=18), undifferentiated SpA (n=12) and psoriatic arthritis (n=2). Back pain was graded on a visual analogue scale (VAS, 0-10) and disease duration (DD) was assessed. Shortly after MRI, SJ of patients with VAS > 5 were biopsied guided by computed tomography. Immunohistological examination was performed using the APAAP technique; only whole sections > 3 mm were counted. RESULTS—By MRI, chronic changes ⩽ grade II were detected in nine patients (group I, DD 2.5 (SD 2.9) years) and > II in 13 patients (group II, DD 7.3 (SD 4.8) years), while enhancement < 70% was found in eight (group A, DD 5.6 (SD 3.3) years) and > 70% in 12 patients (group B, DD 4.7 (SD 5.8) years). The relative percentage of cartilage (78-93%), bone (7-18%) and proliferating connective tissue (1-4%) was comparable between the groups (range). There were more inflammatory cells in group I compared with group II (mean (SD) 26.7(20.1) versus 5.3 (5.2), p=0.04) and group A compared with B (21.8 (17.3) versus 6.0 (5.6), p=0.05) cells/10 mm2), T cells (10.9 (8.5)) being slightly more frequent than macrophages (9.6 (16.8/10 mm2)). Clusters of proliferating fibroblasts were seen in three and new vessel formation in seven cases. CONCLUSION—This study shows that T cells and macrophages are the most frequent cells in early and active sacroiliitis in SpA. The correlation of cellularity and MRI enhancement provides further evidence for the role of dynamic MRI to detect early sacroiliitis.
Full Text
The Full Text of this article is available as a PDF (208.7 KB).
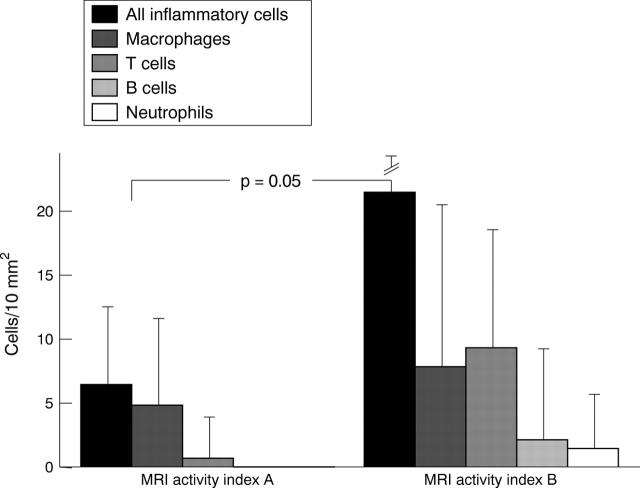
Figure 1 .
Detailed comparison of relative cell counts of sacroiliac biopsies between patients with different degrees of enhancement in MRI.
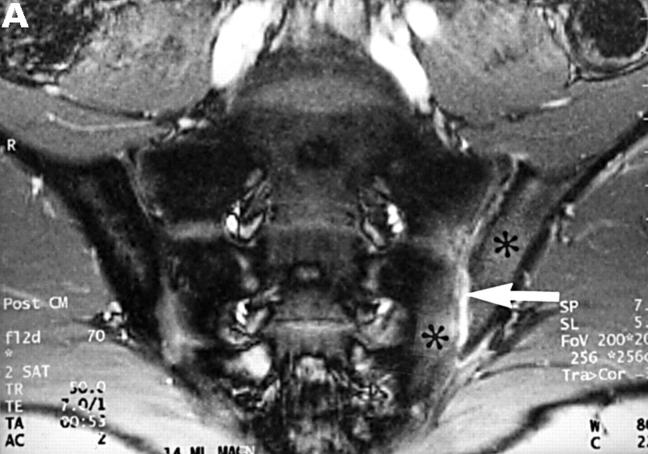
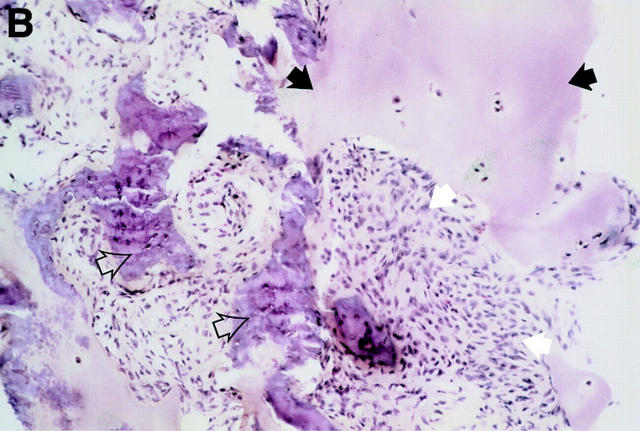
Figure 2 .
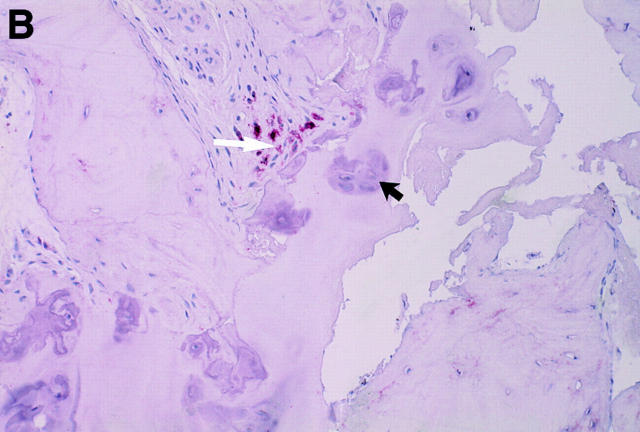
MRI and SJ biopsy specimen of a 16 year old HLA B27+ uSpA patient with unilateral IBP located in the left buttock. (A) T1 weighted gradient echo sequence five minutes after application of gadolinium-DTPA showing some chronic changes and definite acute changes mainly in the left SJ (arrow) and in the periarticular left bone marrow (asterisk) (grade Ix right and Ib left). (B) The biopsy specimen shows a cellular infiltrate containing activated fibroblasts and CD45+ lymphocytes (white arrows) that seem to invade a degenerate cartilagineous area (black arrows). In the middle areas of calcification and bone formation (open black arrows), (immunohistology/haematoxylin and eosin staining, original magnification × 400).
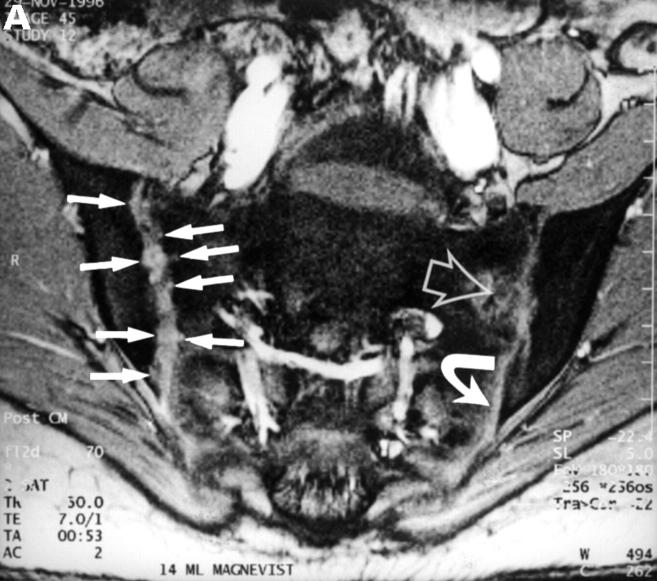
Figure 4 .
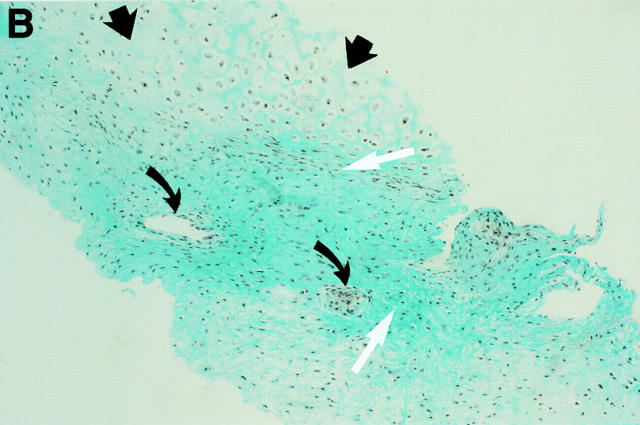
MRI and SJ biopsy specimen of a 17 year old female uSpA patient with unilateral inflammatory low back pain located to the right side and a disease duration of 1.5 years. (A) T1 weighted gradient echo sequence three minutes after application of gadolinium-DTPA showing acute and chronic changes only in the right sacroiliac joint (grade IIb right and 0x left): several small erosions are depicted as contrast enhanced areas (white arrows) connected to the right joint cavity. Left side the transition zone between the ligamentous joint segment (white open arrow) and the synovial joint segment (curved white arrow) is recognisable. (B) The biopsy specimen shows fibrocartilaginous metaplasia with hyaline cartilage above (black arrows) and a fibroblastic cellular infiltrate below (white arrows) characterised by increased new blood vessel formation (black curved arrows), (Goldner staining, original magnification × 250). There were also some but few CD3+ T cells in this area (not shown).
Figure 5 .
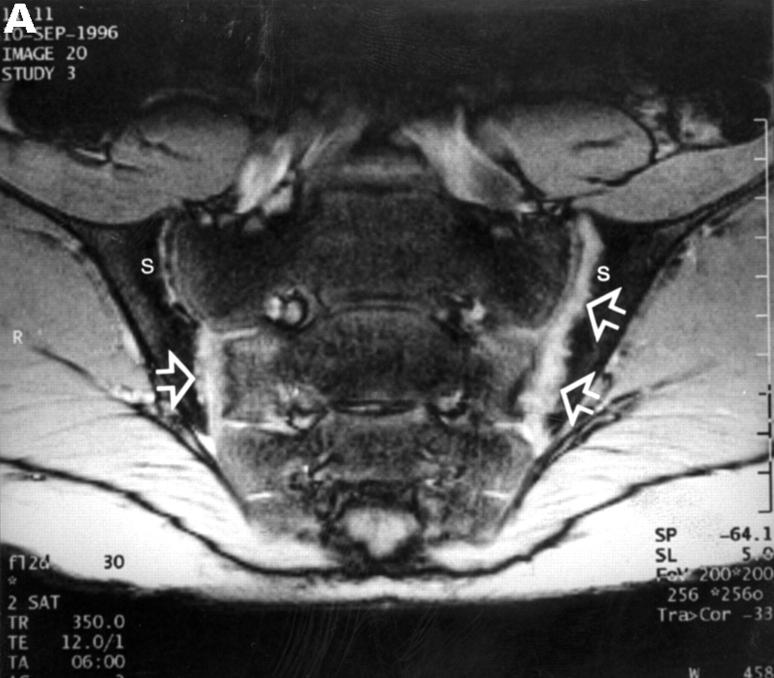
MRI and SJ biopsy specimen of a HLA B27+ 16 year old male juvenile AS patient with bilateral inflammatory low back pain and a disease duration of 7.5 years. (B). T2* weighted gradient echo sequence showing bilateral chronic changes with marked iliac subcondral sclerosis (s) and confluent erosions with consecutive pseudodistention of the joint spaces (white open arrows) in both SJ (bilateral chronicity grade III, bilateral activity grade b, not shown). (B) The biopsy specimen shows a subchondral cellular infiltrate partly invading the cartilage (black arrows). There are fibroblasts and activated lymphocytes in the infiltrate. In between are areas of bone formation (asterisks) and avital bone fragments (curved black arrow) and calcifications (haematoxylin and eosin staining, original magnification × 250).
Figure 6 .
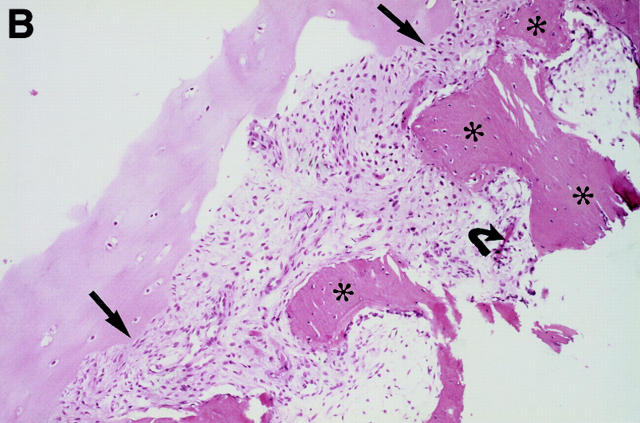
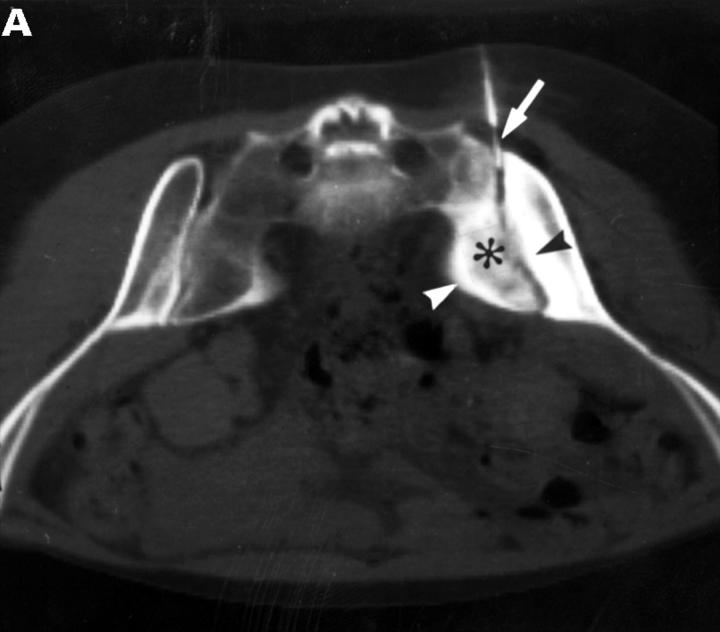
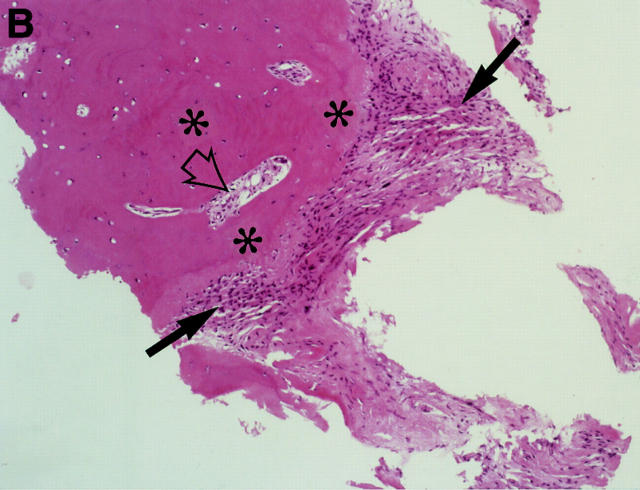
CT and SJ biopsy of a 28 year old female HLA B27+ AS patient with a disease duration of 4.9 years and severe IBP mainly right side. (A) CT showing definite chronic changes in the right SJ (chronicity grade III-IV, activity grade b, not shown) compared with moderate changes on the left side (chronicity grade I, activity grade x, not shown). The biopsy needle (white arrow) is located in the synovial part of the joint. The iliac (black arrowhead) and the sacral side (white arrowhead) of the sacroiliac joint show hypersclerotic bone with some bony bridges crossing the joint space. The somewhat transparent juxta-articular region (asterisk) is still active (better seen on MRI, not shown). (B) The biopsy specimen shows a dense cellular infiltrate (black arrows), consisting mainly of fibroblasts and some lymphocytes close to a bony area (asterisks) with signs of new bone formation indicated by the presence of an osteon (black open arrow).
Figure 7 .
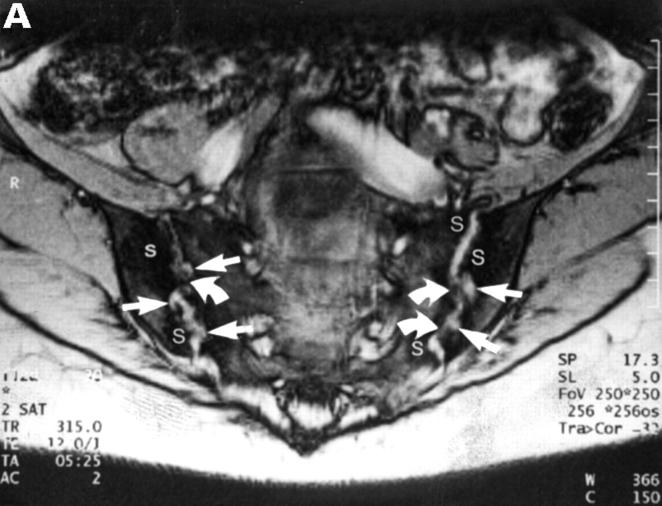
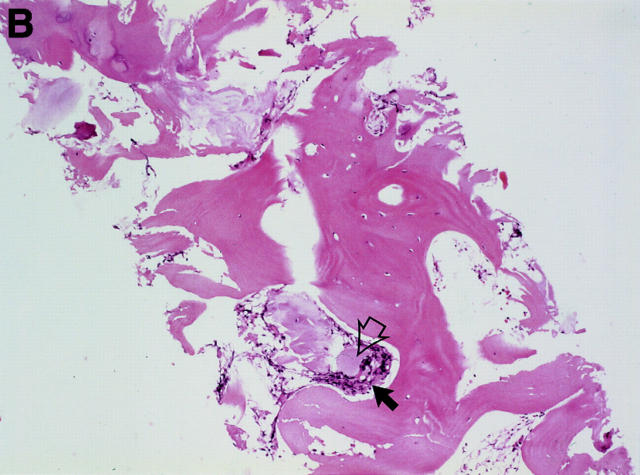
MRI and SJ biopsy specimen of a 36 year old female HLA B27+ AS patient with a disease duration of 10 years with bilateral inflammatory low back pain. (A) T2* weighted gradient echo sequence showing definite chronic changes with bilateral marked subcondral sclerosis (s), huge erosions (white arrows) and some bony bridges crossing the joint spaces (curved white arrows) (bilateral chronicity grade III-IV, bilateral activity grade a, not shown). (B) The biopsy specimen shows a sparse cellular infiltrate (black arrow) with an avital piece of cartilage (black open arrow) surrounded by a large area of bone (haematoxylin and eosin staining, original magnification × 250).
Figure 3 .
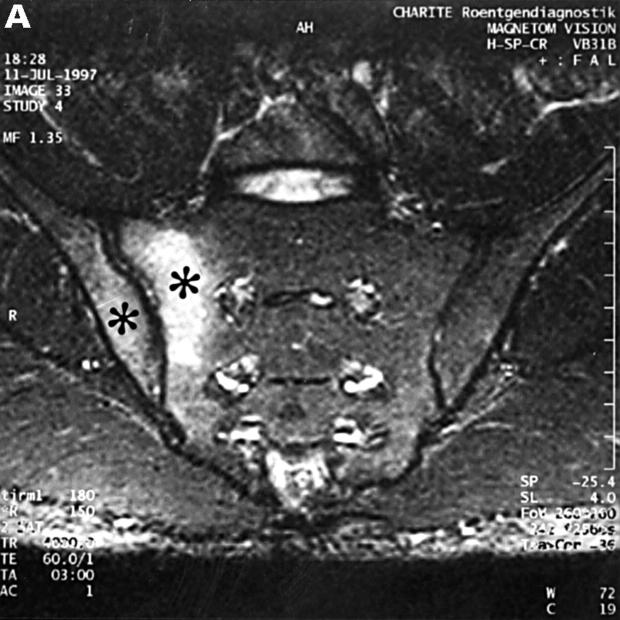
MRI and SJ biopsy specimen of a 35 year old man HLA B27+ uSpA patient with a disease duration of 1.8 years and severe IBP. (A) STIR sequence showing definite acute changes in the right sacroiliac joint (chronicity grade I, activity grade b) compared with a normal left side. The bone marrow osteitis and bone marrow oedema are clearly seen on both sides of the right sacroiliac joint (asterisks). (B) The biopsy specimen shows a cellular infiltrate (white arrow), containing CD3+ T lymphocytes that seem to invade a cartilagineous area with a chondroclast (black arrow) and hypertrophic chondrocytes (immunohistology/haematoxylin and eosin staining, original magnification × 500).
Selected References
These references are in PubMed. This may not be the complete list of references from this article.
- Blum U., Buitrago-Tellez C., Mundinger A., Krause T., Laubenberger J., Vaith P., Peter H. H., Langer M. Magnetic resonance imaging (MRI) for detection of active sacroiliitis--a prospective study comparing conventional radiography, scintigraphy, and contrast enhanced MRI. J Rheumatol. 1996 Dec;23(12):2107–2115. [PubMed] [Google Scholar]
- Bollow M., Braun J., Hamm B., Eggens U., Schilling A., König H., Wolf K. J. Early sacroiliitis in patients with spondyloarthropathy: evaluation with dynamic gadolinium-enhanced MR imaging. Radiology. 1995 Feb;194(2):529–536. doi: 10.1148/radiology.194.2.7824736. [DOI] [PubMed] [Google Scholar]
- Braun J., Bollow M., Eggens U., König H., Distler A., Sieper J. Use of dynamic magnetic resonance imaging with fast imaging in the detection of early and advanced sacroiliitis in spondylarthropathy patients. Arthritis Rheum. 1994 Jul;37(7):1039–1045. doi: 10.1002/art.1780370709. [DOI] [PubMed] [Google Scholar]
- Braun J., Bollow M., Neure L., Seipelt E., Seyrekbasan F., Herbst H., Eggens U., Distler A., Sieper J. Use of immunohistologic and in situ hybridization techniques in the examination of sacroiliac joint biopsy specimens from patients with ankylosing spondylitis. Arthritis Rheum. 1995 Apr;38(4):499–505. doi: 10.1002/art.1780380407. [DOI] [PubMed] [Google Scholar]
- Braun J., Bollow M., Remlinger G., Eggens U., Rudwaleit M., Distler A., Sieper J. Prevalence of spondylarthropathies in HLA-B27 positive and negative blood donors. Arthritis Rheum. 1998 Jan;41(1):58–67. doi: 10.1002/1529-0131(199801)41:1<58::AID-ART8>3.0.CO;2-G. [DOI] [PubMed] [Google Scholar]
- Braun J., Bollow M., Seyrekbasan F., Häberle H. J., Eggens U., Mertz A., Distler A., Sieper J. Computed tomography guided corticosteroid injection of the sacroiliac joint in patients with spondyloarthropathy with sacroiliitis: clinical outcome and followup by dynamic magnetic resonance imaging. J Rheumatol. 1996 Apr;23(4):659–664. [PubMed] [Google Scholar]
- Braun J., Sieper J. The sacroiliac joint in the spondyloarthropathies. Curr Opin Rheumatol. 1996 Jul;8(4):275–287. doi: 10.1097/00002281-199607000-00003. [DOI] [PubMed] [Google Scholar]
- Calin A., Porta J., Fries J. F., Schurman D. J. Clinical history as a screening test for ankylosing spondylitis. JAMA. 1977 Jun 13;237(24):2613–2614. [PubMed] [Google Scholar]
- Dougados M., van der Linden S., Juhlin R., Huitfeldt B., Amor B., Calin A., Cats A., Dijkmans B., Olivieri I., Pasero G. The European Spondylarthropathy Study Group preliminary criteria for the classification of spondylarthropathy. Arthritis Rheum. 1991 Oct;34(10):1218–1227. doi: 10.1002/art.1780341003. [DOI] [PubMed] [Google Scholar]
- Maugars Y., Mathis C., Berthelot J. M., Charlier C., Prost A. Assessment of the efficacy of sacroiliac corticosteroid injections in spondylarthropathies: a double-blind study. Br J Rheumatol. 1996 Aug;35(8):767–770. doi: 10.1093/rheumatology/35.8.767. [DOI] [PubMed] [Google Scholar]
- Sieper J., Braun J. Pathogenesis of spondylarthropathies. Persistent bacterial antigen, autoimmunity, or both? Arthritis Rheum. 1995 Nov;38(11):1547–1554. doi: 10.1002/art.1780381105. [DOI] [PubMed] [Google Scholar]
- van der Linden S., Valkenburg H. A., Cats A. Evaluation of diagnostic criteria for ankylosing spondylitis. A proposal for modification of the New York criteria. Arthritis Rheum. 1984 Apr;27(4):361–368. doi: 10.1002/art.1780270401. [DOI] [PubMed] [Google Scholar]


