Abstract
Human low density lipoproteins (LDL) are the major cholesterol carriers in the blood. Elevated concentration of LDL is a major risk factor for atherosclerotic disease. Purified LDL particles appear heterogeneous in images obtained with a 400-kV electron cryomicroscope. Using multivariate statistical and cluster analyses, an ensemble of randomly oriented particle images has been subdivided into homogeneous subpopulations, and the largest subset was used for three-dimensional reconstruction. In contrast to the general belief that below the lipid phase-transition temperature (30°C) LDL are quasi-spherical microemulsion particles with a radially layered core-shell organization, our three-dimensional map shows that LDL have a well-defined and stable organization. Particles consist of a higher-density outer shell and lower-density inner lamellae-like layers that divide the core into compartments. The outer shell consists of apolipoprotein B-100, phospholipids, and some free cholesterol.
Keywords: apolipoprotein B-100, lipid, statistical image analysis, angular reconstitution
An elevated level of low density lipoproteins (LDL) in the circulation is one of the major risk factors for atherosclerosis and coronary artery disease. Various studies show that genetic defects associated with the LDL receptor greatly increase LDL levels in homozygous individuals to produce severe coronary artery disease and early death (1). The mechanisms by which LDL cause disease are unknown. A detailed understanding of the supramolecular structure of LDL will contribute greatly to elucidating the pathobiology associated with elevated LDL levels.
LDL (≈2.5 MDa) are one type of several spherical particles that transport lipids in the blood. The only protein component of LDL is apolipoprotein B-100 (apoB-100), one of the largest known proteins (4,536 aa, ca. 550 kDa) (2, 3). The apoB-100-containing lipoproteins are secreted from the liver as triglyceride-rich, very LDL (VLDL), which are converted in the blood circulation to LDL (4). LDL, about 220 Å in diameter, are much smaller in size than the originally secreted VLDL, which range from 600 to 800 Å. LDL contain 22% apoB-100, 22% phospholipids, 8% cholesterol, 42% cholesteryl esters, and 6% triglycerides (wt/wt). Structural studies (4–14) of LDL indicate a range of particle sizes (180–250 Å). This variation has been attributed to the differences in lipid content of LDL (5–8). Subfractions of LDL, characterized by variations in density, size, and chemical composition of particles, are assuming important clinical significance (15). A predominance of small, dense LDL particles is associated with an increased risk of coronary heart disease and is an integral feature of the insulin resistance syndrome (16).
The structure of LDL has been intriguing for decades (4, 6, 9, 13, 14). Several models that have been suggested are based on electron microscopy of negatively stained specimens, small-angle x-ray and neutron scattering. However, none of the proposed LDL models have been based on actual three-dimensional (3D) reconstruction. Most of the models have been built around the conceptual framework of a microemulsion model (4). A phase transition in LDL was observed by differential scanning calorimetry and x-ray and neutron solution scattering at a temperature in the range of 15 to 30°C (17–22). The transition was associated with a liquid-crystalline, order–disorder phase change of cholesterol esters within the particles. Below the transition temperature, in “solid state,” a 1/36-Å−1 reflection was observed in x-ray and neutron solution-scattering experiments attributed to liquid-crystalline cholesteryl esters in the core (17–19, 23). Based on that, a concentric spherical shell model of the LDL was suggested. Unfortunately, there was no direct experimental observation of such structural organization in the LDL’s core. Although in several cases (7, 10–12, 24) distinct structural features were observed in LDL images, these observations have not yielded a definitive 3D model. Two groups (25, 26) have been able to crystallize the LDL; that, by itself, was an indication that LDL have a stable shape. Unfortunately, the crystals obtained did not diffract beyond 30 Å and did not give further structural details yet.
Some of the difficulties in determining a 3D structure of LDL could be caused by their size heterogeneity (15). In the present work we used statistical methods to analyze the extent of heterogeneity in the images of frozen, hydrated LDL, and to select a structurally homogeneous subpopulation of LDL from the ensemble of images in electron micrographs. Selected data were, by far, the most abundant species in the ensemble (≈70% of all LDL present in micrographs). This approach allowed us to calculate the 3D reconstruction of LDL by the angular reconstitution technique (27). In this study, LDL particles were kept at 4°C before the quick freezing for electron cryomicroscopy. The structure of LDL determined from these preparations should represent their conformation below the phase-transition temperature. A typical temperature at which many biochemical studies have been carried out is 4°C (28, 29).
MATERIALS AND METHODS
Blood samples were drawn from a healthy male volunteer who had fasted overnight. The blood was collected in tubes containing 1 mg/ml Na2EDTA and centrifuged at 4°C at 2,500 rpm for 20 min. Aprotinin (0.55 units/ml), sodium azide (0.025% wt/vol), and EDTA (0.06% wt/vol) were added to plasma immediately after collection. Before centrifugation, the concentration of aprotinin was increased to 10,000 units/ml. The density of plasma sample was adjusted to 1.386 by addition of NaBr. The resulting sample was overlaid successively with 3.8, 3.3, and 0.5 ml of NaBr solution containing 10% EDTA with a density of 1.063, 1.019, and 1.006, respectively. Tubes were centrifuged at 40,000 rpm for 22 h at 20°C in a SW-40 rotor. One-half-milliliter samples were collected from the top. The fractions of LDL were pooled and dialyzed against saline, pH 7.4, containing 1 mM EDTA and 0.02% NaN3. To obtain a better homogeneity of the preparation, we used fractions 3–5 of the LDL peak from the gradient centrifugation. Samples were stored at 4°C under nitrogen atmosphere for no longer than a week before electron cryomicroscopy.
LDL were embedded in vitreous ice over holes on a carbon film with holes in it. This preparation technique (30) preserved both the native environment of LDL and various orientations of particles. The frozen, hydrated specimen was held at −167°C in a JEOL 4000EX electron microscope operated at 400 kV. Low-dose imaging was done by using a standard technique (31, 32). Images were taken at a microscope magnification of ×40,000.
Selected micrographs were digitized on a Perkin–Elmer 1010M microdensitometer with a sampling grid corresponding to 6.25 Å on the specimen. Defocus values were determined from the positions of contrast transfer function (CTF) zeroes seen in the incoherently averaged spectra of the images from each micrograph (33). For structural analysis, five micrographs of the LDL were selected that had defocus values ranging from 1.5 to 2.5 μm. The first zero of the CTF, even for 2.5-μm defocus images, was at ≈20-Å resolution, which is well beyond the targeted 27-Å reconstruction resolution. The CTF was corrected by using a Wiener filter with a 10% of amplitude contrast (34–37). No phase corrections were applied because the reconstruction was carried out at a resolution within the first CTF zero. The main effect of the correction was to boost low spatial frequencies, which has led to better correspondence of the reconstruction to the total mass of the LDL.
Image analysis was performed by using the imagic-5 software package (38). LDL images were selected interactively in the digitized images and extracted into fields of 64×64 pixels. The data set was processed according to a procedure described previously (39).
Several characteristic views having low error in the angular search were selected for the preliminary 3D reconstruction. The angular reconstitution technique was used for a search of the mutual orientations of the characteristic views. Owing to the asymmetry of LDL, their independent orientations occupy a full Euler sphere, with 0° < β < 180° (declination with respect to the vertical axis Z); and 0° < γ < 360° (rotation around the vertical axis Z). 3D maps were calculated by using the exact filter back-projection algorithm (40, 41).
To estimate the quality of the final 3D reconstruction, the data set was subdivided into two equally populated subsets. The images from these subsets were processed separately, and two independent 3D maps were generated. The resolution was assessed by Fourier shell correlation between the three-dimensional Fourier transforms of these reconstructions (42). Furthermore, the sampling of the Euler sphere by the data is adequate for 27-Å resolution. The variance map was calculated from error images, which were obtained by comparing the class averages with the reprojected images from the reconstruction (43).
RESULTS
We have used an intermediate voltage electron cryomicroscope to image the ice-embedded LDL. Several types of LDL particles with different sizes and different structural motifs can be identified as highlighted in Fig. 1.
Figure 1.
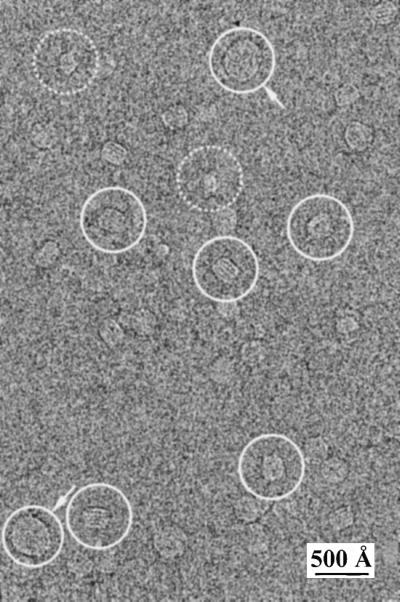
An example of a 400-kV electron image of ice-embedded LDL particles. Solid circles indicate LDL with three striations. Similar images have been observed previously (10, 12). Broken circles indicate smaller LDL; circles with arrows indicate large LDL.
We extracted ≈5,600 single LDL images from five micrographs. As the first step in image processing, they were aligned and grouped into 60 classes by using multivariate statistical analysis and classification (44, 45). The class averages varied in size and appearance (Fig. 2). Some were round and showed no striations (Fig. 2 Right) whereas others were elongated with striations (Fig. 2 Left). In the latter case, the number of striations varied from two to six and the particle’s width increased with that number. The width appeared to vary incrementally at steps of 30–35 Å. The diameter of rounded LDL images also varied with the same increment (Fig. 2 Right). Examining closely the classes with striations, we found that the one with three striations had the largest number of members. Therefore, we selected for further analysis all raw LDL images from classes with class average sizes within the minimal and maximal axial dimensions of the three-striated LDL. This data subset comprised ≈4,000 three-striated and oval-shaped images and represented ≈70% of the originally selected LDL images. This multivariate statistical-based selection corresponded to a “computational purification” of the specimen to a higher structural homogeneity.
Figure 2.
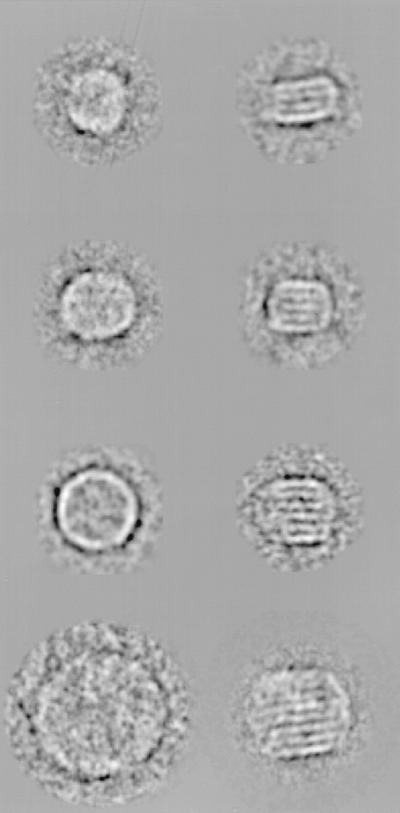
Example of class averages from original LDL data set after the first round of alignment and classification, exhibiting different sizes, shapes, and features.
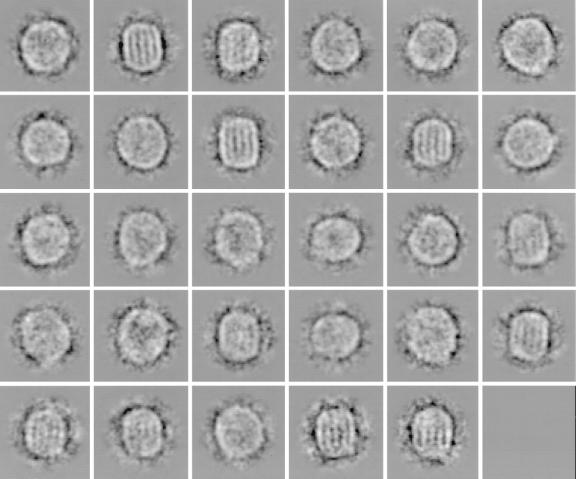
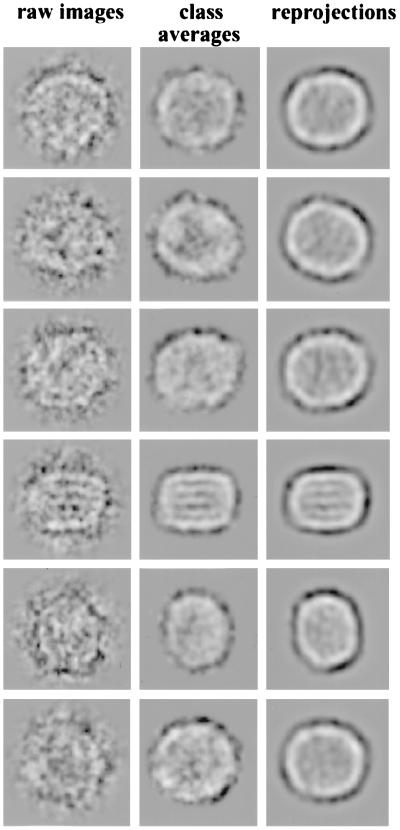
As the next step, we analyzed this selected data subset by an iterative multireference alignment and finer classification (39) to obtain different representative views of the LDL. Around 50 classes (of the final 200) with the lowest intraclass variances were taken for the analysis of 3D consistency by using the angular reconstitution technique (27, 39). The 29 views (Fig. 3) with the lowest SD among the peak heights at the search for the relative orientation were used for the first 3D reconstruction. The 4,000-image subset was subjected to a model-based iterative alignment and orientation refinement (39). Finally, ≈2,600 particles in 129 classes were used to compute the final 3D map. The reprojected images of the final 3D map, corresponding class averages, and original images are similar, as shown in Fig. 4. The cross-correlation coefficient between class averages used for the reconstruction and reprojected images was above 0.78. According to the Fourier shell correlation function (42) and the angular distribution of the class averages, the 3D reconstruction has an isotropic resolution of ≈27 Å.
Figure 3.
Twenty-nine classes used for first 3D reconstruction of the LDL after selection of the images of the homogeneous subpopulation of particles. Each class contains 10–20 individual images.
Figure 4.
Similarity of raw images, final class averages, and corresponding reprojections from the final 3D map. This demonstrates the consistency of the image reconstruction.
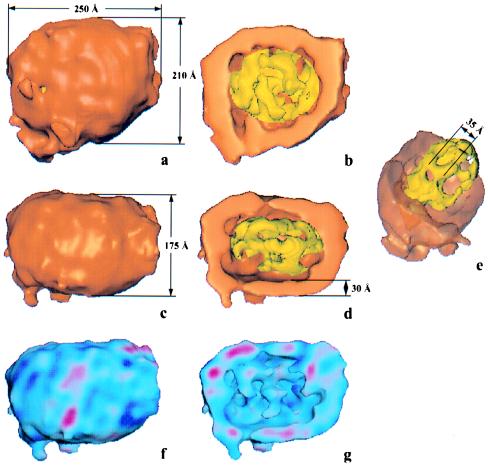
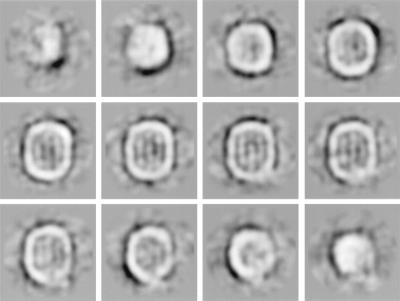
The 3D map and its cutaway views in two orthogonal views are shown in Fig. 5 a–e. The overall shape can be described as an ellipsoid with dimensions of 250 × 210 × 175 Å (Fig. 5 a and c). The shell (orange) and a core with an organized three-layer internal structure (yellow) are the two principal features in the reconstruction. The core has four major lower-density compartments separated by a network of higher-density protrusions forming fenestrated “internal walls.” Taken together these features explain the origin of the three striations in the images (Fig. 5 b, d, and e). The distance between the “walls” is ≈35 Å. The set of parallel sections through the 3D map (Fig. 6) also clearly shows the particle’s 20- to 30-Å thick shell and the core with four compartments. The higher density of the particle’s shell compared with the core partitions is easy to trace through the whole map. The variance map of the reconstruction is shown in Fig. 5 (f and g). Blue regions show stable parts of the 3D map, and red color demonstrates more flexible parts of the structure. The shell has a higher density compared with the core walls (Fig. 6). It is known that the outer LDL shell consists of apoB-100, phospholipids, and some free cholesterol. Apolar lipids are concentrated mainly in the core. This is consistent with the lower density of the “walls” separating the core into compartments although our current subdivision of the map into the shell and core is purely structural and is not related to the chemical composition of the particles.
Figure 5.
3D map of the LDL. (a and c) Overall shape of LDL in two orthogonal orientations. (b and d) Corresponding cutaway views of the particle revealing the 30-Å-thick outer shell (orange) and inner core structure (yellow). (e) The shell is made semitransparent to reveal the inner core structure. The yellow layers are projected as striations in this orientation (compare Figs. 2 and 3). (f and g) The variance map of the reconstruction. Blue color represents low variance and red represents higher variance of the 3D map. Both the shell and the core are mostly blue, suggesting the stability of the LDL structure.
Figure 6.
Set of consecutive sections through the final 3D map. Clear division of the LDL to the shell and core can be seen. The shell has a higher density compared with the core and is ≈20–30 Å in thickness. Three vertical “walls” in the core can be followed through the whole map.
DISCUSSION
For many years LDL structure determination was considered to be a practically intractable problem in structural biology. The heterogeneity of the LDL preparations (15) and the absence of symmetry in 3D organization have made it difficult to analyze the structure by the commonly used structural techniques. Fig. 1 clearly shows size and feature heterogeneity in the ice-embedded specimens as observed previously (10–12). We therefore used a computational procedure to extract LDL with the same structure out of a heterogeneous ensemble.
It is well documented that LDL are not “pancakes” or extended “sticks” with high axial dimension ratios, but are roughly spherical particles with different sizes (5–14). The common belief has been that the size distribution of LDL particles is continuous. However, our statistical analysis showed that particles have discrete variations in sizes and several motifs (Fig. 2). This suggested that LDL can have discrete structures, and our first attempt was to analyze the most abundant one (i.e., three-striated and their size-related particles). The particles with two or four striations could not belong to the same structure as the three-striated ones because of the discrete differences in size. The same is true for the rounded particles (Fig. 2). Fig. 3 demonstrates the size consistency of our selected image subset of 4,000 particles.
The critical factor in our analysis is the reliability of our sorting the particles with the same structure before 3D reconstruction. We used several criteria to validate our approach. The size variations of the LDL occur in discrete steps, and the particles have almost equidimensional shape (5–8). Under these conditions, image selection of a structurally homogeneous subpopulation out of the pool of LDL images can be made by using multivariate statistical analysis and automatic classification (39). The self-consistency examination of the selected data subset of 4,000 particles, which consisted of three-striated and related LDL images, was performed by using the angular reconstitution procedure (27, 39). If the particles (e.g., Fig. 3) were structurally unrelated, the SD of peaks found in the search of the orientation parameters would have increased when more class averages were added in a stepwise manner. Moreover, if the representative views were not consistent with the structure, the reconstructed map would have been blurred, and its reprojections would not have exhibited significant similarity to the original projections. We have observed a good correspondence between the reprojections and class averages (Fig. 4). For instance, the difference between the reprojections of the reconstruction and the final 129 classes used in the reconstruction on average was less than 22%. In addition, the improvement of the overall quality of the reconstruction (reflected in the contrast gain) with an increasing number of classes used (from the initial 29 to the final 129) corroborates the convergence of the procedure.
Our reconstruction shows that LDL are not merely quasi-spherical microemulsions as generally believed. Previously, Luzzati et al. (14) proposed an LDL model with tetrahedral symmetry. On the contrary, our analysis has not revealed any internal symmetry of the particles. Our reconstruction clearly shows that LDL at lower than transition temperatures (4°C) have an oval shape with a specific internal structure consisting of several compartments.
Based on biochemical studies on accessibility of apoB-100 to protease digestion (46), mAb binding to apoB-100 (7, 47), and x-ray small-angle scattering (9), the outer shell of the particle (depicted in orange in Fig. 6) most probably is formed by apoB-100 and phospholipids may be with some free cholesterol. The core is likely to be composed of apolar lipids. The observed periodicity of 1/36 Å−1 (17, 19, 23) now could be reinterpreted in terms of lamellar core organization.
The most novel aspect of our reconstruction is the structural organization in the core region of the LDL. Though the chemical composition of the internal features has not yet been established, the compartments could be formed either by phase-separated, ordered lipids with membrane-like structure or by protein intrusions. The interwall distances in the core are close to that of typical membrane thickness (30–35 Å), which supports the idea of ordered lipids forming the protrusions (12, 19). Alternatively, the protrusions can be composed of apoB-100 protein and lipids because the image contrast appears to be higher than that of a lipid alone (48). Although the core looks “empty” in the surface-rendered representation shown in the Fig. 6, it actually is filled by lipids: cholesteryl esters and triglycerides. They have lower density, which is seen in Fig. 6. Our structure is consistent with magnetic resonance imaging of apoB-100 (13), which showed that apoB-100 can constrain the motion of the core cholesteryl esters.
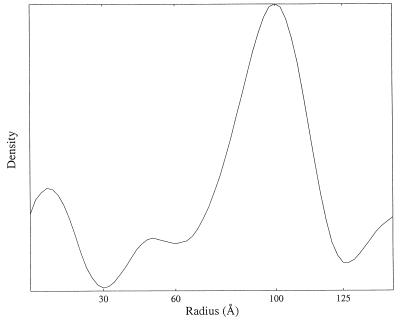
Laggner and Müller (9) proposed a model of the internal structure of LDL based on small-angle x-ray scattering data. The model consists of concentric shells of cholesteryl esters and triglycerides in a core, surrounded by a surface monolayer containing phospholipids, free cholesterol, and apoB-100. Radial mass distribution in our model (Fig. 7) also shows several peaks, which result from spherical averaging of the higher-density striations in the core of the LDL. This calculation accounts for their observations, but our structure does not support their model based on one-dimensional scattering curve.
Figure 7.
Radial density distribution simulated by spherical averaging of our 3D map. The density distribution is in agreement with that derived previously from a solution x-ray-scattering experiment (9).
In the recent work of Pregetter et al. (21), a “condensation” of the lipids into ordered state below the transition temperature was suggested in the LDL’s core. That order and phase separation was interpreted in the framework of the old concentric shell LDL model and led to a refined model within the same framework. Other studies (17, 19, 23) also suggested ordering of the lipids below transition temperature. Our LDL structure was determined below the transition temperature, and, therefore, it is likely that at least cholesterol and/or cholesteryl esters are in phase-separated ordered state. It is direct structural evidence of phase separation in the lipid core and gives a different interpretation to the previously published results and suggests the prospect for further, more detailed studies of LDL in different physicochemical states.
A striking feature in some of our LDL images is the presence of striations (Fig. 1), which also have been seen by others (10, 12) and interpreted as surface wrinkles. However, it is evident from our 3D structure that striations result from the core compartments projected in certain directions (Fig. 4). In contrast to another cryomicroscopy study of LDL (10), we did not observe any discoidal-shaped particles in our images.
The images with four- and two-striated and related-in-size particles were excluded from the 3D analysis. They may correspond to subfractions of LDL, characterized by variations in density, size, and chemical composition of LDL particles, that have important metabolic and clinical significance (15). These particles could be subjected to similar analysis when a larger data set is obtained.
CONCLUSIONS
The 3D structure of the LDL at 27-Å resolution was determined from electron images of the frozen hydrated particles. The most important step in our analysis was the use of statistical methods to identify a subset of structurally homogeneous LDL particles from a larger pool of particles with heterogeneous sizes and features. We used the angular reconstitution to determine the 3D structure from this subset comprised 70% of raw LDL images. The self-consistency tests of the data during various steps of computational analysis and agreement of our 3D map with previous observations by using different biophysical and biochemical techniques support the reliability of our structure. In contrast to the belief that the structure of LDL particles below the transition temperature can be represented by a quasi-spherical, layered core-shell structure, our 3D map shows lamellar organization of the lipid core in an oval, flattened particles. Our reconstruction did not detect any internal symmetry of the LDL. The apolar lipid layers evidently are stabilized by the outer wrapping, consisting of apolipoprotein B and phospholipids. Our study has demonstrated the advantage of using the electron cryomicroscopy combined with computational analysis to determine the 3D structure of a homogeneous subset of intrinsically heterogeneous biological assemblies such as LDL.
Acknowledgments
We appreciate the comments of Michael F. Schmid, Henry Pownall, Amy McGough, B. V. V. Prasad, and L. A. Smith. We thank the Abercrombie Foundation, Robert Welch Foundation, the National Institutes of Health, and National Science Foundation for support.
ABBREVIATIONS
- LDL
low density lipoprotein
- 3D
three dimensional
References
- 1.Goldstein J L, Hobbs H H, Brown M S. In: Familial Hypercholesterolemia in Lipoprotein and Lipid Metabolism Disorders. Scriver C R, Beaudet A L, Sly W S, Valle D, editors. Vol. 2. New York: McGraw–Hill; 1995. pp. 1981–2030. [Google Scholar]
- 2.Yang C Y, Chen S H, Gianturco S H, Bradley W A, Sparrow J T, Tanimura M, Li W H, Sparrow D A, DeLoof H, Rosseneu M, et al. Nature (London) 1986;323:738–742. doi: 10.1038/323738a0. [DOI] [PubMed] [Google Scholar]
- 3.Knott T J, Pease R J, Powell L M, Wallis S C, Rall J, Innerarity T L, Blackhart B, Taylor W H, Marcel Y, Milne R, et al. Nature (London) 1986;323:734–738. doi: 10.1038/323734a0. [DOI] [PubMed] [Google Scholar]
- 4.Havel R J, Kane J P. In: The Metabolic and Molecular Bases of Inherited Disease. 7th Ed. Scriver C R, Beaudet A L, Sly W S, Valle D, editors. Vol. 2. New York: McGraw–Hill; 1995. pp. 1841–1851. [Google Scholar]
- 5.Laggner P. In: Low Density Lipoproteins. Day C E, Levy R S, editors. New York: Plenum; 1976. pp. 49–69. [Google Scholar]
- 6.Gulik-Krzywicki T, Yates M, Aggerbeck L P. J Mol Biol. 1979;131:475–484. doi: 10.1016/0022-2836(79)90003-2. [DOI] [PubMed] [Google Scholar]
- 7.Chatterton J E, Phillips M L, Curtiss L K, Milne R, Fruchart J-C, Schumaker V N. J Lipid Res. 1995;36:2027–2037. [PubMed] [Google Scholar]
- 8.Myant N B. Cholesterol Metabolism, LDL, and the LDL Receptor. New York: Academic; 1990. [Google Scholar]
- 9.Laggner P, Müller K W. Q Rev Biophys. 1978;11:371–425. doi: 10.1017/s0033583500002304. [DOI] [PubMed] [Google Scholar]
- 10.van Antwerpen R, Gilkey J C. J Lipid Res. 1994;35:2223–2231. [PubMed] [Google Scholar]
- 11.van Antwerpen R, Chen G C, Pullinger C R, Kane J P, LaBelle M, Krauss R M, Luna-Chavez C, Forte T M, Gilkey J C. J Lipid Res. 1997;38:659–669. [PubMed] [Google Scholar]
- 12.Spin J M, Atkinson D. Biophys J. 1995;68:2115–2123. doi: 10.1016/S0006-3495(95)80392-9. [DOI] [PMC free article] [PubMed] [Google Scholar]
- 13.Lund-Katz S, Phillips M C. Biochemistry. 1986;25:1562–1568. doi: 10.1021/bi00355a016. [DOI] [PubMed] [Google Scholar]
- 14.Luzzati V, Tardieu A, Aggerbeck L P. J Mol Biol. 1979;131:435–473. doi: 10.1016/0022-2836(79)90002-0. [DOI] [PubMed] [Google Scholar]
- 15.Austin M A, Hokanson J E, Brunzell J D. Curr Opin Lipidol. 1994;5:395–403. doi: 10.1097/00041433-199412000-00002. [DOI] [PubMed] [Google Scholar]
- 16.Reaven G M. Physiol Rev. 1995;75:473–486. doi: 10.1152/physrev.1995.75.3.473. [DOI] [PubMed] [Google Scholar]
- 17.Deckelbaum R J, Shipley G G, Small D M, Lees R S, George P K. Science. 1975;190:392–394. doi: 10.1126/science.170681. [DOI] [PubMed] [Google Scholar]
- 18.Deckelbaum R J, Shipley G G, Small D M. J Biol Chem. 1977;252:744–754. [PubMed] [Google Scholar]
- 19.Atkinson D, Deckelbaum R J, Small D M, Shipley G G. Proc Natl Acad Sci USA. 1977;74:1042–1046. doi: 10.1073/pnas.74.3.1042. [DOI] [PMC free article] [PubMed] [Google Scholar]
- 20.Laggner P, Degovics G, Muller K W, Glatter O, Kratky O, Kostner G, Holasek A. Hoppe-Seylers Z Physiol Chem. 1977;358:771–778. doi: 10.1515/bchm2.1977.358.2.771. [DOI] [PubMed] [Google Scholar]
- 21.Pregetter M, Prassl R, Schuster B, Kriechbaum M, Nigon F, Chapman J, Laggner P. J Biol Chem. 1999;274:1334–1341. doi: 10.1074/jbc.274.3.1334. [DOI] [PubMed] [Google Scholar]
- 22.Sklar L A, Craig I F, Pownall H J. J Biol Chem. 1981;256:4286–4292. [PubMed] [Google Scholar]
- 23.Laggner P. In: Modern Aspects of Small-Angle Scattering. Brumberger H, editor. Boston: Kluwer; 1995. pp. 371–386. [Google Scholar]
- 24.Chatterton J E, Phillips M L, Curtiss L K, Milne R W, Marcel Y L, Schumaker V N. J Biol Chem. 1991;266:5955–5962. [PubMed] [Google Scholar]
- 25.Prassl R, Chapman J M, Nigon F, Sara M, Eschenburg S, Betzel C, Saxena A, Laggner P. J Biol Chem. 1996;271:28731–28733. doi: 10.1074/jbc.271.46.28731. [DOI] [PubMed] [Google Scholar]
- 26.Ritter S, Frey I, Diederichs K, Grathwohl D, Keul J, Baumstark M W. Proteins. 1997;28:293–297. [PubMed] [Google Scholar]
- 27.van Heel M. Ultramicroscopy. 1987;21:111–124. doi: 10.1016/0304-3991(87)90078-7. [DOI] [PubMed] [Google Scholar]
- 28.Goldstein J L, Basu S K, Brown M S. Methods Enzymol. 1983;98:241–260. doi: 10.1016/0076-6879(83)98152-1. [DOI] [PubMed] [Google Scholar]
- 29.Pullinger C R, Gaffney D, Gutierrez M M, Malloy M J, Schumaker V N, Packard C J, Kane J P. J Lipid Res. 1999;40:318–327. [PubMed] [Google Scholar]
- 30.Dubochet J, Adrian M, Chang J J, Homo J C, Lepault J, McDowall A W, Schultz P. Q Rev Biophys. 1988;21:129–228. doi: 10.1017/s0033583500004297. [DOI] [PubMed] [Google Scholar]
- 31.Sherman M B, Brink J, Chiu W. Micron. 1996;27:129–139. doi: 10.1016/0968-4328(96)00018-2. [DOI] [PubMed] [Google Scholar]
- 32.Jeng T W, Chiu W. J Mol Biol. 1983;164:329–346. doi: 10.1016/0022-2836(83)90080-3. [DOI] [PubMed] [Google Scholar]
- 33.Zhou Z H, Hardt S, Wang B, Sherman M B, Jakana J, Chiu W. J Struct Biol. 1996;116:216–222. doi: 10.1006/jsbi.1996.0033. [DOI] [PubMed] [Google Scholar]
- 34.Zhu J, Penczek P A, Schroder R, Frank J. J Struct Biol. 1997;118:197–219. doi: 10.1006/jsbi.1997.3845. [DOI] [PubMed] [Google Scholar]
- 35.Toyoshima C, Unwin P N T. Ultramicroscopy. 1988;25:279–292. doi: 10.1016/0304-3991(88)90003-4. [DOI] [PubMed] [Google Scholar]
- 36.Smith M F, Langmore J P. J Mol Biol. 1992;226:763–774. doi: 10.1016/0022-2836(92)90631-s. [DOI] [PubMed] [Google Scholar]
- 37.Thuman-Commike P A, Tsuruta H, Greene B, Prevelige P E, King J, Chiu W. Biophys J. 1999;76:2249–2261. doi: 10.1016/S0006-3495(99)77381-9. [DOI] [PMC free article] [PubMed] [Google Scholar]
- 38.van Heel M, Harauz G, Orlova E V, Schmidt R, Schatz M. J Struct Biol. 1996;116:17–24. doi: 10.1006/jsbi.1996.0004. [DOI] [PubMed] [Google Scholar]
- 39.Serysheva I I, Orlova E V, Chiu W, Sherman M B, Hamilton S L, van Heel M. Nat Struct Biol. 1995;2:18–24. doi: 10.1038/nsb0195-18. [DOI] [PubMed] [Google Scholar]
- 40.Radermacher M. J Electron Microsc Technol. 1988;9:359–394. doi: 10.1002/jemt.1060090405. [DOI] [PubMed] [Google Scholar]
- 41.Harauz G, van Heel M. Optik. 1986;73:146–156. [Google Scholar]
- 42.van Heel M. Ultramicroscopy. 1987;21:95–100. doi: 10.1016/0304-3991(87)90078-7. [DOI] [PubMed] [Google Scholar]
- 43.Haley D A, Horwitz J, Stewart P L. J Mol Biol. 1998;277:27–35. doi: 10.1006/jmbi.1997.1611. [DOI] [PubMed] [Google Scholar]
- 44.van Heel M, Frank J. Ultramicroscopy. 1981;6:187–194. doi: 10.1016/0304-3991(81)90059-0. [DOI] [PubMed] [Google Scholar]
- 45.Frank J. Three-Dimensional Electron Microscopy of Macromolecular Assemblies. New York: Academic; 1995. [Google Scholar]
- 46.Goormaghtigh E, Cabiaux V, De Meutter J, Rosseneu M, Ruysschaert J M. Biochemistry. 1993;32:6104–6110. doi: 10.1021/bi00074a023. [DOI] [PubMed] [Google Scholar]
- 47.Wiklund O, Dyer C A, Tsao B P, Curtiss L K. J Biol Chem. 1985;260:10956–10960. [PubMed] [Google Scholar]
- 48.Lepault J, Martin F P N. Biochim Biophys Acta. 1985;820:315–318. [Google Scholar]


