

Full Text
The Full Text of this article is available as a PDF (180.0 KB).
Figure 1 .

(A) Tumour at the hard palate of the patient (reddish lesion). (B) Chest x ray in February 1994, showing multiple nodular infiltrates and lymphangiosis. (C) Chest x ray in May 1994, showing resolution of the nodular infiltrates and lymphangiosis.
Figure 2 .
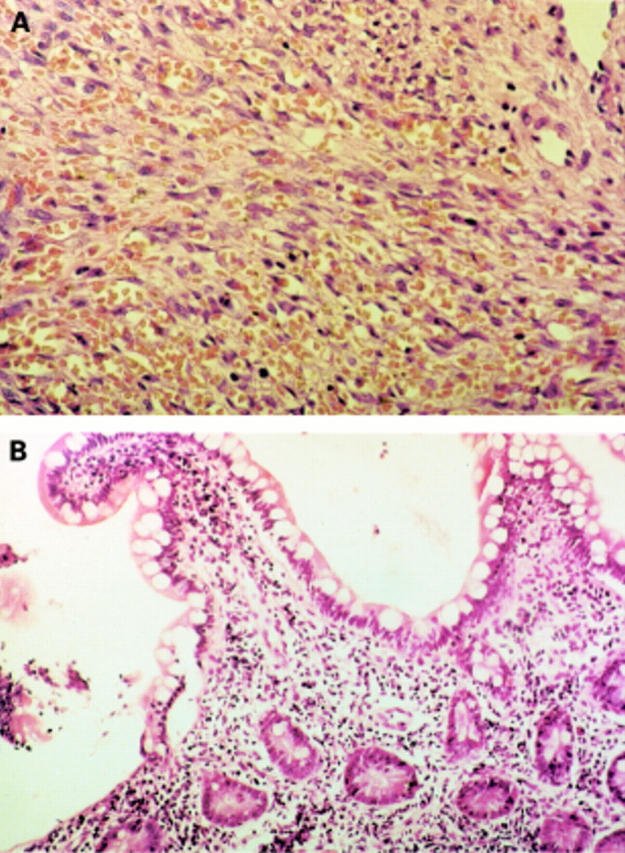
(A) Histology of the lesion from the hard palate, showing features of Kaposi's sarcoma with spindle shaped cells. (B) Histology of the caecum showing unspecific colitis.
Figure 3 .

Polymerase chain reaction (PCR) amplificates are shown by ultraviolet illumination of an ethidium bromide stained 2% agarose gel. Lanes 1-4 show the HCMV-IE gene-specific PCR amplicons obtained with 200 ng DNA extracted from the caecum (lane 1), hard palate (lane 2), negative and positive controls (lanes 3 and 4). Lanes 5-8 represent the HHV8-specific amplicons according to Lin et al.7 The sequence of materials is the same as in lanes 1-4. Lanes 9-12 represent the respective K1 (HHV8-K1)-specific amplicons. M is a PhiX Hae III digested DNA marker. The numbers at the left indicate the respective length of the restriction fragments in base pairs.