
Full Text
The Full Text of this article is available as a PDF (101.6 KB).
Figure 1 .
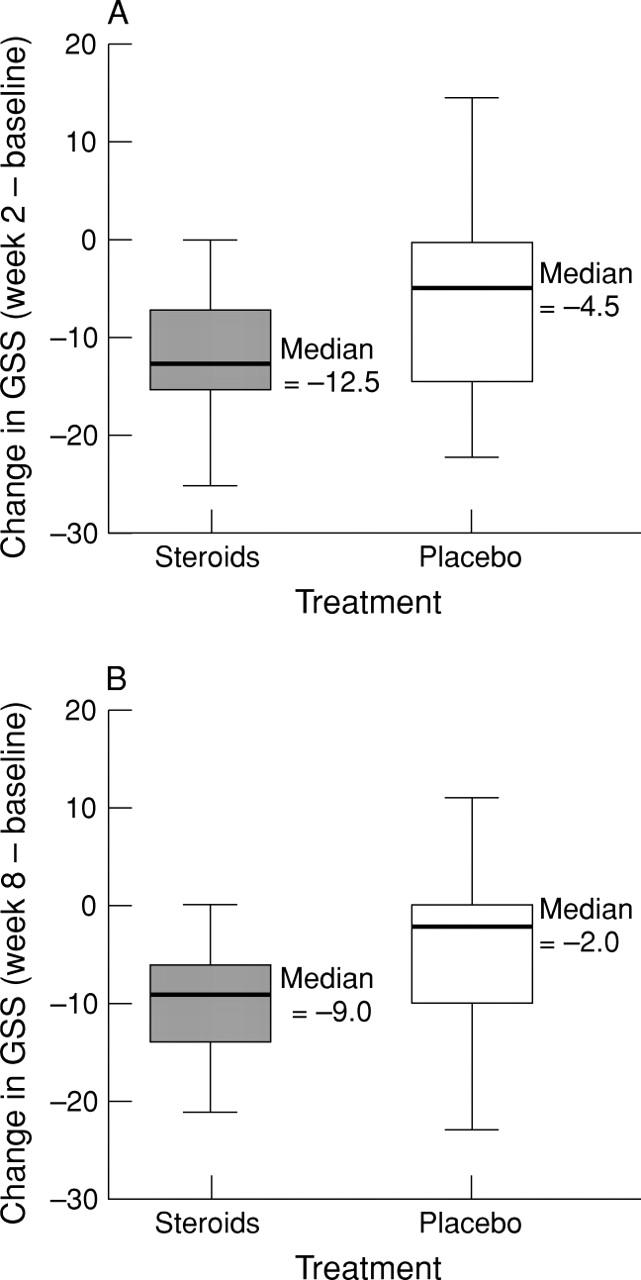
Box plots of changes in global symptom score (GSS) at (A) two weeks and (B) eight weeks.
Official websites use .gov
A
.gov website belongs to an official
government organization in the United States.
Secure .gov websites use HTTPS
A lock (
) or https:// means you've safely
connected to the .gov website. Share sensitive
information only on official, secure websites.

The Full Text of this article is available as a PDF (101.6 KB).
Box plots of changes in global symptom score (GSS) at (A) two weeks and (B) eight weeks.