Abstract
A comprehensive nonredundant database of 475 cocrystallized protein–protein complexes was used to study low-resolution recognition, which was reported in earlier docking experiments with a small number of proteins. The docking program gramm was used to delete the atom-size structural details and systematically dock the resulting molecular images. The results reveal the existence of the low-resolution recognition in 52% of all complexes in the database and in 76% of the 113 complexes with an interface area >4,000 Å2. Limitations of the docking and analysis tools used in this study suggest that the actual number of complexes with the low-resolution recognition is higher. However, the results already prove the existence of the low-resolution recognition on a broad scale.
Protein–protein interactions play a central role in protein function. Because these interactions are determined by the structure of the components that form the complex as well as by the physicochemical properties of the environment, studies of these factors are important for better understanding of protein functions and for the subsequent application of this knowledge to protein engineering and drug design.
Computer modeling makes it possible to perform direct computational experiments to study fundamental principles of protein interactions in a way that often would be impossible in “real” experiments. What is the role of the large-scale structural motifs (e.g., the main-chain fold) in protein recognition? A direct experiment to determine this role would be to eliminate the small, atom-size structural elements and test the recognition properties of the remaining structure. Such an experiment (1–3) is clearly feasible only computationally (in silico). Studies of large-scale recognition factors include correlation of the antigenicity of surface areas with their accessibility to large probes (4), role of the surface clefts (5), automatic binding site identification based on geometric criteria (6, 7), study of the “low-frequency” surface properties (8), and “fuzzy” binding-site descriptors (9, 10). Several protein-recognition techniques use smoothed potential functions (11–14), which effectively are equivalent to the averaging of the contribution of neighboring atoms and, thus, to the “smoothing” of the local structural elements. Studies of protein binding (15, 16) and energy landscapes in protein folding (17) and protein interactions (18, 19) confirm the existence of nonlocal recognition preferences.
Progress in understanding the principles of protein recognition leads to better computational methods for protein docking (20–22). The principal drawback of the existing docking methodologies is sensitivity to structural inaccuracies. One example of such inaccuracies is conformational changes upon the formation of the complex (23, 24). A major obstacle to the docking of protein structures obtained with modeling is significant errors in these structures (25). This aspect is especially important in view of the current progress in genome sequencing. Most of the resulting protein structures will have to be modeled rather than determined experimentally (26). Thus, the structure-based functional studies will require computational techniques capable of docking large numbers of protein models of limited accuracy within reasonable computational time. In short, the docking methods needed for global, genome-scale studies have to be fast and have to tolerate structural inaccuracies on the order of a few angstroms, even at the expense of substantially lower precision in the docking results.
The program gramm (1, 27, 28) has been shown to adequately address these issues in a number of tests (2, 24, 29, 30). The procedure allows docking at variable “resolutions,” depending on the accuracy of the structural components to be docked. The high-resolution docking yields high-precision results and is relatively slow (hours of computational time). The low-resolution docking is fast (several seconds of cpu time) and may tolerate structural inaccuracies on the order of 7 Å, which is a precision characteristic of many protein models (31–33). However, it can predict only complex’s gross features, which may serve as a starting point for a more detailed study. The essence of the procedure is the reduction of protein structures to digitized images on a three-dimensional grid. The structural elements smaller than the step of the grid are not present in the docking. Thus, the procedure provides a convenient tool to eliminate smaller (e.g., atom-size) details. This feature is the source of tolerance to structural inaccuracies. At the same time, it makes possible the study of the role of the low-resolution recognition factors in protein complexes.
The low-resolution recognition was studied earlier with gramm on a limited number of protein complexes (2). The results show the existence of preferences to the correct structure of the complex even at the resolution of 7 Å. The limited number of test cases, however, did not allow broader conclusions to be drawn about the existence of such factors in general.
In the present study, a comprehensive nonredundant database of crystallized protein–protein complexes (I.V. and A. Sali, unpublished data) was used to determine the existence of the low-resolution recognition. This database provided an opportunity for a systematic study of protein recognition by using structural data presently available for this purpose. All details smaller than 7 Å were eliminated from the protein structures. gramm was able to determine the existence of the low-resolution recognition in 52% of the complexes with interface area >1,000 Å2 and in 76% of the complexes with interface area >4,000 Å2. Our inability to detect the low-resolution recognition in the remaining complexes does not mean that these complexes do not have this property. The fact that gramm, like any other procedure, has limited capabilities suggests that the actual percentage of complexes with the low-resolution recognition is higher.
METHODS
The details of the gramm docking approach are described in refs. 1 and 27. The method involves (i) a projection of the two molecules on a three-dimensional grid; (ii) the calculation, using Fourier transformation, of a correlation function that assesses the degree of surface overlap and the penetration on relative shifts of the molecules in three dimensions; and (iii) a scan of the relative orientations of the molecules in three dimensions. The algorithm provides a list of correlation values that indicate the extent of geometric match between the surfaces of the molecules; each of these values is associated with six numbers describing the relative position (translation and rotation) of the molecules. The procedure is thus equivalent to a six-dimensional search but is much faster by design.
The overlap of the molecular images is equivalent to the intermolecular energy E calculated with a step-function potential (14).
 |
where E is the energy, U is the height of the repulsion part of the potential, R is the range of the potential (the grid step), and rij is the distance between atoms i (receptor) and j (ligand). Because the molecules are represented by grid images, no structural details smaller than the step of the grid are taken into account in the calculations. Thus, in the low-resolution docking, a sparse grid with ≈7 Å grid step eliminates all atom-size details.
RESULTS
Database of Complexes.
The database included 475 complexes from the Protein Data Bank (34). A structure was considered a protein–protein complex if it consisted of more than one chain of 30 or more residues. For convenience, the larger and the smaller proteins within a complex were called “receptor” and “ligand,” respectively. The database is nonredundant in that no complex has both the receptor and the ligand homologous to the receptor and the ligand of any other complex in the database. The criterion for the homology was 30% or greater sequence identity. The database had 631 complexes with physical contact between subunits. For the purpose of this study, only 475 complexes with interface area >1,000 Å2 were taken. The protein pairs with smaller interfaces were not considered, in an attempt to minimize the number of complexes that are artifacts of crystallization and thus do not reflect biological functions (35–37).
Docking.
Docking was performed by using gramm at low resolution. The procedure implemented an exhaustive grid search for the ligand–receptor structure matches. The docking parameters were: step of the grid, 6.8 Å; repulsion part of the potential, 6.5; and interval for rotations, 20°. For each complex, the 1,000 lowest-energy matches were analyzed. The values of the parameters were determined earlier (1) as quasi-optimal for the low-resolution docking, based on 10 receptor–ligand complexes. These values were obtained by largely empirical, nonquantitative considerations and were not optimized or modified in any other way for the criteria used in the present study.
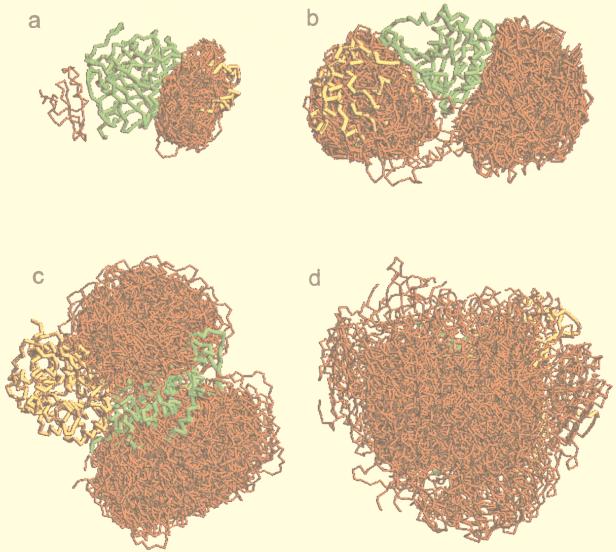
The nature of the gramm approach dictates that all structural details smaller than the grid step (in this study, 6.8 Å) are deleted from the molecular images. It was shown earlier (14) that the difference between the low- and the high-resolution docking is that at high resolution, the low-energy positions of the ligand are dispersed around the receptor (what is usually referred to as “the multiple-minima problem”), whereas at low resolution they tend to cluster in the area of the global minimum (the binding site on the receptor). From the point of view of molecular shape, this effect has to do with smoothing smaller structural details, so that only the larger ones, usually associated with the binding site (e.g., deep cavity in the enzymes active sites) remain and attract ligand matches with different ligand orientation. From the point of view of the intermolecular energy, the transition to lower resolution means an increase in the potential range (14). This leads to a long-range, “mean force” potential that averages the contributions of multiple atoms. The potential corresponds to a smoother energy profile that leaves a smaller number of minima (ideally one), which leads to the clustering of the ligand positions in these minima (at the binding sites). Examples of the actual distribution of the ligand positions are shown in Fig. 1. In many cases, the clustering occurs in the areas that are not identified in the crystal structures as binding sites. Presently, it is not clear whether these clusters correspond to alternative binding sites.
Figure 1.
Examples of the distribution of ligand positions. Receptors are shown in green and ligands in yellow, in the crystallographically determined position within the complex. The 100 lowest-energy ligand positions are shown in red. Matches are clustered primarily inside the binding area (a), inside and outside the binding area (b), outside the binding area (c), and not clustered (d).
Basic Assumptions in the Analysis of the Results.
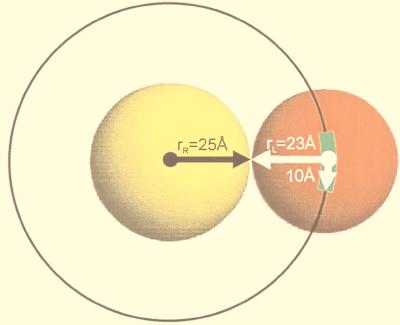
For the analysis of the docking results, we calculated the average distance of each atom from the center of mass for all proteins in the database. These average distances rRi and rLi were considered, respectively, as the “radii” of the receptor and the ligand in the complex i. The average values of such radii for all receptors rR and all ligands rL were 25 Å and 23 Å, respectively (Fig. 2). In this study, for simplicity, we analyzed only the positions of the center of mass of the ligands. The low-resolution binding site on the receptor was defined as the area within 10 Å of the position of the ligand’s center of mass in the crystal structure (Fig. 2).
Figure 2.
Idealized representation of proteins. The receptor is shown in yellow and the ligand in red. Radii are calculated as the average distance of all atoms in a protein from its center of mass. The radii shown are the average radii of all receptors and ligands. The binding region is defined as the area within 10 Å of the crystallographic position of the ligand’s center of mass and is shown in green.
The output of gramm docking is a list of ligand’s positions sorted according to the score of the match. The score is proportional to the surface overlap (1, 27). At the same time, it is equivalent to the intermolecular energy calculated with a simplified potential (14). The basis of the analysis of the docking results was the assumption that if the ligand–receptor recognition exists, the low-energy matches are more populated in the binding site than the would-be random ones, whereas the high-energy matches are distributed randomly regardless of the position of the binding site.
A Trend Toward the Actual Structure of the Complex.
gramm performs an exhaustive grid search, which reports all possible matches (within the accuracy of the grid), and outputs the list of matches sorted by energy. Thus, the evidence that the low-energy matches are better represented in the binding site than the high-energy ones would indicate a preference toward the actual structure of the complex. If the number of matches inside and outside the binding site is nin and nout, respectively, then the low-energy matches in the binding site are represented better than the high-energy ones, if nlin/(nlin + nlout) > nhin/(nhin + nhout), where l is low energy and h is high energy.
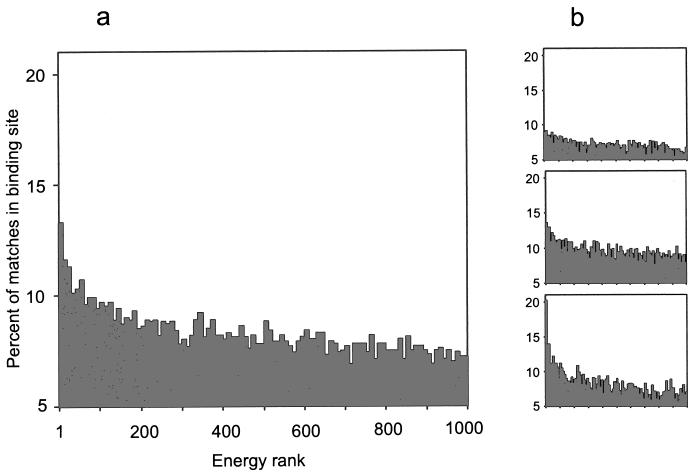
Fig. 3 shows the distribution of the percent of matches in the binding site p = 100 ⋅ nin/(nin + nout) for the entire database, according to the energy of the match. The distribution clearly shows a strong nonlinear correlation of this percent with the energy, resulting in an inside/total ratio of the low-energy matches significantly higher than the inside/total ratio of the high-energy ones. The other conclusion is that this difference in the low-energy and the high-energy matches depends on the area of the interface in the crystal structures (little difference for smaller interfaces and substantially bigger difference for larger interfaces).
Figure 3.
Percent of matches inside the binding area according to the energy rank. The percent is based on the inside/total ratio of the matches of a given rank (see text). Energy rank is accumulated in the histogram in groups of 10. (a) All complexes. (b) Complexes with interface of 1,000–2,000 Å2 (Top), 2,000–4,000 Å2 (Middle), and >4,000 Å2 (Bottom).
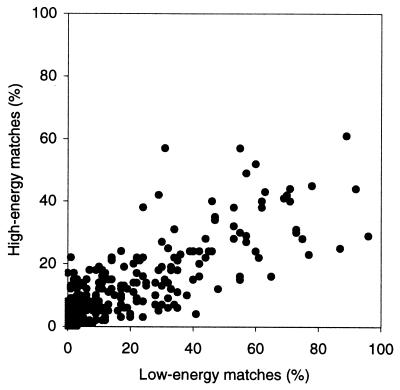
As shown in Fig. 3, the trend to smaller inside/total ratio of the higher-energy matches continues through the entire energy spectrum (only the first 1,000 lowest-energy matches were analyzed for each complex). To assess the difference in the low-energy and the high-energy population objectively, it was useful to find out actually how high the high-energy values are. Fig. 4 shows a significant correlation between pl based on 100 low-energy matches (rank 1–100) and ph based on 100 high-energy matches (rank 901–1,000, highest-energy analyzed). This indicates that for a number of complexes, the highest-energy matches analyzed were still clustered in the binding site. Thus, for such complexes, the rank of the high-energy matches that are supposed to be distributed regardless of the binding site could be well beyond the first 1,000.
Figure 4.
Correlation of the percent of matches inside the binding area of low-energy (rank 1–100) and high-energy (rank 901–1,000) ligand positions. The percent values are calculated for every complex in the database.
The Number of Complexes with Low-Resolution Recognition.
The analysis of total values for the entire database reveals the general character of and trends in the low-resolution recognition. However, it does not answer one of the most intriguing questions, i.e., how many protein complexes follow the low-resolution recognition? Is it a universal feature or does it apply only to some proteins? To address this question, one has to look at the distribution of matches in individual protein complexes. The analysis of individual complexes in this study was based on an assumption that the absence of the low-resolution recognition corresponds to a random distribution of matches in the docking of low-resolution structures. Thus, detecting a significantly higher than the would-be random number of matches in the binding site would indicate the existence of low-resolution recognition.
An important aspect in such analysis is modeling of the random matches. The number of matches analyzed for each complex was 1,000, sorted from low to high energy. As shown above, the highest-energy matches in this list, although distributed with smaller than the low-energy ones inside-binding-site/total ratio, in a number of complexes were still clustered in the binding area. Thus, they cannot be considered random. The option for modeling random matches that was found feasible, although far from being ideal, is based on two assumptions: first, the proteins may be roughly considered as spheres, with the radius equal to the average distance of all atoms from the center of mass (Fig. 2), and second, the random matches are uniformly distributed around the receptor. In such case, the area of the binding site is Sb = π⋅102 (Fig. 2), and the total area available for the matches (a match is positioned in the ligand’s center of gravity) in a complex i is Sti = 4π(rRi + rLi)2. Fig. 2 shows the average values of rRi and rLi. In our analysis, however, these radii were calculated and taken into account individually for each complex. The number of sites with the area equal to that of the binding site is n = Sti/Sb. The probability of K matches in such site (e.g., the binding site) could be approximated by a Poisson distribution (38), with the mean number of matches m = 1,000/n and SD m1/2. The 2-SD confidence interval (≈95% interval) is m ± 2m1/2. Thus, if the actual number of matches in the binding site K is larger than m + 2m1/2, it is significantly larger than the random one and, consequently, the low-resolution recognition was considered detected for this complex.
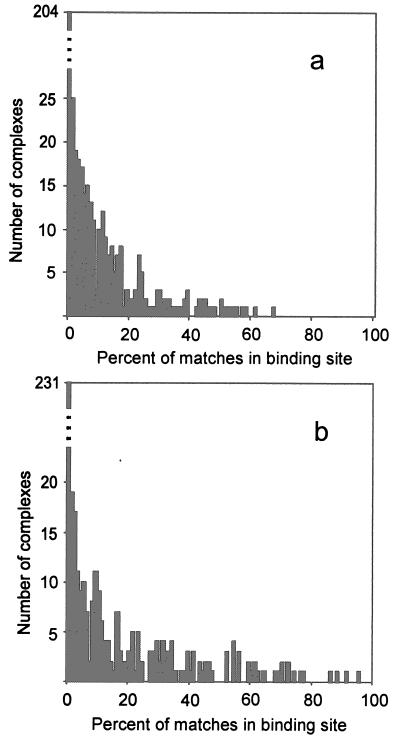
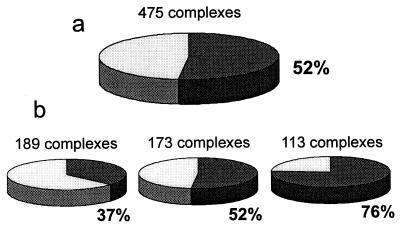
The distribution of complexes according to the percent of matches in the binding site is shown in Fig. 5. As can be seen, a significant number of complexes have a very large percentage of matches in the binding site. At the same time, many complexes have no matches in the binding site. Both cases point to the nonrandom character of the match’s distribution. In the case of no matches at the ligand–receptor interface, the matches were usually clustered at different sites, which may be an indication of alternative binding modes. The analysis of complexes based on the comparison with the distribution of the random matches (Fig. 6) determined 52% of all complexes to have the low-resolution recognition property (37%, 52%, and 76% of complexes with interface area 1,000–2,000 Å2, 2,000–4,000 Å2, and >4,000 Å2, respectively). Obviously, like any computational approach, both gramm and the analysis procedure have limitations in terms of the algorithm, implementation, choice of parameters, etc. Thus, it is unrealistic to expect detection of all low-resolution recognition cases. The actual number of such cases may be significantly higher. However, we presently do not have a better estimate of this number.
Figure 5.
Distribution of complexes according to the percent of matches inside the binding site. The total number of matches per complex is 1,000 (a) and 100 (b) (lowest energy matches).
Figure 6.
Percent of complexes with detected low-resolution recognition. (a) All complexes. (b) Complexes with interface area 1,000–2,000 Å2 (Left), 2,000–4,000 Å2 (Middle), and >4,000 Å2 (Right).
Complexes Without Established Low-Resolution Recognition.
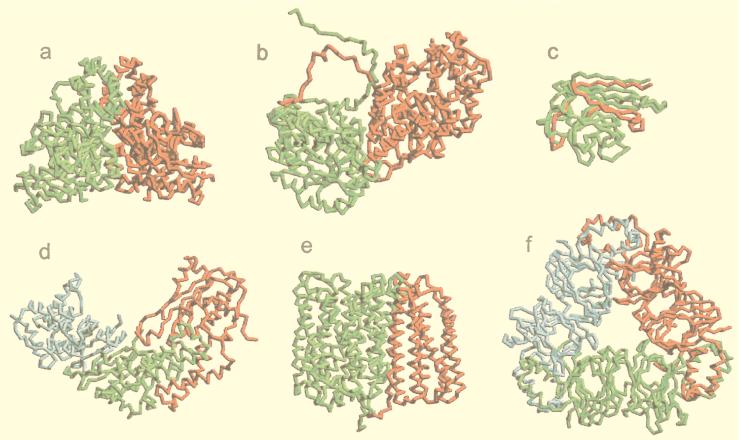
Examples of complexes in which we did not succeed in detecting the low-resolution recognition are shown in Fig. 7. In most such cases, the factors that cause fewer matches in the crystallographically determined binding sites are clear (e.g., alternative binding mode, chain interpenetration, nonbinary complex). A deeper insight into such special configurations of complexes would allow one to increase the number of detected low-resolution recognition cases. Such study would require multiple sets of docking parameters and more sophisticated analysis tools. At this point, however, we chose a simple approach, that in a systematic way confirms the existence of low-resolution recognition on a broad scale and left a more comprehensive analysis for future study.
Figure 7.
Examples of complexes with and without detected low-resolution recognition. The receptor is shown in green and the ligand in red. All structures are in the cocrystallized positions. (a) A complex with established low-resolution. Complexes without detected low-resolution recognition: disordered termini that are part of the interface (b), interwoven chains (c), an alternative binding mode with the subunit identical to the ligand shown in blue (d), helix bundles with a cylinder-like low-resolution structure (e), and a ternary complex (f).
CONCLUSIONS
A comprehensive, nonredundant database of cocrystallized protein–protein complexes was used to study low-resolution recognition, which was reported in earlier docking experiments with a small number of proteins. The docking program gramm was used to delete the atom-size structural details and systematically dock the resulting molecular images. Analysis of the results revealed the following. (i) The distribution of matches in the entire database showed that inside-binding-site/total ratio for the low-energy matches is higher than that for the high-energy matches, indicating the existence of a general docking preference toward the actual binding mode and, thus, showing the significance of the low-resolution recognition. (ii) Significantly higher than random number of matches in the binding area, indicating the existence of the low-resolution recognition, was detected in 52% of all complexes (in 37%, 52%, and 76% of complexes with interface area 1,000–2,000 Å2, 2,000–4,000 Å2, and >4,000 Å2, respectively). Limitations of the docking and analysis tools used in this study suggest that the actual number of complexes with low-resolution recognition is higher. However, the results already prove the existence of the low-resolution recognition on a broad scale.
Acknowledgments
The authors thank Dan Knapp and John Hildebrandt for reading the manuscript and for helpful comments. This work was supported by the National Science Foundation Computational Biology Activities grant and the South Carolina/National Science Foundation Experimental Program to Stimulate Competitive Research Cooperative Agreement.
Footnotes
This paper was submitted directly (Track II) to the Proceedings Office.
References
- 1.Vakser I A. Protein Eng. 1995;8:371–377. doi: 10.1093/protein/8.4.371. [DOI] [PubMed] [Google Scholar]
- 2.Vakser I A. Biopolymers. 1996;39:455–464. doi: 10.1002/(SICI)1097-0282(199609)39:3%3C455::AID-BIP16%3E3.0.CO;2-A. [DOI] [PubMed] [Google Scholar]
- 3.Vakser I A. Protein Eng. 1996;9:741–744. doi: 10.1093/protein/9.9.741. [DOI] [PubMed] [Google Scholar]
- 4.Novotny J, Handschumacher M, Haber E, Bruccoleri R E, Carlson W B, Fanning D W, Smith J A, Rose G D. Proc Natl Acad Sci USA. 1986;83:226–230. doi: 10.1073/pnas.83.2.226. [DOI] [PMC free article] [PubMed] [Google Scholar]
- 5.Laskowski R A, Luscombe N M, Swindells M B, Thornton J M. Protein Sci. 1996;5:2438–2452. doi: 10.1002/pro.5560051206. [DOI] [PMC free article] [PubMed] [Google Scholar]
- 6.Peters K P, Fauck J, Frommel C. J Mol Biol. 1996;256:201–213. doi: 10.1006/jmbi.1996.0077. [DOI] [PubMed] [Google Scholar]
- 7.Ho C M W, Marshall G R. J Comput Aided Mol Des. 1990;4:337–354. doi: 10.1007/BF00117400. [DOI] [PubMed] [Google Scholar]
- 8.Duncan B S, Olson A J. Biopolymers. 1993;33:231–238. doi: 10.1002/bip.360330205. [DOI] [PubMed] [Google Scholar]
- 9.Fetrow J S, Skolnick J. J Mol Biol. 1998;281:949–968. doi: 10.1006/jmbi.1998.1993. [DOI] [PubMed] [Google Scholar]
- 10.Fetrow J S, Godzik A, Skolnick J. J Mol Biol. 1998;282:703–711. doi: 10.1006/jmbi.1998.2061. [DOI] [PubMed] [Google Scholar]
- 11.Pappu R V, Marshall G R, Ponder J W. Nat Struct Biol. 1999;6:50–55. doi: 10.1038/4922. [DOI] [PubMed] [Google Scholar]
- 12.Trosset J-Y, Scheraga H A. Proc Nat Acad Sci USA. 1998;95:8011–8015. doi: 10.1073/pnas.95.14.8011. [DOI] [PMC free article] [PubMed] [Google Scholar]
- 13.Robert C H, Janin J. J Mol Biol. 1998;283:1037–1047. doi: 10.1006/jmbi.1998.2152. [DOI] [PubMed] [Google Scholar]
- 14.Vakser I A. Protein Eng. 1996;9:37–41. doi: 10.1093/protein/9.1.37. [DOI] [PubMed] [Google Scholar]
- 15.Berg O G, von Hippel P H. Annu Rev Biophys Biophys Chem. 1985;14:131–160. doi: 10.1146/annurev.bb.14.060185.001023. [DOI] [PubMed] [Google Scholar]
- 16.McCammon J A. Curr Opin Struct Biol. 1998;8:245–249. doi: 10.1016/s0959-440x(98)80046-8. [DOI] [PubMed] [Google Scholar]
- 17.Panchenko A R, Luthey-Schulten Z, Cole R, Wolynes P G. J Mol Biol. 1997;272:95–105. doi: 10.1006/jmbi.1997.1205. [DOI] [PubMed] [Google Scholar]
- 18.Zhang C, Chen J, DeLisi C. Proteins. 1999;34:255–267. [PubMed] [Google Scholar]
- 19.Camacho C J, Weng Z, Vajda S, DeLisi C. Biophys J. 1999;76:1166–1178. doi: 10.1016/S0006-3495(99)77281-4. [DOI] [PMC free article] [PubMed] [Google Scholar]
- 20.Sternberg M J E, Gabb H A, Jackson R M. Curr Opin Struct Biol. 1998;8:250–256. doi: 10.1016/s0959-440x(98)80047-x. [DOI] [PubMed] [Google Scholar]
- 21.Kuntz I D, Meng E C, Shoichet B K. Acc Chem Res. 1994;27:117–123. [Google Scholar]
- 22.Vajda S, Sippl M, Novotny J. Curr Opin Struct Biol. 1997;7:222–228. doi: 10.1016/s0959-440x(97)80029-2. [DOI] [PubMed] [Google Scholar]
- 23.Dixon J S. Proteins. 1997. Suppl. 1, 198–204. [Google Scholar]
- 24.Vakser I A. Proteins. 1997. Suppl. 1, 226–230. [Google Scholar]
- 25.Dunbrack R L J, Gerloff D L, Bower M, Chen X, Lichtarge O, Cohen F E. Fold Des. 1997;2:R27–R42. doi: 10.1016/S1359-0278(97)00011-4. [DOI] [PubMed] [Google Scholar]
- 26.Sanchez R, Sali A. Proc Natl Acad Sci USA. 1998;95:13597–13602. doi: 10.1073/pnas.95.23.13597. [DOI] [PMC free article] [PubMed] [Google Scholar]
- 27.Katchalski-Katzir E, Shariv I, Eisenstein M, Friesem A A, Aflalo C, Vakser I A. Proc Natl Acad Sci USA. 1992;89:2195–2199. doi: 10.1073/pnas.89.6.2195. [DOI] [PMC free article] [PubMed] [Google Scholar]
- 28.Vakser I A, Aflalo C. Proteins. 1994;20:320–329. doi: 10.1002/prot.340200405. [DOI] [PubMed] [Google Scholar]
- 29.Chang Y-T, Stiffelman O B, Vakser I A, Loew G H, Bridges A, Waskell L. Protein Eng. 1997;10:119–129. doi: 10.1093/protein/10.2.119. [DOI] [PubMed] [Google Scholar]
- 30.Bridges A, Gruenke L, Chang Y-T, Vakser I A, Loew G, Waskell L. J Biol Chem. 1998;273:17036–17049. doi: 10.1074/jbc.273.27.17036. [DOI] [PubMed] [Google Scholar]
- 31.Martin A C R, MacArthur M W, Thornton J M. Proteins. 1997. Suppl. 1, 14–28. [DOI] [PubMed] [Google Scholar]
- 32.Marchler-Bauer A, Levitt M, Bryant S H. Proteins. 1997. Suppl. 1, 83–91. [DOI] [PubMed] [Google Scholar]
- 33.Lesk A M. Proteins. 1997. Suppl. 1, 151–166. [Google Scholar]
- 34.Abola E E, Bernstein F C, Bryant S H, Koetzle T L, Weng J. In: Crystallographic Databases - Information Content, Software Systems, Scientific Applications. Allen F H, Bergerhoff G, Sievers R, editors. Bonn, Germany: Data Commission of the International Union of Crystallography; 1987. pp. 107–132. [Google Scholar]
- 35.Janin J, Rodier F. Proteins. 1995;23:580–587. doi: 10.1002/prot.340230413. [DOI] [PubMed] [Google Scholar]
- 36.Carugo O, Argos P. Protein Sci. 1997;6:2261–2263. doi: 10.1002/pro.5560061021. [DOI] [PMC free article] [PubMed] [Google Scholar]
- 37.Tsai C-J, Lin S L, Wolfson H J, Nussinov R. J Mol Biol. 1996;260:604–620. doi: 10.1006/jmbi.1996.0424. [DOI] [PubMed] [Google Scholar]
- 38.Papoulis A. Probability, Random Variables and Stochastic Processes. New York: McGraw-Hill; 1965. [Google Scholar]


