Abstract
Methods: An enzyme linked immunosorbent assay (ELISA) was used to measure TNFα, p55 sTNF-R, and p75 sTNF-R concentrations in the serum of 43 patients with rheumatoid arthritis (RA) and 34 patients with osteoarthritis (OA).
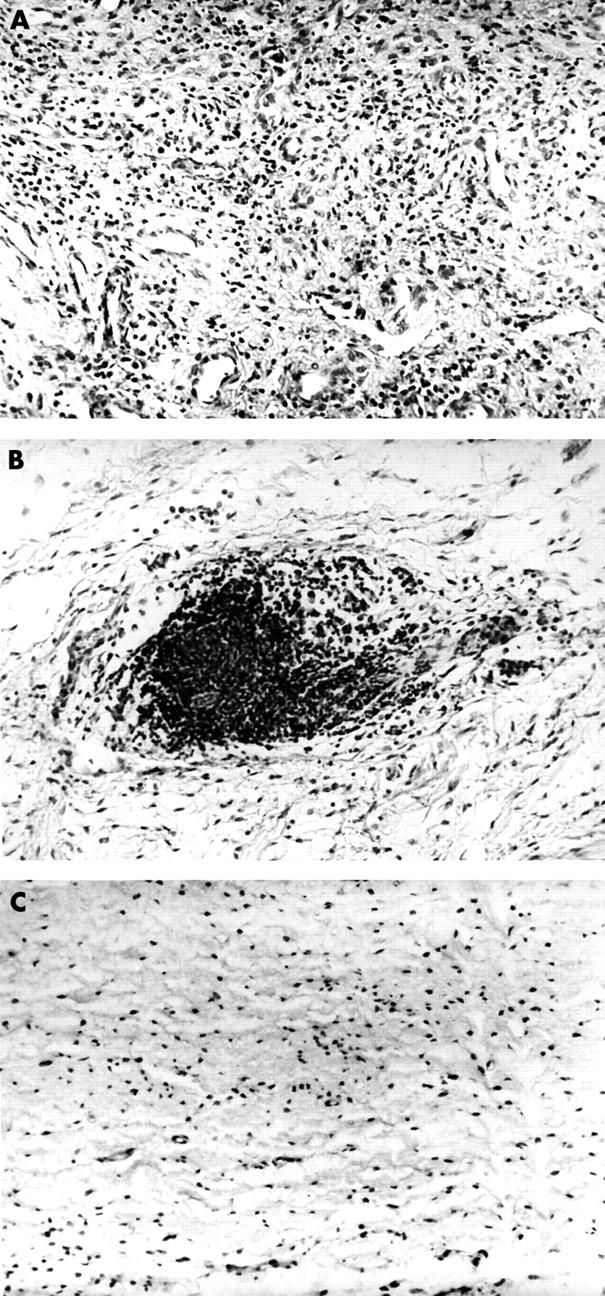
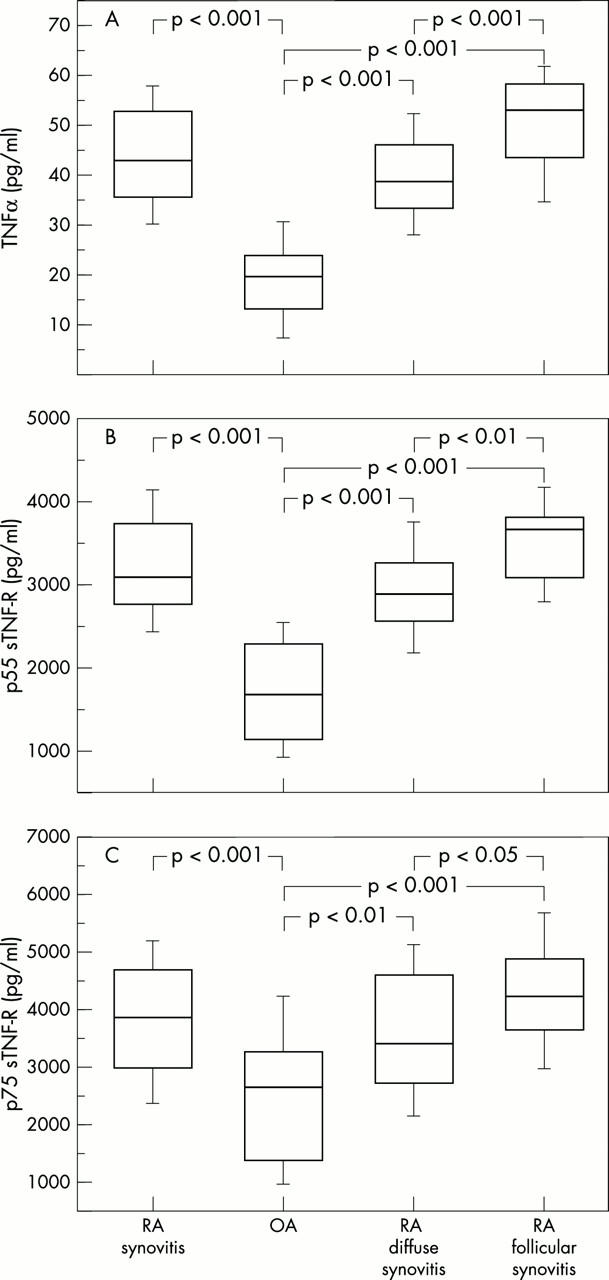
Results: Upon histological analysis two variants of rheumatoid synovitis emerged. Twenty six RA specimens presented only diffuse infiltrates of mononuclear cells. In the remaining 17 samples the formation of lymphocytic follicles with germinal centre-like structures was found. Serum concentrations of TNFα, p55 and p75 sTNF-R were raised in patients with RA compared with the OA control group (p<0.001 for all comparisons). Levels of TNFα, p55 and p75 sTNF-R were higher in the serum of patients with RA with follicular synovitis than in patients with diffuse synovitis (p<0.001, p<0.01, and p<0.05, respectively). Serum concentrations of TNFα, p55 and p75 sTNF-R correlated with markers of disease activity.
Conclusion: Different histological types of rheumatoid synovitis associated with distinct serum levels of TNFα and sTNF-R reflect varying clinical activity of the disease and support the concept of RA heterogeneity.
Full Text
The Full Text of this article is available as a PDF (170.3 KB).
Figure 1.

Histological findings in RA and OA synovia. Typical specimens are presented for the analysed groups of patients. (A) RA synovium sample displaying diffuse lymphocyte infiltrates with no additional specific microanatomical organisation. (B) RA specimen with the presence of lymphocytic follicular aggregates. (C) OA synovium with mild mononuclear cell infiltration. Original magnification x200.
Figure 2.

Serum concentrations of TNFα (A), p55 sTNF-R (B), and p75 sTNF-R (C) in the studied patient groups. Measurement was based on an ELISA technique. Box plots represent median (line), 25th and 75th centiles (box), and whiskers indicate the 10th and 90th centiles.


