Abstract
Methods: Four kinds of monoclonal anti-type II collagen antibody followed by lipopolysaccharide (LPS) three days later were given to 6 week old, female Balb/c mice to induce arthritis. Three groups of mice received 0.2 mg/kg/day, 2 mg/kg/day, and 10 mg/kg/day of endostatin, respectively, whereas a control group received phosphate buffered saline (PBS). Endostatin or PBS was given for 13 days, starting before the development of arthritis. Arthritis was evaluated by arthritis scores and hind paw thicknesses. Mice were killed for histological examination on the 22nd day after the administration of monoclonal anti-type II collagen antibody.
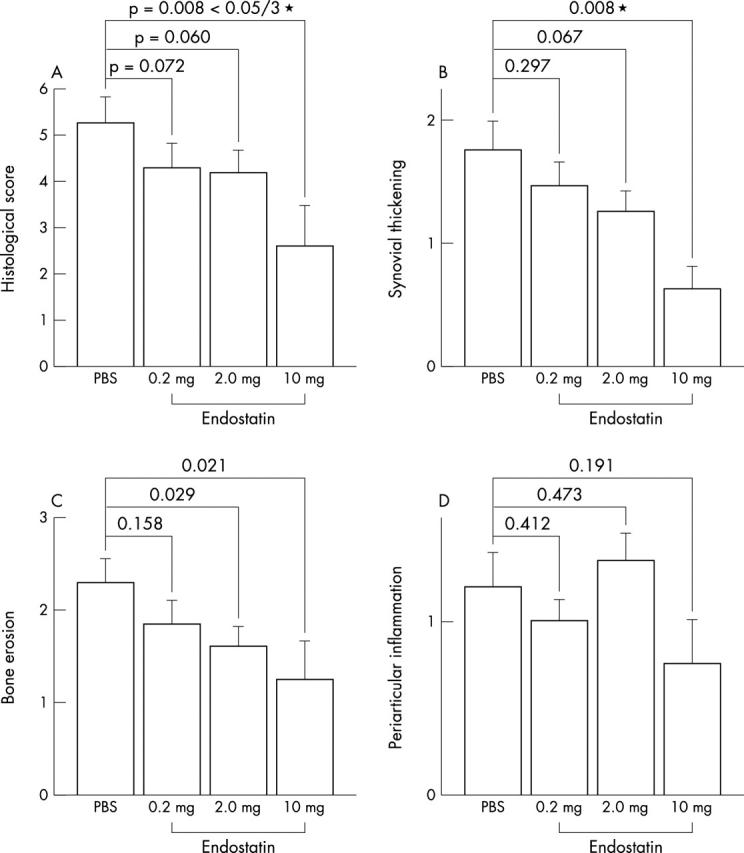
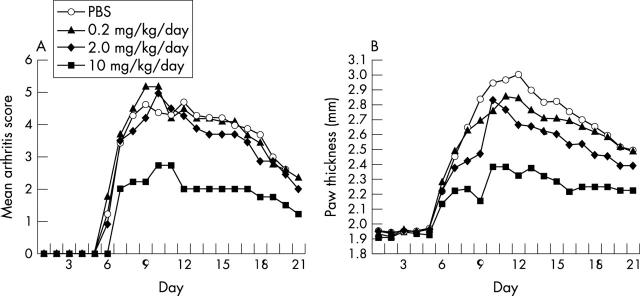
Results: Arthritis developed within three days after LPS administration in both the control and endostatin treatment groups. No difference in the development rate of arthritis was noted between the control and endostatin treatment groups. Arthritis scores remained significantly lower in the endostatin 10 mg/kg/day group than in the control group. Hind paw thicknesses also remained significantly smaller in the endostatin 10 mg/kg/day group than in the control group. Histopathological examination showed that synovial thickening and subchondral bone erosion improved more in the endostatin treatment groups than in the control group.
Conclusion: The systemic administration of endostatin had an arthritis inhibiting effect in RA animal models. Endostatin inhibited, in particular, pannus formation and bone destruction.
Full Text
The Full Text of this article is available as a PDF (136.0 KB).
Figure 1.
Time dependent changes in mean arthritis scores and hind paw thicknesses.
Figure 2.

Comparison of the histological scores in the endostatin treatment groups and the control group.


