Abstract
Methods: Baseline and sequential cytokine levels (IL1, TNFα, IFNγ, TGFß and IL10) were examined after 52 weeks of infliximab treatment 5 mg/kg in 22 patients.
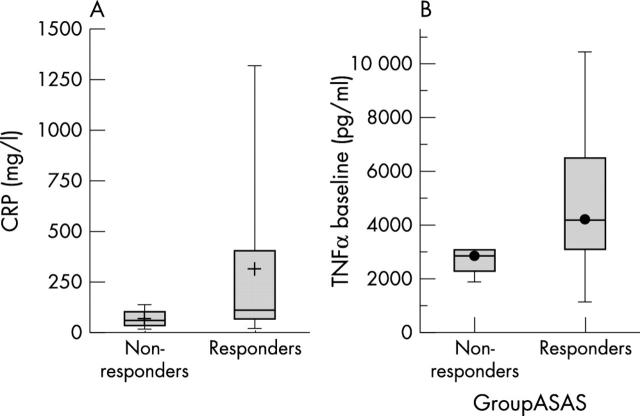
Results: At week 52, 18 patients were responders and four non-responders according to ASAS group criteria. Clinical measures of disease activity between the two groups at baseline were similar, apart from a trend towards longer disease duration in non-responders (p = 0.08). Baseline CRP and TNFα levels were higher in responders than non-responders (p<0.01 and p<0.006, respectively). The two groups had similar baseline cytokine levels, apart from TNFα. Baseline CRP levels did not correlate significantly with baseline cytokine levels in responders, but a strong correlation was noted between baseline CRP and IL1, IFNγ, and IL10 in non-responders. Apart from an early rise in TGFß and a decrease in IL10 in responders after the first infusion, sequential cytokine analysis for the first six months of treatment was not related to clinical disease activity measures.
Conclusion: Although sequential cytokine analysis does not appear to be informative, baseline CRP and TNFα levels are useful markers of clinical response patterns in patients with AS treated with infliximab.
Full Text
The Full Text of this article is available as a PDF (236.0 KB).
Figure 1 .
(A) Comparison of CRP levels by ELISA between responders and non-responders to infliximab in patients with AS. Responders were defined as those patients who met the ASAS 20 definition of response at one year. Non-responders were defined as those patients who did not meet the ASAS 20 definition of response at one year. Boxes represent the 25th and 75th centiles; horizontal lines represent the medians; vertical lines above and below the boxes represent the distribution beyond the 25–75th centile range. p Value <0.01 for baseline CRP values.) Comparison of TNFα levels in the supernatants of stimulated PBMC between responders and non-responders to infliximab in patients with AS. Responders were defined as those patients who met the ASAS 20 definition of response at one year. Non-responders were defined as those patients who did not meet the ASAS 20 definition of response at one year. See "Methods" for further definition of ASAS criteria for response. Boxes represent the 25th and 75th centiles; horizontal lines represent the medians; vertical lines above and below the boxes represent the distribution beyond the 25–75th centile range. p<0.006 for baseline TNFα values.
Figure 2 .
(A) A comparison of TNFα and CRP levels over the first six months of treatment with infliximab in responders. Response to treatment was defined using the ASAS 20 response criteria as before. (B) A comparison of TNFα and CRP levels in non-responders over the first six months of treatment with infliximab. Response to treatment was defined using the ASAS 20 response criteria as before.


