

Abstract
Objective: To examine the expression and distribution of MMR enzymes in synovial tissues from patients with arthritis and from normal subjects.
Methods: Synovial tissues from patients with RA, osteoarthritis (OA), or normal subjects were analysed by immunohistochemistry using monoclonal antibodies to hMSH2, hMSH3, and hMSH6. MMR protein expression was evaluated by computer assisted digital image analysis.
Results: hMSH2, hMSH3, and hMSH6 were found in most synovial tissues evaluated, with greater levels in the intimal lining than sublining regions. In RA and OA, sublining perivascular staining for hMSH6 and hMSH3 was also prominent. Significantly higher sublining expression of hMSH2, hMSH3, and hMSH6 was seen in RA and OA than in normal synovium. Double label immunohistochemistry demonstrated that the main cells expressing MMR enzymes were CD68+ and CD68– cells in the intimal lining.
Conclusions: DNA MMR enzyme expression is greatest in the synovial intimal lining layer, where maximal oxidative stress in RA occurs. Although MMR enzyme expression is greater in RA than in normal tissue, this compensatory response cannot overcome the genotoxic environment, and DNA damage accumulates.
Full Text
The Full Text of this article is available as a PDF (360.6 KB).
Figure 1.
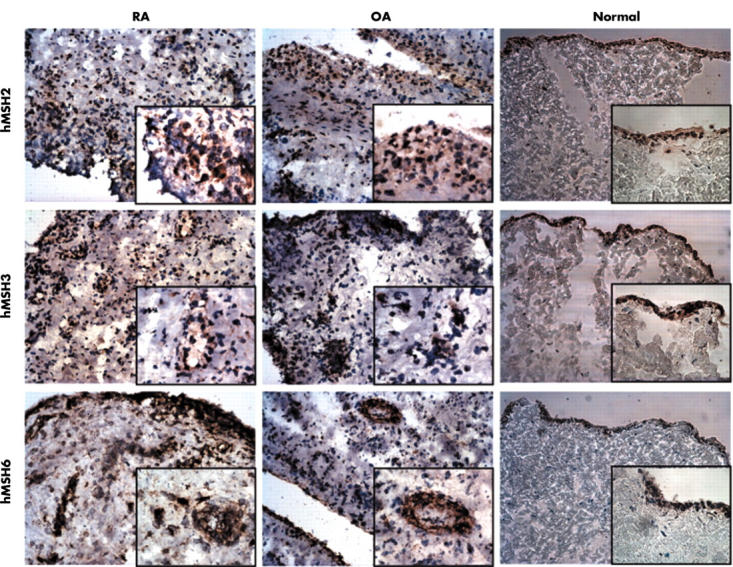
Distribution of DNA MMR enzymes in synovial tissue. Sections from RA (n = 6), OA (n = 5), and normal (n = 4) synovia were incubated with mAb to hMSH2, hMSH3, or hMSH6. The proteins were detected using the immunoperoxidase technique and DAB (brown colour). The slides were counterstained with haematoxylin (blue). Representative sections are shown. Images were obtained at x200 magnification, and each insert obtained at x400 magnification.
Figure 2.

Double label immunohistochemistry for MMR enzymes and cell surface markers. Representative field in an RA synovium are shown demonstrating the expression of hMSH2, hMSH3, and hMSH6 in CD3+ T cells and CD68+ macrophages. Examples of double positive cells are indicated by arrows. The most abundant staining for all three MMR proteins (red, peroxidase) was seen in intimal lining CD68+ (blue, AP) and CD68– cells (macrophage-like synoviocytes and fibroblast-like synoviocytes, respectively). Only rare T cells (blue, AP) in the sublining were positive (an example is shown in the figure).
Figure 3.

Digital image analysis of DNA MMR enzyme expression in ST. Intimal lining and sublining regions were defined in five to six HPF images (x400 magnification) from each ST. The percentage positive area was determined by dividing the number of pixels above a colour threshold by the total number of pixels within the selected area. The data are presented as mean (SEM). *p<0.003 when comparing lining and sublining regions in RA, OA, or normal synovium; **p<0.01 when comparing lining or sublining regions of RA with OA; # p<0.004 when comparing RA or OA with normal synovium.