Abstract
Objectives: To validate the use of cDNA based microarray on synovial biopsies by analysing the experimental variability due to amplification of RNA, reproducibility of the assay, heterogeneity of the tissue, and statistical analysis.
Methods: Total RNA was extracted from three spondyloarthropathy (SpA) and three osteoarthritis (OA) synovial tissue biopsy specimens and from the peripheral blood mononuclear cells (PBMC) of four healthy donors. Exponential RNA amplification by SMART-PCR was compared with linear amplification. Reproducibility was tested by comparing different microarray systems and by performing duplicate experiments. Sample heterogeneity was assessed by comparing overall gene expression profiles, histopathology, and analysis of genes expressed in the synovium and normal PBMC. Statistical analysis using t test and Bonferroni adjustment was verified by permutation of class labels.
Results: Gene expression was concordant in 12/14 (86%) cytokine/chemokine genes between both microarrays and different RNA amplification systems. When one microarray system was used, expressed genes were 78–95% concordant in duplicate experiments. Gene expression profiles had a higher degree of similarity between SpA synovium than between PBMC or OA synovium despite clear histopathological differences between synovial samples. Comparison of SpA synovium with OA synovium and with PBMC yielded 11 and 18 expressed transcripts, respectively; six were shared in both comparisons. Permutations of SpA and OA samples yielded only one expressed gene in 19 comparisons.
Conclusions: These data provide evidence that microarrays can be used for analysis of synovial tissue biopsies with high reproducibility and low variability of the generated gene expression profiles.
Full Text
The Full Text of this article is available as a PDF (859.4 KB).
Figure 1 .
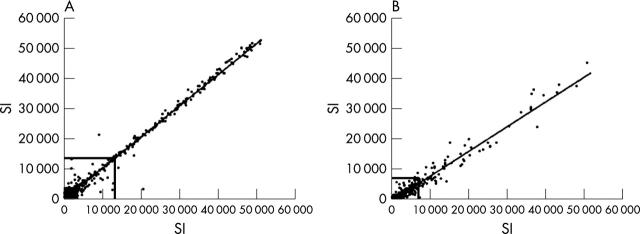
XY scatter plots for signal intensity data as generated by Atlas 1.2 microarray from different RNA aliquots. (A) displays the XY scatter plot of signal intensity data as generated from LPS stimulated monocytes of a healthy donor. Two different RNA aliquots from this donor (150 and 300 ng) were amplified by SMART-PCR and subsequently assayed by the Human Atlas 1.2 microarray system. The two datasets yield reproducible signal intensities as can be seen by their almost identical distribution with very few outliers. Calculation showed that the correlation coefficient between the two datasets was 0.99 (significance level 0.01; Pearson correlation). The local background was subtracted from the signal intensity data, which were normalised. The bold lines depict the onefold background level at 13 400 (SI, signal intensity; arbitrary units). (B) Signal intensities from a duplicate experiment using identical aliquots from a synovial tissue biopsy sample are shown. Total RNA (150 ng) was amplified by SMART-PCR and hybridised to the Atlas 1.2 array membrane. In comparison with LPS stimulated monocytes, most genes are expressed on a lower level, which is typically found in synovial tissue samples. Accordingly, the onefold background level was lower at 6700. Also, the distribution of signal intensities was more scattered as compared with fig 1A but still shows a reasonably high reproducibility. Here, the correlation coefficient was 0.98 (significance level 0.01; Pearson correlation).
Figure 2 .
Dendrogram depicting results of hierarchical cluster analysis from gene expression values of six synovial tissue samples and four normal PBMC. Hierarchical cluster analysis of gene expression data of all 10 samples as assessed by between-groups linkage analysis. The two columns on the left list the patient diagnoses and attribute numbers to the 10 samples used in this analysis. The horizontal scale ("rescaled distance cluster combine") uses arbitrary units from 0 to 25 in order to measure the similarity between the various samples that are clustered. The length of the multiple horizontal tree branches measured on the scale above reflects the degree of similarity between the various datasets. Each sample (horizontal line) is connected to the adjacent sample by a vertical line, which is extended by the thin dashed line and can be read off the scale. The three SpA synovial samples are classified as most similar among the three different groups (SpA, OA synovium, and normal PBMC) because their horizontal lines merge at 2 as compared with the four normal PBMC samples, which merge at 6. When all six synovial samples are taken together, they demonstrate the lowest degree of similarity with a vertical line merging at 20 on the scale above. Note the separation of samples (three SpA and three OA synovial tissue samples (SpA1–3, OA1–3) and four healthy PBMC (HC1-4)) into two different nodes (O) of the dendrogram. Homogeneity of gene expression pattern is highest among SpA samples (quantified as 2) and lowest among OA samples (quantified as 20).
Figure 3 .
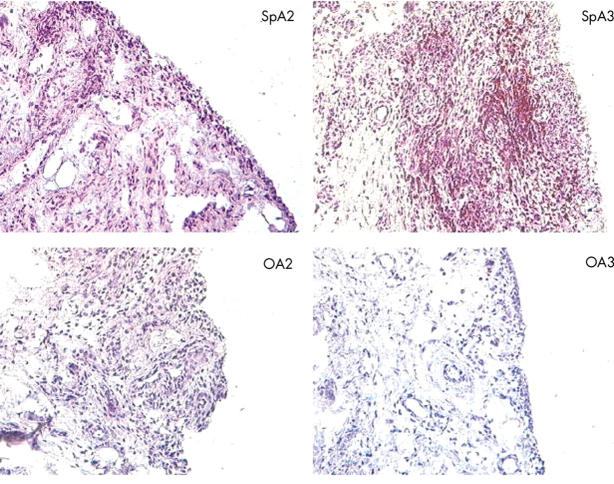
Microscopic picture of anti-CD3 staining on frozen synovial sections of two patients with SpA and two with OA (original magnification x160). SpA3 shows clear signs of chronic inflammation with synovial lining hyperplasia, hypervascularity, and perivascular infiltration of lymphoid cells, whereas SpA2, OA2, and OA3 show only minimal signs of hypervascularity and inflammatory infiltration (see also table 3). Peroxidase staining against CD3 is strongly positive in SpA3, showing mainly a perivascular pattern, but is negative in all other patients.
Figure 4 .
Average linkage analysis of 1185 transcripts from all 10 samples as assayed by microarray. The left column (A) displays all 10 assayed samples with 1185 genes placed in rows. Each gene is represented by a single row of coloured boxes with correlation between level of expression and intensity of colour ranging from black (no expression) to bright red (high expression). The yellow lines in column A frame one identified homogeneous cluster of genes highly expressed in all three SpA samples. Column B is a magnified segment of the left column showing 16 genes within that particular cluster. Nine of the 16 genes, underlined in red, were also identified by t test in either SpA v OA or SpA v HC, and five of nine genes within that cluster were found to be among the genes expressed significantly in both the t test comparison groups.
Selected References
These references are in PubMed. This may not be the complete list of references from this article.
- Alizadeh A. A., Eisen M. B., Davis R. E., Ma C., Lossos I. S., Rosenwald A., Boldrick J. C., Sabet H., Tran T., Yu X. Distinct types of diffuse large B-cell lymphoma identified by gene expression profiling. Nature. 2000 Feb 3;403(6769):503–511. doi: 10.1038/35000501. [DOI] [PubMed] [Google Scholar]
- Baeten D., Demetter P., Cuvelier C., Van Den Bosch F., Kruithof E., Van Damme N., Verbruggen G., Mielants H., Veys E. M., De Keyser F. Comparative study of the synovial histology in rheumatoid arthritis, spondyloarthropathy, and osteoarthritis: influence of disease duration and activity. Ann Rheum Dis. 2000 Dec;59(12):945–953. doi: 10.1136/ard.59.12.945. [DOI] [PMC free article] [PubMed] [Google Scholar]
- Baeten D., Van den Bosch F., Elewaut D., Stuer A., Veys E. M., De Keyser F. Needle arthroscopy of the knee with synovial biopsy sampling: technical experience in 150 patients. Clin Rheumatol. 1999;18(6):434–441. doi: 10.1007/s100670050134. [DOI] [PubMed] [Google Scholar]
- Baggerly K. A., Coombes K. R., Hess K. R., Stivers D. N., Abruzzo L. V., Zhang W. Identifying differentially expressed genes in cDNA microarray experiments. J Comput Biol. 2001;8(6):639–659. doi: 10.1089/106652701753307539. [DOI] [PubMed] [Google Scholar]
- Dougados M., van der Linden S., Juhlin R., Huitfeldt B., Amor B., Calin A., Cats A., Dijkmans B., Olivieri I., Pasero G. The European Spondylarthropathy Study Group preliminary criteria for the classification of spondylarthropathy. Arthritis Rheum. 1991 Oct;34(10):1218–1227. doi: 10.1002/art.1780341003. [DOI] [PubMed] [Google Scholar]
- Eisen M. B., Spellman P. T., Brown P. O., Botstein D. Cluster analysis and display of genome-wide expression patterns. Proc Natl Acad Sci U S A. 1998 Dec 8;95(25):14863–14868. doi: 10.1073/pnas.95.25.14863. [DOI] [PMC free article] [PubMed] [Google Scholar]
- Firestein Gary S., Pisetsky David S. DNA microarrays: boundless technology or bound by technology? Guidelines for studies using microarray technology. Arthritis Rheum. 2002 Apr;46(4):859–861. doi: 10.1002/art.10236. [DOI] [PubMed] [Google Scholar]
- Gu J., Märker-Hermann E., Baeten D., Tsai W. C., Gladman D., Xiong M., Deister H., Kuipers J. G., Huang F., Song Y. W. A 588-gene microarray analysis of the peripheral blood mononuclear cells of spondyloarthropathy patients. Rheumatology (Oxford) 2002 Jul;41(7):759–766. doi: 10.1093/rheumatology/41.7.759. [DOI] [PubMed] [Google Scholar]
- Gu Jieruo, Rihl Markus, Märker-Hermann Elisabeth, Baeten Dominique, Kuipers Jens G., Song Yeong Wook, Maksymowych Walter P., Burgos-Vargas Ruben, Veys Eric M., De Keyser Filip. Clues to pathogenesis of spondyloarthropathy derived from synovial fluid mononuclear cell gene expression profiles. J Rheumatol. 2002 Oct;29(10):2159–2164. [PubMed] [Google Scholar]
- Guha M., Mackman N. LPS induction of gene expression in human monocytes. Cell Signal. 2001 Feb;13(2):85–94. doi: 10.1016/s0898-6568(00)00149-2. [DOI] [PubMed] [Google Scholar]
- Haslett Judith N., Sanoudou Despina, Kho Alvin T., Bennett Richard R., Greenberg Steven A., Kohane Isaac S., Beggs Alan H., Kunkel Louis M. Gene expression comparison of biopsies from Duchenne muscular dystrophy (DMD) and normal skeletal muscle. Proc Natl Acad Sci U S A. 2002 Nov 1;99(23):15000–15005. doi: 10.1073/pnas.192571199. [DOI] [PMC free article] [PubMed] [Google Scholar]
- Heller R. A., Schena M., Chai A., Shalon D., Bedilion T., Gilmore J., Woolley D. E., Davis R. W. Discovery and analysis of inflammatory disease-related genes using cDNA microarrays. Proc Natl Acad Sci U S A. 1997 Mar 18;94(6):2150–2155. doi: 10.1073/pnas.94.6.2150. [DOI] [PMC free article] [PubMed] [Google Scholar]
- Neumann E., Kullmann F., Judex M., Jüsten H. P., Wessinghage D., Gay S., Schölmerich J., Müller-Ladner U. Identification of differentially expressed genes in rheumatoid arthritis by a combination of complementary DNA array and RNA arbitrarily primed-polymerase chain reaction. Arthritis Rheum. 2002 Jan;46(1):52–63. doi: 10.1002/1529-0131(200201)46:1<52::AID-ART10048>3.0.CO;2-1. [DOI] [PubMed] [Google Scholar]
- Pan Wei. A comparative review of statistical methods for discovering differentially expressed genes in replicated microarray experiments. Bioinformatics. 2002 Apr;18(4):546–554. doi: 10.1093/bioinformatics/18.4.546. [DOI] [PubMed] [Google Scholar]
- Puskás László G., Zvara Agnes, Hackler László, Jr, Van Hummelen Paul. RNA amplification results in reproducible microarray data with slight ratio bias. Biotechniques. 2002 Jun;32(6):1330-4, 1336, 1338, 1340. doi: 10.2144/02326mt04. [DOI] [PubMed] [Google Scholar]
- Rosenwald Andreas, Wright George, Chan Wing C., Connors Joseph M., Campo Elias, Fisher Richard I., Gascoyne Randy D., Muller-Hermelink H. Konrad, Smeland Erlend B., Giltnane Jena M. The use of molecular profiling to predict survival after chemotherapy for diffuse large-B-cell lymphoma. N Engl J Med. 2002 Jun 20;346(25):1937–1947. doi: 10.1056/NEJMoa012914. [DOI] [PubMed] [Google Scholar]
- Zanders E. D., Goulden M. G., Kennedy T. C., Kempsell K. E. Analysis of immune system gene expression in small rheumatoid arthritis biopsies using a combination of subtractive hybridization and high-density cDNA arrays. J Immunol Methods. 2000 Jan 13;233(1-2):131–140. doi: 10.1016/s0022-1759(99)00126-x. [DOI] [PubMed] [Google Scholar]
- Zhumabayeva B., Diatchenko L., Chenchik A., Siebert P. D. Use of SMART-generated cDNA for gene expression studies in multiple human tumors. Biotechniques. 2001 Jan;30(1):158–163. doi: 10.2144/01301pf01. [DOI] [PubMed] [Google Scholar]
- Zou Tong-Tong, Selaru Florin M., Xu Yan, Shustova Valentina, Yin Jing, Mori Yuriko, Shibata David, Sato Fumiaki, Wang Suma, Olaru Andreea. Application of cDNA microarrays to generate a molecular taxonomy capable of distinguishing between colon cancer and normal colon. Oncogene. 2002 Jul 18;21(31):4855–4862. doi: 10.1038/sj.onc.1205613. [DOI] [PubMed] [Google Scholar]
- van de Vijver Marc J., He Yudong D., van't Veer Laura J., Dai Hongyue, Hart Augustinus A. M., Voskuil Dorien W., Schreiber George J., Peterse Johannes L., Roberts Chris, Marton Matthew J. A gene-expression signature as a predictor of survival in breast cancer. N Engl J Med. 2002 Dec 19;347(25):1999–2009. doi: 10.1056/NEJMoa021967. [DOI] [PubMed] [Google Scholar]


