Abstract
Objectives: To detect changes in the collagen fibril network in articular cartilage in a canine experimental model of early osteoarthritis (OA) using microscopic magnetic resonance imaging (µMRI) and polarised light microscopy (PLM).
Methods: Eighteen specimens from three pairs of the medial tibia of an anterior cruciate ligament transection canine model were subjected to µMRI and PLM study 12 weeks after surgery. For each specimen, the following experiments were carried out: (a) two dimensional µMRI images of T2 relaxation at four orientations; (b) the tangent Young's modulus; and (c) two dimensional PLM images of optical retardance and fibril angle. Disease induced changes in tissue were examined across the depth of the cartilage at a µMRI resolution of 13.7–23.1 µm.
Results: Several distinct changes from T2 weighted images of cartilage in OA tibia were seen. For the specimens that were covered at least in part by the meniscus, the significant changes in µMRI included a clear shift in the depth of maximum T2 (21–36%), a decrease in the superficial zone thickness (37–38%), and an increase in cartilage total thickness (15–27%). These µMRI changes varied topographically in the tibia surface because they were not significant in completely exposed locations in medial tibia. The µMRI results were confirmed by the PLM measurements and correlated well with the mechanical measurements.
Conclusion: Both µMRI and PLM can detect quantitatively changes in collagen fibre architecture in early OA and resolve topographical variations in cartilage microstructure of canine tibia.
Full Text
The Full Text of this article is available as a PDF (278.6 KB).
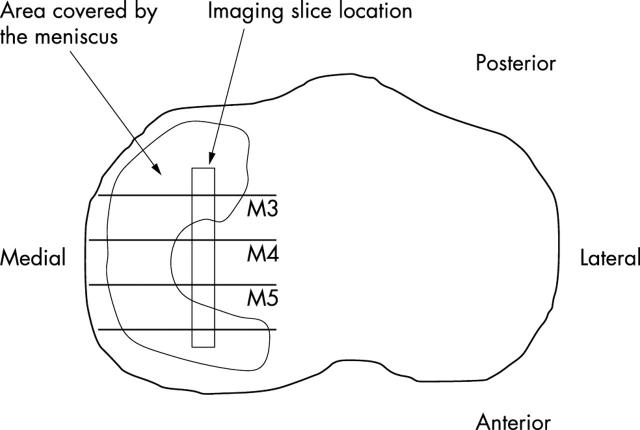
Figure 1 .
A schematic view of the tibia surface from canine knee joint with the location of specimens in the imaging experiments indicated on the central area of the tibia. The imaging slice location of M4 is not covered by the meniscus, whereas M5 and M3 imaging slice locations are at the margin of the meniscus.
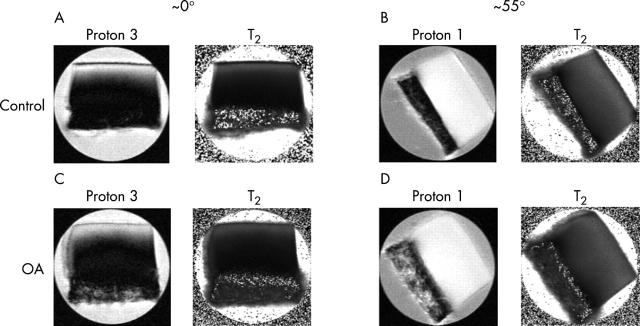
Figure 2 .
From the upper left: (A) proton 3 and T2 image of a control tibia specimen at ~0°; (B) proton 1 and T2 image of the same control tibia specimen at ~55°; (C) proton 3 and T2 image of an OA tibia specimen at ~0°; (D) proton 1 and T2 image of the same OA tibia specimen at ~55°. The images shown above are specimens from a matched set from the same animal with a resolution of 13.7 µm. Each specimen was imaged with four different T2 weightings. The angle is defined as the angle between the normal to the articular surface of cartilage and the direction of the magnetic field (Bo).
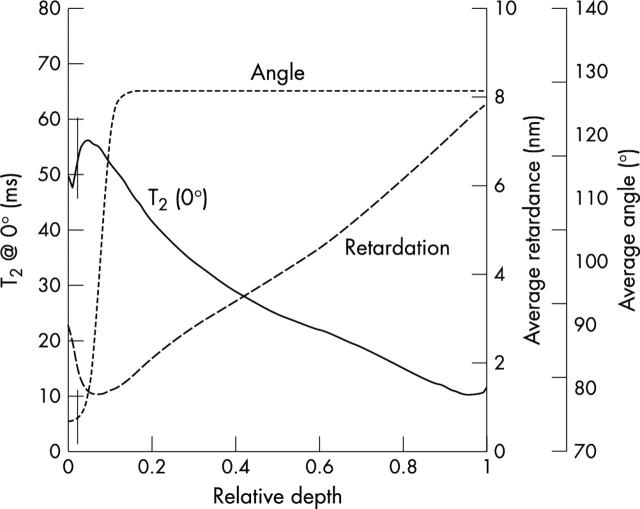
Figure 3 .
At the left y axis: T2 profile at ~0° versus the relative depth extracted from a 20 pixel column from the middle of an OA specimen with 13.7 µm in-depth resolution (solid line). At the right y axis: average optical retardation (dashed line) and average collagen orientation angle (dotted line) were plotted versus the relative depth of the same OA specimen with 13.6 µm in-depth resolution. The vertical lines correspond to the determined border between the superficial and the transitional zone.
Figure 4 .
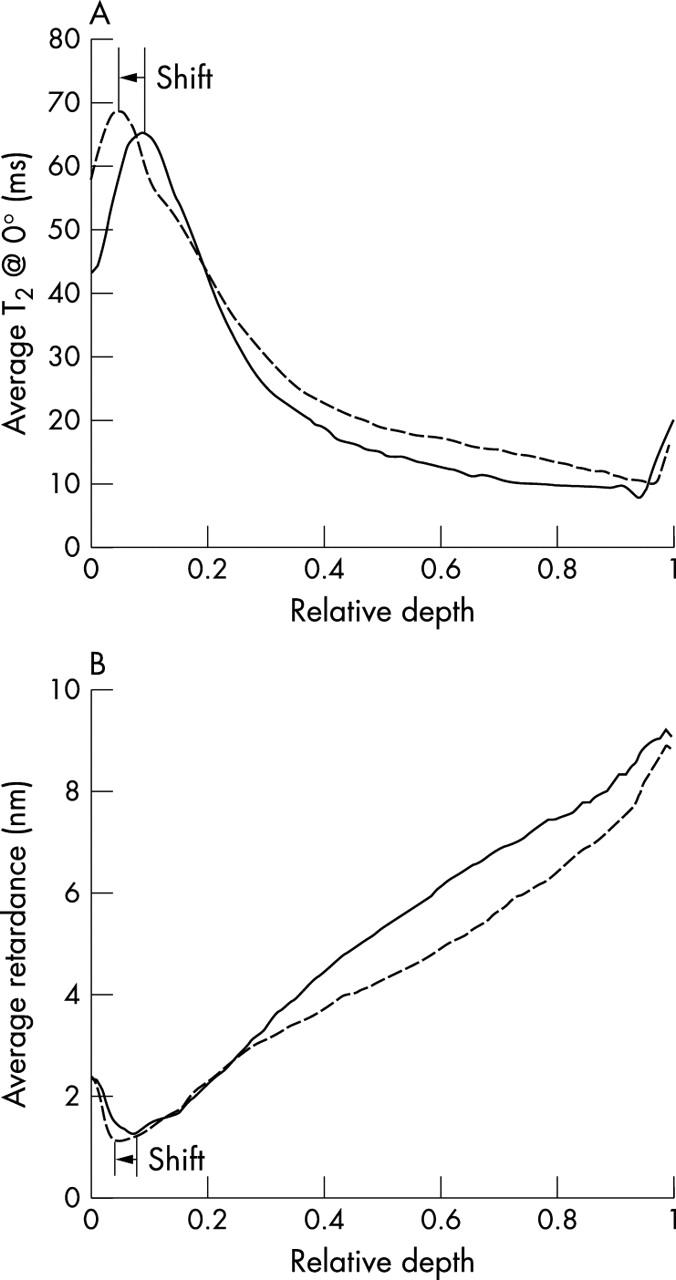
(A) Average T2 profiles of OA and control specimens at ~0° from the M3 location (n = 3) versus the relative depth. Notice the change in the thickness of the surface zone and subsequently the shift of the relative depth of maximum T2 between control specimens (solid line) and OA specimens (dashed line). (B) Average retardance profiles of OA and control specimens from the M3 location (n = 3) versus the relative depth. Notice the shift of the relative depth of minimum retardance between control specimens and OA specimens.
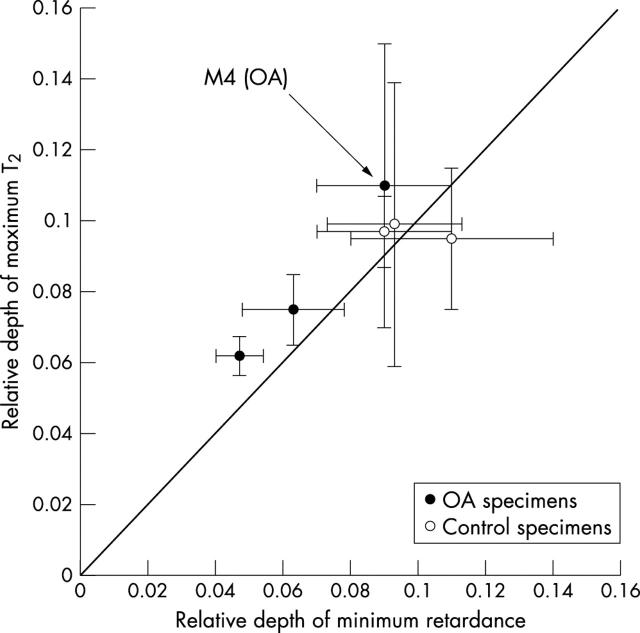
Figure 5 .
The trend of the relative depth of minimum retardance and the relative depth of maximum T2 at ~0°. Each point corresponds to the mean of relative depth at a specific location (M3, M4, and M5, n = 3).
Figure 6 .
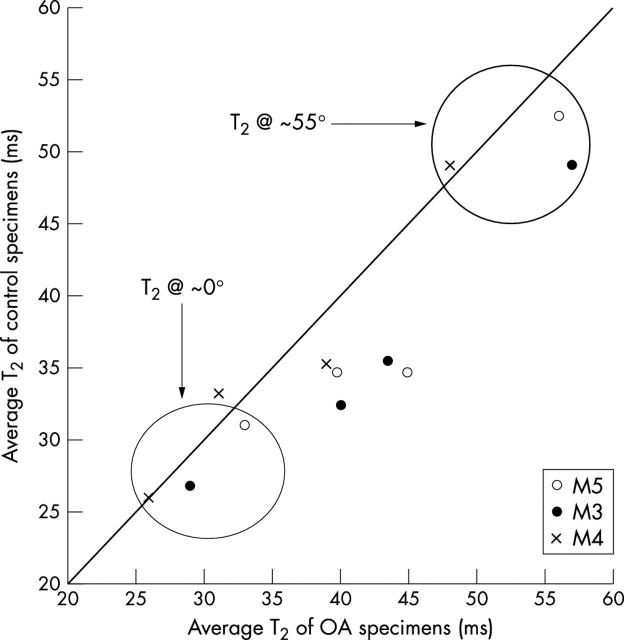
Average "bulk" T2 measurements for each topographical location (n = 3) at four different orientations (0°, 36°, 55°, and 90°). Note that T2 at ~0° shows the least variation between control and OA specimens.
Figure 7 .
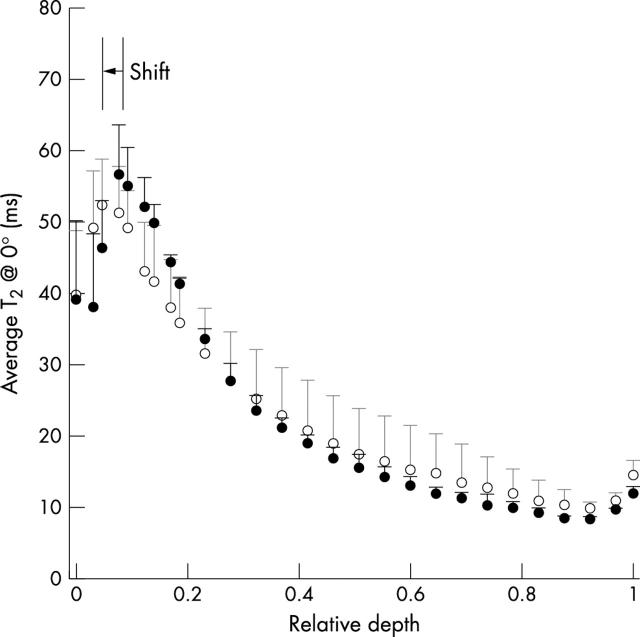
Average T2 profile at ~0° from the three adjacent specimens (M3, M4, and M5) from a normal tibia and an OA tibia from a matched pair, with 13.7 µm resolution. The error bars correspond to the variations in T2 among the adjacent specimens. (For clarity, only half of the points were plotted.)
Figure 8 .
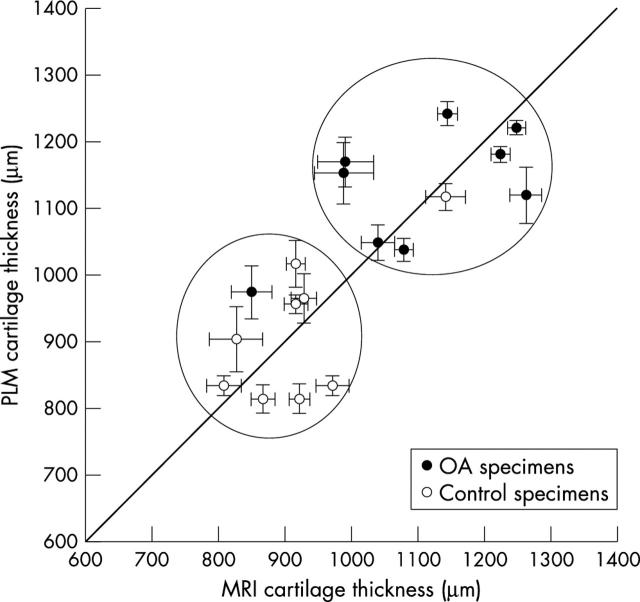
Total thickness of cartilage specimens from both MRI images and PLM images (n = 18). The linear correlation coefficient between MRI measurements and PLM measurements is 0.78.
Selected References
These references are in PubMed. This may not be the complete list of references from this article.
- Adams M. E., Li D. K., McConkey J. P., Davidson R. G., Day B., Duncan C. P., Tron V. Evaluation of cartilage lesions by magnetic resonance imaging at 0.15 T: comparison with anatomy and concordance with arthroscopy. J Rheumatol. 1991 Oct;18(10):1573–1580. [PubMed] [Google Scholar]
- Appleyard R. C., Burkhardt D., Ghosh P., Read R., Cake M., Swain M. V., Murrell G. A. C. Topographical analysis of the structural, biochemical and dynamic biomechanical properties of cartilage in an ovine model of osteoarthritis. Osteoarthritis Cartilage. 2003 Jan;11(1):65–77. doi: 10.1053/joca.2002.0867. [DOI] [PubMed] [Google Scholar]
- Bullough P. G., Yawitz P. S., Tafra L., Boskey A. L. Topographical variations in the morphology and biochemistry of adult canine tibial plateau articular cartilage. J Orthop Res. 1985;3(1):1–16. doi: 10.1002/jor.1100030101. [DOI] [PubMed] [Google Scholar]
- Burgkart R., Glaser C., Hyhlik-Dürr A., Englmeier K. H., Reiser M., Eckstein F. Magnetic resonance imaging-based assessment of cartilage loss in severe osteoarthritis: accuracy, precision, and diagnostic value. Arthritis Rheum. 2001 Sep;44(9):2072–2077. doi: 10.1002/1529-0131(200109)44:9<2072::AID-ART357>3.0.CO;2-3. [DOI] [PubMed] [Google Scholar]
- Burstein D., Bashir A., Gray M. L. MRI techniques in early stages of cartilage disease. Invest Radiol. 2000 Oct;35(10):622–638. doi: 10.1097/00004424-200010000-00008. [DOI] [PubMed] [Google Scholar]
- Chan W. P., Lang P., Stevens M. P., Sack K., Majumdar S., Stoller D. W., Basch C., Genant H. K. Osteoarthritis of the knee: comparison of radiography, CT, and MR imaging to assess extent and severity. AJR Am J Roentgenol. 1991 Oct;157(4):799–806. doi: 10.2214/ajr.157.4.1892040. [DOI] [PubMed] [Google Scholar]
- Clark J. M. Variation of collagen fiber alignment in a joint surface: a scanning electron microscope study of the tibial plateau in dog, rabbit, and man. J Orthop Res. 1991 Mar;9(2):246–257. doi: 10.1002/jor.1100090213. [DOI] [PubMed] [Google Scholar]
- Cova Maria, Toffanin Renato. MR microscopy of hyaline cartilage: current status. Eur Radiol. 2001 Oct 11;12(4):814–823. doi: 10.1007/s003300101128. [DOI] [PubMed] [Google Scholar]
- Dardzinski B. J., Mosher T. J., Li S., Van Slyke M. A., Smith M. B. Spatial variation of T2 in human articular cartilage. Radiology. 1997 Nov;205(2):546–550. doi: 10.1148/radiology.205.2.9356643. [DOI] [PubMed] [Google Scholar]
- Eckstein F., Sittek H., Milz S., Putz R., Reiser M. The morphology of articular cartilage assessed by magnetic resonance imaging (MRI). Reproducibility and anatomical correlation. Surg Radiol Anat. 1994;16(4):429–438. doi: 10.1007/BF01627667. [DOI] [PubMed] [Google Scholar]
- Hasty K. A., Reife R. A., Kang A. H., Stuart J. M. The role of stromelysin in the cartilage destruction that accompanies inflammatory arthritis. Arthritis Rheum. 1990 Mar;33(3):388–397. doi: 10.1002/art.1780330312. [DOI] [PubMed] [Google Scholar]
- Ho C., Cervilla V., Kjellin I., Haghigi P., Amiel D., Trudell D., Resnick D. Magnetic resonance imaging in assessing cartilage changes in experimental osteoarthrosis of the knee. Invest Radiol. 1992 Jan;27(1):84–90. doi: 10.1097/00004424-199201000-00017. [DOI] [PubMed] [Google Scholar]
- Hutton C. W., Vennart W. Osteoarthritis and magnetic resonance imaging: potential and problems. Ann Rheum Dis. 1995 Apr;54(4):237–243. doi: 10.1136/ard.54.4.237. [DOI] [PMC free article] [PubMed] [Google Scholar]
- Jones G., Glisson M., Hynes K., Cicuttini F. Sex and site differences in cartilage development: a possible explanation for variations in knee osteoarthritis in later life. Arthritis Rheum. 2000 Nov;43(11):2543–2549. doi: 10.1002/1529-0131(200011)43:11<2543::AID-ANR23>3.0.CO;2-K. [DOI] [PubMed] [Google Scholar]
- Liess C., Lüsse S., Karger N., Heller M., Glüer C-C. Detection of changes in cartilage water content using MRI T2-mapping in vivo. Osteoarthritis Cartilage. 2002 Dec;10(12):907–913. doi: 10.1053/joca.2002.0847. [DOI] [PubMed] [Google Scholar]
- Matyas J. R., Adams M. E., Huang D., Sandell L. J. Discoordinate gene expression of aggrecan and type II collagen in experimental osteoarthritis. Arthritis Rheum. 1995 Mar;38(3):420–425. doi: 10.1002/art.1780380320. [DOI] [PubMed] [Google Scholar]
- Matyas J. R., Ehlers P. F., Huang D., Adams M. E. The early molecular natural history of experimental osteoarthritis. I. Progressive discoordinate expression of aggrecan and type II procollagen messenger RNA in the articular cartilage of adult animals. Arthritis Rheum. 1999 May;42(5):993–1002. doi: 10.1002/1529-0131(199905)42:5<993::AID-ANR19>3.0.CO;2-U. [DOI] [PubMed] [Google Scholar]
- Orford C. R., Gardner D. L., O'Connor P. Ultrastructural changes in dog femoral condylar cartilage following anterior cruciate ligament section. J Anat. 1983 Dec;137(Pt 4):653–663. [PMC free article] [PubMed] [Google Scholar]
- Peterfy Charles G. Imaging of the disease process. Curr Opin Rheumatol. 2002 Sep;14(5):590–596. doi: 10.1097/00002281-200209000-00020. [DOI] [PubMed] [Google Scholar]
- Pond M. J., Nuki G. Experimentally-induced osteoarthritis in the dog. Ann Rheum Dis. 1973 Jul;32(4):387–388. doi: 10.1136/ard.32.4.387. [DOI] [PMC free article] [PubMed] [Google Scholar]
- Rubenstein J. D., Kim J. K., Morova-Protzner I., Stanchev P. L., Henkelman R. M. Effects of collagen orientation on MR imaging characteristics of bovine articular cartilage. Radiology. 1993 Jul;188(1):219–226. doi: 10.1148/radiology.188.1.8511302. [DOI] [PubMed] [Google Scholar]
- Rubenstein J. D., Li J. G., Majumdar S., Henkelman R. M. Image resolution and signal-to-noise ratio requirements for MR imaging of degenerative cartilage. AJR Am J Roentgenol. 1997 Oct;169(4):1089–1096. doi: 10.2214/ajr.169.4.9308470. [DOI] [PubMed] [Google Scholar]
- Stoop R., Buma P., van der Kraan P. M., Hollander A. P., Clark Billinghurst R., Robin Poole A., van den Berg W. B. Differences in type II collagen degradation between peripheral and central cartilage of rat stifle joints after cranial cruciate ligament transection. Arthritis Rheum. 2000 Sep;43(9):2121–2131. doi: 10.1002/1529-0131(200009)43:9<2121::AID-ANR24>3.0.CO;2-N. [DOI] [PubMed] [Google Scholar]
- Watson P. J., Carpenter T. A., Hall L. D., Tyler J. A. Cartilage swelling and loss in a spontaneous model of osteoarthritis visualized by magnetic resonance imaging. Osteoarthritis Cartilage. 1996 Sep;4(3):197–207. doi: 10.1016/s1063-4584(96)80016-1. [DOI] [PubMed] [Google Scholar]
- Xia Y., Farquhar T., Burton-Wurster N., Lust G. Origin of cartilage laminae in MRI. J Magn Reson Imaging. 1997 Sep-Oct;7(5):887–894. doi: 10.1002/jmri.1880070518. [DOI] [PubMed] [Google Scholar]
- Xia Y., Moody J. B., Alhadlaq H., Burton-Wurster N., Lust G. Characteristics of topographical heterogeneity of articular cartilage over the joint surface of a humeral head. Osteoarthritis Cartilage. 2002 May;10(5):370–380. doi: 10.1053/joca.2002.0523. [DOI] [PubMed] [Google Scholar]
- Xia Y., Moody J. B., Burton-Wurster N., Lust G. Quantitative in situ correlation between microscopic MRI and polarized light microscopy studies of articular cartilage. Osteoarthritis Cartilage. 2001 Jul;9(5):393–406. doi: 10.1053/joca.2000.0405. [DOI] [PubMed] [Google Scholar]
- Xia Y. Relaxation anisotropy in cartilage by NMR microscopy (muMRI) at 14-microm resolution. Magn Reson Med. 1998 Jun;39(6):941–949. doi: 10.1002/mrm.1910390612. [DOI] [PubMed] [Google Scholar]
- Xia Yang, Moody Jonathan B., Alhadlaq Hisham, Hu Jiani. Imaging the physical and morphological properties of a multi-zone young articular cartilage at microscopic resolution. J Magn Reson Imaging. 2003 Mar;17(3):365–374. doi: 10.1002/jmri.10269. [DOI] [PubMed] [Google Scholar]


