
Full Text
The Full Text of this article is available as a PDF (69.7 KB).
Figure 1.
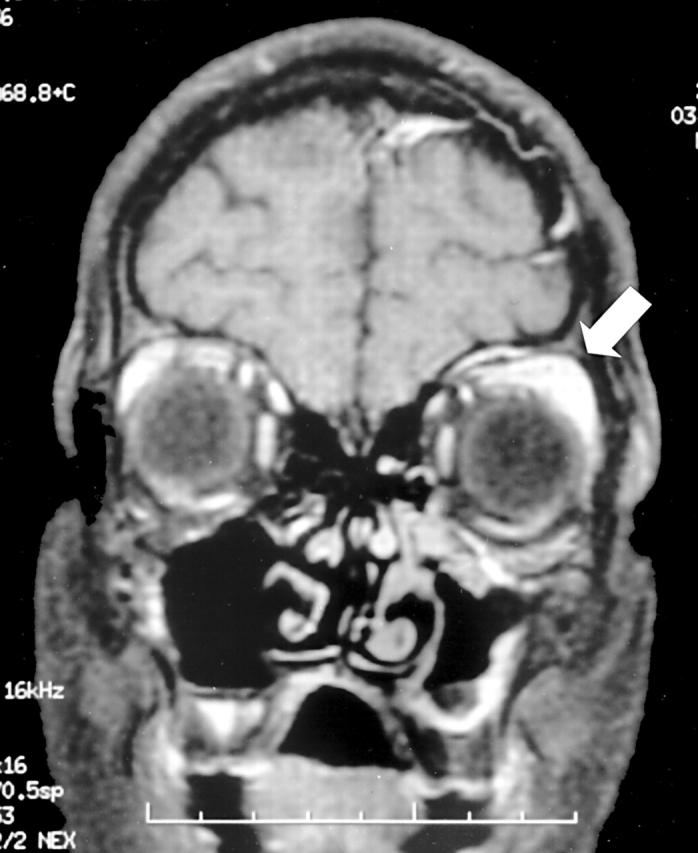
T1 fat saturated MRI scans of the orbits with contrast. There is an intermediate signal mass lesion superolaterally on the left (arrow), which enhances with contrast.
Official websites use .gov
A
.gov website belongs to an official
government organization in the United States.
Secure .gov websites use HTTPS
A lock (
) or https:// means you've safely
connected to the .gov website. Share sensitive
information only on official, secure websites.

The Full Text of this article is available as a PDF (69.7 KB).
T1 fat saturated MRI scans of the orbits with contrast. There is an intermediate signal mass lesion superolaterally on the left (arrow), which enhances with contrast.