Abstract
Patients and methods: 149 non-randomised patients with newly diagnosed RA in four groups were analysed: patients treated with (a) methotrexate (n = 56); (b) sulfasalazine (n = 55); (c) auranofin (n = 19); and (d) controls who were poor treatment responders (n = 19). Radiographs were quantified using the Larsen erosion score. The prediagnosis radiological progression from the onset of RA symptoms to diagnosis was calculated and compared with the observed progression rate during the first year after diagnosis while receiving DMARD treatment.
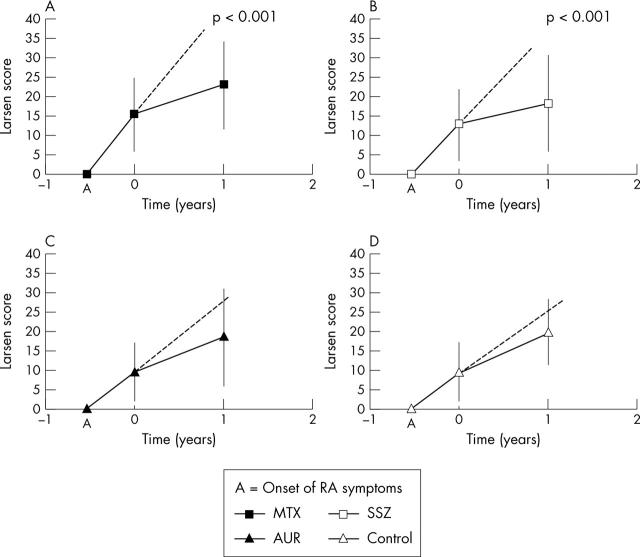
Results: Mean (SD) disease duration from onset of symptoms until diagnosis was 6.7 (4.0) months. Mean (SD) baseline Larsen score was 13.2 (9.3), giving a mean (SD) estimated prediagnosis progression rate of 23.6 (12.4) Larsen score units/year. Control and auranofin groups showed radiological progression after diagnosis similar to the progression predicted by prediagnosis progression rates. Patients receiving methotrexate or sulfasalazine showed a marked reduction (71% and 73%, respectively; p<0.001) in radiographic progression compared with prediagnosis progression.
Conclusions: Prediagnosis rates of radiological progression can be used quantitatively to obtain information on the potential efficacy of DMARDs, and indicate that methotrexate and sulfasalazine, but not auranofin, significantly retard radiographic damage in the first year after diagnosis.
Full Text
The Full Text of this article is available as a PDF (63.5 KB).
Figure 1.
Increment of Larsen score in the four different treatment groups: (A) MTX; (B) SSZ; (C) AUR; and (D) controls; means (SD) are shown. Prediagnosis radiological progression is represented as a straight line starting at the time of symptom onset. Estimated progression from baseline to year 1 is represented as a dotted line extending from the prediagnosis radiological progression. Actual observed radiological progression is represented as an unbroken line.


