Abstract
The virus-specific CD8+ T cell response has been analyzed through the development, effector, and recovery phases of primary and secondary influenza pneumonia. Apparently, most, if not all, memory T cells expressing clonotypic receptors that bind a tetrameric complex of influenza nucleoprotein (NP)366–374 peptide+H-2Db (NPP) are induced to divide during the course of this localized respiratory infection. The replicative phase of the recall response ends about the time that virus can no longer be recovered from the lung, whereas some primary CD8+NPP+ T cells may proliferate for a few more days. The greatly expanded population of CD8+NPP+ memory T cells in the lymphoid tissue of secondarily challenged mice declines progressively in mean prevalence over the ensuing 100 days, despite the fact that at least some of these lymphocytes continue to cycle. The recall of cell-mediated immunity thus is characterized by massive proliferation of the antigen-specific CD8+ set, whereas the extent of lymphocyte turnover in the absence of cognate peptide is variable, at a low level, and can be influenced by intercurrent infection.
The quantitation of cell-mediated immunity has been revolutionized by the recent development of tetrameric complexes of MHC class I glycoprotein + peptide (tetramers) for the direct staining and subsequent flow cytometric analysis of virus-specific CD8+ T cells (1). The results with the tetramers (2–4) suggest that the magnitude of both the acute response and long-term CD8+ T cell memory has been grossly underestimated by the earlier, microcloning limiting dilution analysis, which required cytotoxic T lymphocyte precursors (CTLp) to undergo 10–15 cycles of replication before reading out as CTL effectors in a 51Cr release assay (4–7). However, it is still unclear whether limiting dilution analysis or tetramer staining offers a better estimate of the functional T cell memory that can be recalled after a repeat exposure to antigen (4). If, as suggested by earlier studies by using ionizing radiation (8), memory CTLp must divide further before mounting an effective secondary response, simply measuring the numbers of tetramer+ CD8+ T cells might be illusory.
Mice that first are immunized with an H1N1 influenza A virus and then challenged intranasally (i.n.) with an H3N2 virus that shares the immunodominant nucleoprotein (NP366–374) epitope show a massive increase (3) in the numbers of virus-specific CD8+ T cells detected by direct staining with a tetrameric complex of H-2Db+NP366–374 (NPP). The present analysis defines the extent of lymphocyte proliferation for CD8+NPP+ T cells recovered from the lymphoid tissue and the site of pathology in the lung, following both primary and secondary challenge with the HKx31 influenza A virus. The prevalence, and further turnover, of these virus-specific CD8+ T cells then is followed into long-term memory.
MATERIALS AND METHODS
Virus Infection and Tissue Sampling.
Female C57BL/6J (B6) mice were infected i.n. (9) with 106.8 EID50 (50% infectious dose for chicken embryos) of the HKx31 influenza A virus (10) or i.p. with 107.9 EID50 of the A/PR8/34 (PR8) virus. The surface hemagglutinin (H) and neuraminidase (N) molecules of these H1N1 (PR8) and H3N2 (HKx31) viruses do not generate cross-reactive neutralizing antibodies, but the internal components (including NP366–374) are shared. Some of the influenza A virus-primed mice were challenged later with 105.7 EID50 of the B/Hong Kong/73 (B/HK) influenza B virus or with 103 pfu of Armstrong 53B lymphocytic choriomeningitis virus (LCMV). Mediastinal lymph node (MLN), spleen, and bronchoalveolar lavage (BAL) populations were obtained and processed for flow cytometric analysis as described previously (3, 9). The lungs were frozen (−70°C) and later homogenized for virus isolation by allantoic inoculation in embryonated hen’s eggs (9). Virus titers are expressed as log10 EID50.
Analysis of Lymphocyte Prevalence and Proliferation.
The mice used in the lymphocyte proliferation studies were “pulsed” with BrdUrd at 0.8 mg/ml in sterile drinking water, given at various times after infection. The water containing BrdUrd (Sigma) was protected from light and changed daily. The animals then were switched to normal drinking water for the “chase” experiments analyzing the disappearance of this thymidine analogue. Lymphocyte populations recovered from the MLN, spleen, and BAL were identified by using the NPP influenza tetramer or the H-2Db+ NP396–404 LCMV tetramer (2, 3). Cell surface Fc receptors were blocked by using purified anti-mouse CD16/CD32 Fc-RIII/II receptor (PharMingen). The lymphocytes were incubated with the tetramer for 1 h at room temperature, followed by FITC-conjugated anti-CD8+ (53-6.7; PharMingen) for 30 min on ice, and then stained for intracellular BrdUrd (11). The cells were resuspended in 0.5 ml of ice-cold PBS, fixed by the addition of 1.2 ml of ice-cold ethanol, and held for 30 min on ice before washing and permeabilization in PBS + 1% paraformaldehyde + 0.01% Tween 20 for 1 hr at room temperature. They then were washed again and incubated with 50 Kunitz units of DNase (Sigma) for 10 min at 37°C. After further washing, the samples were incubated with anti-BrdUrd-FITC (Becton Dickinson) for 30 min at room temperature, washed again, and analyzed on a FACScan using Cell Quest software (Becton Dickinson). The analysis involved gating on total CD8+ T cells or CD8+ T cells that stain with the NPP tetramer. At least 500 events were collected in each gate for statistical analysis. The samples were pooled before analysis if too few lymphocytes were recovered from individual mice. In each experiment, a group of control mice that were not given water-containing BrdUrd was included to set a background of BrdUrdlo cells.
RESULTS
Most of the experiments that follow use respiratory challenge (3, 9) with the HKx31 (H3N2) influenza A virus. The B6 (H-2b) mice were either immunologically naive (primary) or had been exposed i.p. to a high dose of the PR8 (H1N1) virus at least 1 month previously (secondary).
Antigen Challenge and T Cell Numbers.
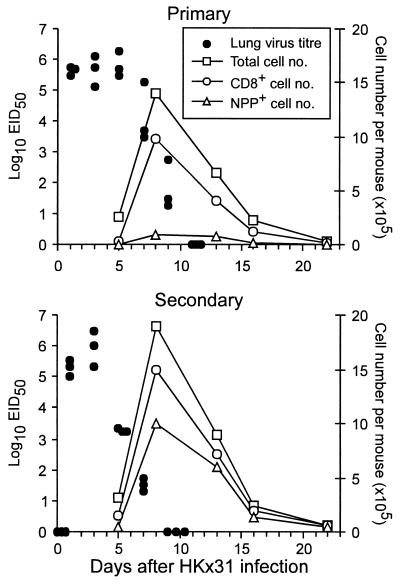
The HKx31 virus replicated initially to the same extent in naive and PR8-primed mice, but was controlled 2–3 days more rapidly in the latter group (compare primary and secondary lung titers; Fig. 1). Though the total magnitude of the lymphocyte populations obtained by BAL of the pneumonic lung (Fig. 1) and the numbers of CD8+ T cells (Fig. 1) did not differ greatly after primary or secondary challenge, the prevalence of infiltrating CD8+NPP+ T cells (Fig. 1) was much higher in the mice that previously had been exposed to the PR8 virus. The inflammatory pathology in the respiratory tract resolved rapidly subsequent to the clearance of infectious virus, with the magnitude of the cellular infiltrate being reduced to very low levels by day 22 after challenge (Fig. 1).
Figure 1.
Comparison of virus clearance and the acute response in the BAL after primary or secondary challenge with the HKx31 influenza A virus. Naïve (Primary) or PR8 (H1N1)-immune (Secondary) mice were infected i.n. with the HKx31 (H3N2) virus. The BAL samples from each group (n = 5–6) were pooled, stained for surface CD8 and NPP tetramer, and analyzed by flow cytometry. The BAL cell counts per mouse (□) were used, together with the flow cytometry data, to calculate average numbers for the total CD8+ (○) and NPP+ T cells (▵). Lung virus titers were determined as log10EID50 for groups of three mice (●).
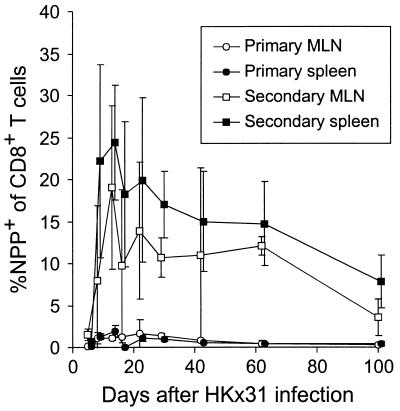
The counts for CD8+NPP+ T cells in lymphoid tissue reached maximum values of <3% (for the CD8+ set) in the regional MLN or spleen after primary exposure to the HKx31 virus (Fig. 2, primary). After secondary challenge of the PR8-primed mice, however, the NPP+ population comprised as many as 30% of the CD8+ T cells in the spleen, with frequencies as high as 10% persisting for 100 days (Fig. 2, secondary). In a further set of experiments, the spleen and MLN populations from secondarily challenged mice were stimulated in vitro with the NPP366–374 peptide and then stained for cytoplasmic IFN-γ. This protocol has been shown previously (2, 3) to parallel the results for tetramer staining and confirms that these long-term memory T cells can be recalled to function, at least from the aspect of IFN-γ production (see Fig. 2 legend).
Figure 2.
Long-term quantitation of CD8+NPP+ T cells in the MLN and spleen. Groups of naïve (primary) or PR8-immune (secondary) mice were analyzed through the acute and memory stages of the immune response to the HKx31 virus. The values were determined for three to five individual mice at each time point. The results show the mean ± SD of percentage of NPP+ within the CD8+ set. A further set of experiments in which CD8+ T cells from secondarily challenged mice were stimulated in vitro with the NP366–374 peptide in the presence of brefeldin A and then fixed and stained for the presence of cytoplasmic IFN-γ (2, 3) gave values for the MLN and spleen, respectively, of: day 29, 13 ± 1, 15 ± 10; day 42, 10 ± 10, 17 ± 5; day 62, 17 ± 9, 10 ± 9; day 100, 2 ± 1; 7 ± 4.
Proliferation of the CD8+NPP+ Population.
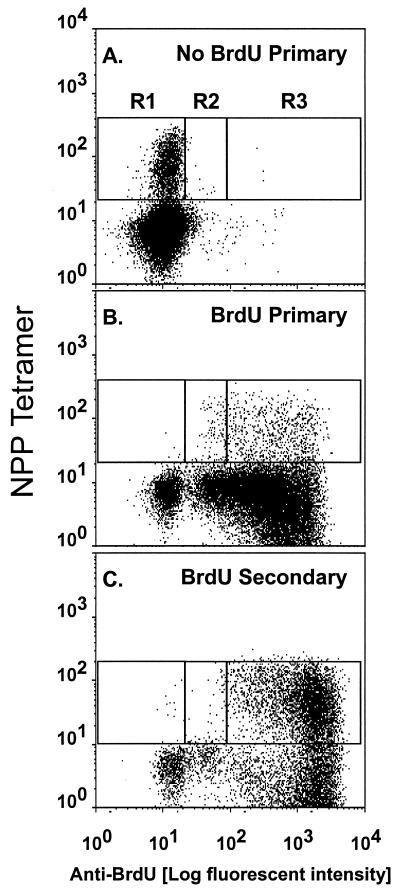
Quantifying CD8+ T cell numbers (Figs. 1 and 2) gives an estimate of the magnitude of the cellular immune response, but offers only limited insight into the extent of clonal expansion and loss. Here, lymphocyte proliferation has been analyzed by feeding mice drinking water containing BrdUrd through a protracted “pulse” period and then staining and analyzing in three-color mode for the concurrent binding of NPP and mAbs to CD8 and BrdUrd. Virus-specific CD8+NPP+ T cells that have replicated in the presence of BrdUrd stain brightly (BrdUrdhi), whereas those that have incorporated BrdUrd and then continue to proliferate through a “chase” in the absence of this thymidine analogue will progressively revert to being BrdUrdlo. Typical BrdUrd “pulse” profiles are illustrated in Fig. 3 for BAL populations (>70% CD8+) obtained at 8 days after primary or secondary HKx31 challenge. No significant staining was seen for CD8+ T cells from mice that had not been fed BrdUrd through the course of primary exposure to the HKx31 virus, establishing that the mAb to BrdUrd does not bind nonspecifically to these highly activated inflammatory T cells (Fig. 3A, R1). The great majority of BAL CD8+ T cells from mice that had been given BrdUrd stained brightly (BrdUrdhi) at day 8 (Fig. 3 B and C, R3). The presence of smaller numbers of CD8+NPP+ lymphocytes showing evidence of an intermediate (BrdUrdint) level of incorporation into DNA (Fig. 3 B and C, R2) indicates that these lymphocytes have cycled less. Even so, it seemed that all the CD8+NPP+ T cells that localized to the pneumonic lung on day 8 had divided at least once after primary or secondary challenge.
Figure 3.
Profiles of in vivo BrdUrd incorporation for the BAL CD8+ populations recovered from naïve or PR8-immune mice at 8 days after respiratory challenge with the HKx31 virus. Groups of 10 immunologically naive (A and B) or PR8-immune (C) mice were infected i.n. with 106.8 EID50 of HKx31. One group of 10 naïve mice was placed on normal drinking water (A), and all other mice were given BrdUrd for 8 days from the time of infection (B and C). The BAL cells were pooled from groups of five mice, depleted of macrophages by adherence to plastic, surface-stained with the NPP tetramer and anti-CD8, and then fixed and stained for BrdUrd. The FACS profiles were gated on CD8+ T cells in the lymphoblast gate. R1 is the background staining for BrdUrd that was determined in the group not given BrdUrd water. R3 contains BrdUrdhi CD8+NPP+ and R2 contains BrdUrdint (intermediate) CD8+NPP+ T cells.
Pulse–Chase Analysis of the Recall and Primary Responses.
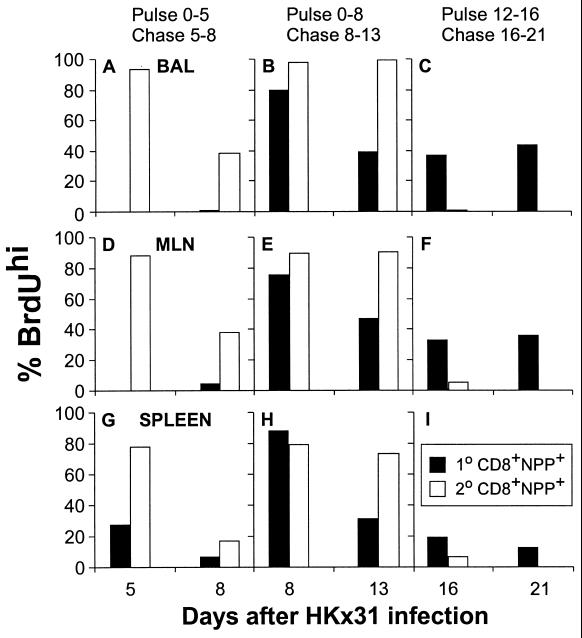
The findings for a series of these experiments are summarized (Fig. 4) for the BrdUrdhi “R3” region identified in Fig. 3. The profiles for the recall response are discussed first (Fig. 4, secondary) because the numbers of CD8+NPP+ cells are higher (Figs. 1 and 2). The pulse experiments suggest that >80% of the CD8+NPP+ T cells in BAL, MLN, and spleen of PR8-primed mice have gone through multiple cycles of replication by day 5 after secondary challenge with the HKx31 virus (Fig. 4, ADG). Furthermore, comparison of the findings for the chase period from days 5–8 (Fig. 4, ADG) and the pulse from days 0–8 (Fig. 4, BEH) indicates that some of these memory CD8+NPP+ T cells continue to proliferate for a minimum of another 3 days. Little evidence of further replication, however, is apparent for the days 8–13 chase (Fig. 4, BEH) or the days 12–16 pulse (Fig. 4, CFI), a result confirmed in a further experiment in which naïve and primed mice were fed BrdUrd water from 9 to 13 days after infection (data not shown). Thus, the massive increase in the numbers of CD8+NPP+ T cells that can be shown for both the BAL and the lymphoid tissue from these secondarily challenged mice (Figs. 1 and 2) is substantially a result of the proliferative events that occur during the antigen-driven (Fig. 1) phase of the response.
Figure 4.
Profiles of BrdUrd incorporation and loss for CD8+NPP+ T cells recovered from the MLN, spleen, and BAL of naïve and PR8 memory mice challenged with the HKx31 virus. Groups of naive (primary, 1°) or PR8-immune (secondary, 2°) B6 animals were given BrdUrd drinking water at the time of infection with HKx31 until day 5 (A, D, and G) or day 8 (B, E, and H), and then half the mice were sampled. The remaining mice were placed on normal drinking water for 3 days (A, D, and G) or 5 days (B, E, and H) and then sampled. Other mice (C, F, and I) were given BrdUrd water from day 12 postinfection and either sampled on day 16 or maintained on normal water until day 21. The CD8+ T cells were enriched from the MLN and spleen of five individual mice per group per time point. The BAL cells were collected and pooled from five mice per group. Samples were gated on the CD8+NPP+ (1°, solid bar; 2°, open bar) or T cells and analyzed for BrdUrd staining. The SD values for individuals are not shown for clarity of the figure.
The prevalence of the CD8+NPP+ set on day 5 of the primary response is too low to allow useful determinations to be made (Fig. 4, ADG). By day 8, however, the CD8+NPP+ T cells are sufficiently numerous to permit the analysis of BrdUrd staining profiles (Fig. 4, BEH). As in the secondary response, the great majority of these lymphocytes showed evidence of high levels of BrdUrd incorporation. Both the chase from days 8–13 (Fig. 4, BEH) and the pulse from days 12–16 (Fig. 4, CFI) indicated that at least some virus-specific CD8+ T cells continue to divide subsequent to day 12, after infectious virus is cleared from the respiratory tract (Fig. 1). A repeat experiment (data not shown) supported the impression that there is substantial incorporation of BrdUrd in the CD8+NPP+ T cells recovered from the BAL (74%), MLN (72 ± 1.4%), and spleen (58 ± 22%) through the days 9–13 interval after primary infection. Prior analysis of the primary response by using light-induced “suicide” of lymphocytes incorporating BrdUrd followed by limiting dilution analysis (12) also suggested that the proliferation of influenza virus-specific CD8+ T cells continues beyond what would be predicted from the profile of virus recovery. Antigen may, however, still be present through this interval. Influenza RNA can be detected for a few days longer than virus (13), whereas experiments with a different model of localized respiratory infection in the mouse indicated that the same is true for dendritic cells presenting epitopes of Sendai virus (14).
Persistence of the BrdUrdhiCD8+NPP+ T Cells.
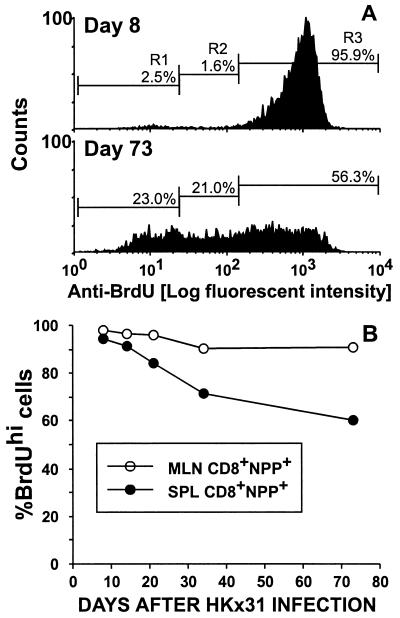
Mice primed with the PR8 virus were challenged i.n. with HKx31, fed water containing BrdUrd for 8 days, and analyzed sequentially thereafter. Typical BrdUrd staining profiles for splenic CD8+NPP+ T cells sampled after the 8-day pulse or a 65-day chase (day 73) are illustrated in Fig. 5A. Though measuring BrdUrd loss does not allow accurate quantitation of the extent of lymphocyte turnover, there was clearly a substantial shift from BrdUrdhi (R3) to BrdUrdint (R2) during this interval. The results (Fig. 5A, R3) also indicate that many CD8+NPP+ clones cycled only a few times (or not at all) over the 9-week chase period, whereas others divided to the extent that they no longer stained for BrdUrd (Fig. 5A, R1). Almost all the CD8+NPP+ cells in the regional MLN remained consistently BrdUrdhi for 73 days after the cessation of BrdUrd feeding (Fig. 5B). In contrast, the frequency of the BrdUrdhi cells in the CD8+NPP+ set fell to 70% in the spleen by day 73 (Fig. 5B), suggesting that the continued turnover of “resting” memory CD8+ T cells occurs primarily in the spleen. Because of the relative sizes of the BAL, MLN, and splenic lymphoid populations, there will always be many more CD8+ memory T cells in the spleen. Any “dilution” of the BrdUrdhi set as a consequence of further proliferation will tend to be “buffered” in this site. Also, the influenza-specific memory CD8+ T cells detected by limiting dilution analysis remain CD62Llo for at least 6 months (15) and thus are excluded from the normal recirculation pathway via the high endothelial venules of the lymph nodes (16). This constraint does not apply in the spleen: the spleen probably provides a better “window” on the memory T cell pool.
Figure 5.
Long-term turnover of virus-specific CD8+ T cells that proliferated during the course of the acute infection. The PR8-immune mice were infected i.n. with the HKx31 virus and given BrdUrd in the drinking water for 8 days, beginning on the day of secondary challenge. Thereafter, they were maintained on normal water. Typical BrdUrd-staining profiles for this pulse–chase analysis are presented for the CD8+NPP+ set recovered from the spleens of individuals sampled at 8 or 73 days after exposure to the HKx31 virus (A). The results presented in B are mean ± SD values for groups of four mice assayed at the end of the day 8 pulse and at 2, 3, 5, and 10 weeks after infection.
Challenge with Different Viruses.
A further set of experiments analyzed the possibility that intercurrent infection may induce some memory CD8+ T cells to enter the cell cycle. The relative prevalence of BrdUrdhiCD8+NPP+ T cells increased significantly in the spleens of BrdUrd-pulsed mice after i.n. challenge with an influenza B virus (B/HK), or i.v. exposure to LCMV (Table 1). The converse experiment (HKx31 → LCMV-primed mice) gave the same result (Table 1). The effect was greater for the challenge with LCMV, which, unlike B/HK and HKx31, grows extensively in the lymphoid tissue. However, even if there is a measure (Table 1) of “bystander,” cross-reactive, or cytokine-induced cell division (2, 17–21), it is very clear that exposure to the cognate peptide is the major determinant of in vivo proliferation for CD8+ memory T cells (compare Fig. 4 with Table 1).
Table 1.
Prevalence of BrdUhi CD8+ memory T cells in spleen 8 days after challenge with unrelated viruses
| Priming virus* | Challenge†
|
Tetramer‡ | % BrdUhi CD8+§ tetramer+ | |
|---|---|---|---|---|
| Virus | Route | |||
| PR8 → HK × 31 | Nil | NPP | 7 ± 2 | |
| B/HK | i.n. | NPP | 15 ± 2¶ | |
| LCMV | i.v. | NPP | 29 ± 7¶ | |
| LCMV | Nil | LCMV | 12 ± 3 | |
| HK × 31 | i.n. | LCMV | 19 ± 2¶ | |
Naïve B6 mice were primed i.p. with 107.9 EID50 of the PR8 influenza A virus and then given 106.8 EID50 of the HK × 31 virus i.n. 4 weeks later or infected i.v. with 103 pfu of the Armstrong strain of LCMV. The mice were held for 5–11 weeks before challenge.
Mice were challenged i.n. with 105.7 EID50 of the B/HK influenza B virus, i.v. with 103 pfu of LCMV, or i.n. with 106.8 EID50 of the HK × 31 influenza A virus. Unchallenged immune controls (Nil) were used to determine the prevalence of BrdUhi CD8+ tetramer+ T cells in “resting” spleen.
Virus-specific CD8+ T cells were stained with the Dd-NP366-374 (NPP) or the Db-LCMV NP396-404 (2) tetramers.
The percentage of CD8+ tetramer+ T cells that were BrdUhi (R3 region of Fig. 3) was determined after feeding water that contained BrdU for 8 days. The results show the mean ± SD for at least five individual mice, compiled from two experiments (bottom two lines) or from a contemporary comparison (top three lines).
P < 0.01 compared with the unchallenged group (Nil). The data were analyzed with the Mann–Whitney U test.
DISCUSSION
The present experiments establish that there is extensive cell division during the course of both primary and secondary CD8+ T cell responses in conventional mice. This resolves an old controversy about the extent of lymphocyte replication during the recall phase of cell-mediated immunity (8, 22–27). The perception that both conventional and T cell receptor (TCR) transgenic CD8+ memory T cells undergo multiple cycles of division after adoptive transfer and exposure to antigen (20, 21, 28–30) is equally valid for normal, unmanipulated animals. Overall, the results support the related postulates that the presence of antigen is the key factor driving clonal expansion and that the size of the memory T cell population is broadly reflective of the extent of lymphocyte proliferation during the antigen-driven phase (31).
Considering both the magnitude of the increase in virus-specific CD8+ T cell numbers and the profiles for BrdUrd incorporation, it seems reasonable to suggest that the great majority of the memory CD8+NPP+ T cells remaining a month or more after the resolution of the primary response to an influenza A virus are not terminally differentiated and proliferate after secondary challenge. This goes some way to addressing questions concerning the correlation between tetramer-staining profiles and functional T cell memory (4). The influenza A viruses cause substantial localized infections in the mammalian respiratory tract, with lymphocyte stimulation in the regional lymph nodes and spleen thought to result largely from exposure to antigen-presenting dendritic cells that have migrated to the lymphoid tissue (14, 32). It is now obvious that this level of antigenic exposure is sufficient to drive massive clonal expansion well beyond the numbers that function effectively after the initial encounter with the pathogen. The recall response thus seems to be greatly surplus to requirements and not particularly fine-tuned. Many of these excess CD8+ T cells are removed in the liver (33, 34).
Some of the BrdUrdhiCD8+NPP+ T cells that proliferate during the antigen-driven phase of the response survive for at least 100 days without dividing further, whereas others cycle to varying extents. The “chase” profiles shown here for the BrdUrdhi CD8+ NPP+ set are, in fact, similar to those described previously for CD44hi T cells (11) and for adoptively transferred, TCR-transgenic lymphocytes (29). The obvious difference between the TCR-transgenic studies and the present analysis is that the NPP-specific CD8+ T cells utilize a very diverse spectrum of TCRαβ pairs (35). Much of the variability in long-term turnover rates shown here for the memory CD8+NPP+ set thus could be considered to reflect differences in TCR avidity/affinity for MHC class I glycoproteins presenting other non-self- and self-peptides, an interaction that may be essential for the maintenance of CD8+ T cell memory (30). It is clearly of interest to determine whether these profiles of continuing T cell proliferation, and inevitable loss, will gradually narrow the spectrum of TCR expression for this set of memory T cells.
The availability of the tetramer-staining reagents has allowed analysis of the prevalence, localization, and proliferation status of both antigen-stimulated and resting CD8+ T cells during the development, effector, recovery, and long-term memory phases of an immune response with a precision that was formerly impossible. Even so, it is very important to recognize the inherent limitations of these experiments, which preclude putting too fine a point on some of the numbers that are generated. The apparent anatomical distribution profiles are a function of the kinetics and magnitude of cell division, localization, exit, and death. The present data allow insight into the extent of proliferation and the size of antigen-specific CD8+ T cell populations, by providing what might best be thought of as “snapshots” of a site of pathology or a particular lymphoid tissue. Addressing the question of “rates” still remains problematic in the absence of a technology that allows “real-time” analysis of cell movement between different anatomical compartments. Understanding the nature of homeostatic control in this diffuse organ system continues to offer major challenges (5, 36, 37).
Acknowledgments
We thank Kristen Branum for expert technical assistance, Dr. Ann-Marie Hamilton-Easton for advice on flow cytometry, Vicki Henderson for clerical assistance, and Dr. Ken Shortman and Dr. Allan Randrup Thomsen for critical reading of the manuscript. The LCMV strain was provided by Dr. Rafi Ahmed of Emory University. These experiments were supported by U.S. Public Health Service Grants AI29579, AI38359, AI37597, and CA21765 and by the American Syrian Lebanese Associated Charities. J.P.C. is the recipient of a fellowship from the Alfred Benson Foundation, Denmark.
ABBREVIATIONS
- BAL
bronchoalveolar lavage
- B/HK
B/Hong Kong/73 influenza B virus
- EID50
50% infectious dose for chicken embryos
- H
N, and NP, influenza virus hemagglutinin, neuraminidase, and nucleoprotein
- HKx31and PR8
H3N2 and H1N1 influenza A viruses
- LCMV
lymphocytic choriomeningitis virus
- NPP
tetrameric complex of H-2Db+NP366–374 peptide
- i.n.
intranasally
- MLN
Mediastinal lymph node
- TCR
T cell receptor
References
- 1.Altman J D, Moss P A H, Goulder P J R, Barouch D H, McHeyzer-Williams M G, Bell J I, McMichael A J, Davis M M. Science. 1996;274:94–96. [PubMed] [Google Scholar]
- 2.Murali-Krishna K, Altman J D, Suresh M, Sourdive D J, Zajac A J, Miller J D, Slansky J, Ahmed R. Immunity. 1998;8:177–187. doi: 10.1016/s1074-7613(00)80470-7. [DOI] [PubMed] [Google Scholar]
- 3.Flynn K J, Belz G T, Altman J D, Ahmed R, Woodland D L, Doherty P C. Immunity. 1998;8:683–691. doi: 10.1016/s1074-7613(00)80573-7. [DOI] [PubMed] [Google Scholar]
- 4.McMichael A J, O’Callaghan C A. J Exp Med. 1998;187:1367–1371. doi: 10.1084/jem.187.9.1367. [DOI] [PMC free article] [PubMed] [Google Scholar]
- 5.Doherty P C, Topham D J, Tripp R A. Immunol Rev. 1996;150:23–44. doi: 10.1111/j.1600-065x.1996.tb00694.x. [DOI] [PubMed] [Google Scholar]
- 6.Mullbacher A, Flynn K. Immunol Rev. 1996;150:113–127. doi: 10.1111/j.1600-065x.1996.tb00698.x. [DOI] [PubMed] [Google Scholar]
- 7.Ahmed R, Gray D. Science. 1996;272:54–59. doi: 10.1126/science.272.5258.54. [DOI] [PubMed] [Google Scholar]
- 8.Rouse B T, Hartley D, Doherty P C. Viral Immunol. 1989;2:69–78. doi: 10.1089/vim.1989.2.69. [DOI] [PubMed] [Google Scholar]
- 9.Allan W, Tabi Z, Cleary A, Doherty P C. J Immunol. 1990;144:3980–3986. [PubMed] [Google Scholar]
- 10.Kilbourne E D. Bull W H O. 1969;41:643–645. [PMC free article] [PubMed] [Google Scholar]
- 11.Tough D F, Sprent J. J Exp Med. 1994;179:1127–1135. doi: 10.1084/jem.179.4.1127. [DOI] [PMC free article] [PubMed] [Google Scholar]
- 12.Tripp R A, Lahti J M, Doherty P C. J Immunol. 1995;155:3719–3721. [PubMed] [Google Scholar]
- 13.Eichelberger M C, Wang M, Allan W, Webster R G, Doherty P C. J Gen Virol. 1991;72:1695–1698. doi: 10.1099/0022-1317-72-7-1695. [DOI] [PubMed] [Google Scholar]
- 14.Usherwood E J, Hogg T L, Woodland D L. J Immunol. 1999;162:3350–3355. [PubMed] [Google Scholar]
- 15.Tripp R A, Hou S, Doherty P C. J Immunol. 1995;154:5870–5875. [PubMed] [Google Scholar]
- 16.Picker L J. Curr Opin Immunol. 1994;6:394–406. doi: 10.1016/0952-7915(94)90118-x. [DOI] [PubMed] [Google Scholar]
- 17.Tripp R A, Hou S, McMickle A, Houston J, Doherty P C. J Immunol. 1995;154:6013–6021. [PubMed] [Google Scholar]
- 18.Tough D F, Borrow P, Sprent J. Science. 1996;272:1947–1950. doi: 10.1126/science.272.5270.1947. [DOI] [PubMed] [Google Scholar]
- 19.Zarozinski C C, Welsh R M. J Exp Med. 1997;185:1629–1639. doi: 10.1084/jem.185.9.1629. [DOI] [PMC free article] [PubMed] [Google Scholar]
- 20.Ehl S, Hombach J, Aichele P, Hengartner H, Zinkernagel R M. J Exp Med. 1997;185:1241–1251. doi: 10.1084/jem.185.7.1241. [DOI] [PMC free article] [PubMed] [Google Scholar]
- 21.Zhang X, Sun S, Hwang I, Tough D F, Sprent J. Immunity. 1998;8:591–599. doi: 10.1016/s1074-7613(00)80564-6. [DOI] [PubMed] [Google Scholar]
- 22.Rollinghoff M, Wagner H, Ovary Z. Proc Soc Exp Biol Med. 1976;151:348–350. doi: 10.3181/00379727-151-39207. [DOI] [PubMed] [Google Scholar]
- 23.Mitchison N A, Pettersson S. Ann Immunol. 1983;134D:37–45. doi: 10.1016/s0769-2625(83)80054-3. [DOI] [PubMed] [Google Scholar]
- 24.Kimura A K, Wigzell H. J Immunol. 1983;130:2056–2061. [PubMed] [Google Scholar]
- 25.Hamann U, Eichmann K, Krammer P H. J Immunol. 1983;130:7–14. [PubMed] [Google Scholar]
- 26.Allan J E, Doherty P C. Scand J Immunol. 1985;22:367–374. doi: 10.1111/j.1365-3083.1985.tb01894.x. [DOI] [PubMed] [Google Scholar]
- 27.Denizot F, Wilson A, Battye F, Berke G, Shortman K. Proc Natl Acad Sci USA. 1986;83:6089–6092. doi: 10.1073/pnas.83.16.6089. [DOI] [PMC free article] [PubMed] [Google Scholar]
- 28.Lau L L, Jamieson B D, Somasundaram T, Ahmed R. Nature (London) 1994;369:648–652. [Google Scholar]
- 29.Zimmermann C, Brduscha-Reim K, Blaser C, Zinkernagel R M, Pircher H. J Exp Med. 1996;183:1367–1375. doi: 10.1084/jem.183.4.1367. [DOI] [PMC free article] [PubMed] [Google Scholar]
- 30.Tanchot C, Lemonnier F A, Perarnau B, Freitas A A, Rocha B. Science. 1997;276:2057–2062. doi: 10.1126/science.276.5321.2057. [DOI] [PubMed] [Google Scholar]
- 31.Hou S, Hyland L, Ryan K W, Portner A, Doherty P C. Nature (London) 1994;369:652–654. doi: 10.1038/369652a0. [DOI] [PubMed] [Google Scholar]
- 32.Hamilton-Easton A, Eichelberger M. J Virol. 1995;69:6359–6366. doi: 10.1128/jvi.69.10.6359-6366.1995. [DOI] [PMC free article] [PubMed] [Google Scholar]
- 33.Wack A, Corbella P, Harker N, Crispe I N, Kioussis D. Eur J Immunol. 1997;27:577–583. doi: 10.1002/eji.1830270302. [DOI] [PubMed] [Google Scholar]
- 34.Belz G T, Altman J D, Doherty P C. Proc Natl Acad Sci USA. 1998;95:13812–13817. doi: 10.1073/pnas.95.23.13812. [DOI] [PMC free article] [PubMed] [Google Scholar]
- 35.Deckhut A M, Allan W, McMickle A, Eichelberger M, Blackman M A, Doherty P C, Woodland D L. J Immunol. 1993;151:2658–2666. [PubMed] [Google Scholar]
- 36.Sprent J, Tough D F, Sun S. Immunol Rev. 1997;156:79–85. doi: 10.1111/j.1600-065x.1997.tb00960.x. [DOI] [PubMed] [Google Scholar]
- 37.Tanchot C, Rosado M M, Agenes F, Freitas A A, Rocha B. Semin Immunol. 1997;9:331–337. doi: 10.1006/smim.1997.0090. [DOI] [PubMed] [Google Scholar]


