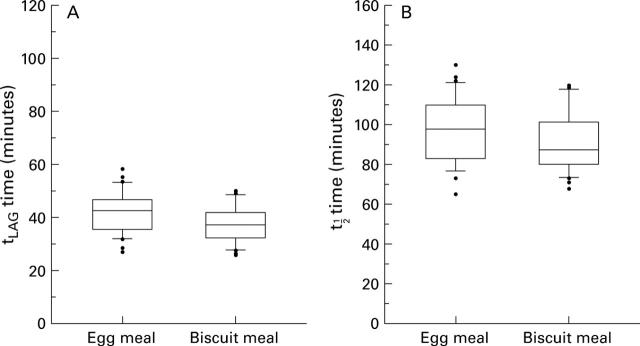
Figure 4 .
Distribution of tLAG (A) and t1/2 (B) using [13C]S platensis in an egg meal and in a biscuit meal in 27 healthy subjects, shown as median values (bars), interquartile ranges (boxes), range from 10th to 90th percentiles (bar caps), and observed data over 10th to 90th percentiles (dots). Note the good agreement between results from the two meals.

