Abstract
We have studied the elasticity and pressure–density equation of state of MgO in diamond cells to 55 GPa and have doubled the previous pressure limit of accurate elasticity determinations for crystals. Integrating single-crystal velocity data from Brillouin scattering measurements and density data from polycrystalline x-ray diffraction, we obtained the three principal elastic tensor elements (C11, C12, and C44) and various secondary elasticity parameters, including single-crystal elastic anisotropy, Cauchy relation, aggregate sound velocities, and Poisson's ratio, as functions of pressure. The present study also provides a direct determination of pressure without recourse to any prior pressure standard, thus creating a primary pressure scale. The commonly used ruby fluorescence pressure scale has thus been improved to 1% accuracy by the new MgO scale.
Elasticity, the fourth-rank tensor defining the strain of crystalline solids under stress (1), contains key parameters relating the microscopic bonding properties to the macroscopic mechanical behaviors of the solid under compression. The study of elasticity under high pressure has wide applications in fields ranging from crystal physics to seismology (2). Direct experimental measurements of the tensor elements, however, have previously been limited to 32 GPa (3)—above this pressure our knowledge has been derived from theoretical predictions, extrapolations of lower pressure data, or indirect measurements with assumed stress/strain conditions (4). In the present study, we extend measurements of the elasticity of MgO, an archetypal oxide with the simple NaCl-type (B1) crystal structure, to 55 GPa at 300 K.
MgO has been the subject of extensive theoretical and experimental investigations (5–17) that have revealed the fundamental bonding properties in this class of materials. With the wealth of available data, MgO is often used as a test ground for new theories, new experiments, and even as a pressure calibration standard for high-pressure, high-temperature experimentation (18, 19). Moreover, MgO is a major component in the Earth's lower mantle (20, 21), and knowledge of its high-pressure behavior is crucial for understanding deep Earth geophysics. The crystal structure and volume compression of polycrystalline MgO samples without pressure media have been studied with x-ray diffraction in diamond cells up to 227 GPa (7, 22, 23). MgO in the B1 structure is stable over the entire pressure range. Nonhydrostatic conditions in these measurements, however, may introduce systematic deviations in pressure of up to 10% in the pressure–density equations of state (22–24). Ultrasonic and Brillouin scattering studies of single-crystal MgO (8, 16, 25) have yielded detailed information on its elastic tensor, anisotropy, and aggregate shear and bulk moduli, but have been limited to a maximum pressure of 18.6 GPa. Evidence for nonhydrostaticity has also been found in previous Brillouin scattering experiments at pressures exceeding the hydrostatic limits of the pressure media used in these studies (25, 26). Here we report an extensive elasticity study of MgO to 55 GPa using helium as a pressure medium (helium has the lowest shear strength among all solids and provides nearly hydrostatic conditions).
An accurate pressure determination is central to all high-pressure experiments. The commonly used ruby fluorescence pressure scale has high intrinsic precision (±0.5% under hydrostatic conditions), but low accuracy (±5%) because it is a secondary scale calibrated by primary standards deduced from high-temperature shock-wave data (27, 28). Uncertainties in shock-wave measurements, strengths of samples, assumptions of the volume dependence of the Grüneisen parameter, and the one-dimensional nature of shock waves all add to the uncertainty of the ruby scale. Alternatively, it is possible to develop a primary pressure scale by combining direct measurements of elasticity and density, but until recently this has been limited to very low pressures (29). Recent integration of Brillouin scattering and x-ray diffraction techniques has provided a direct pressure determination to 32 GPa (3), and demonstrated good agreement between the ruby scale and Brillouin/x-ray measurements over this range. In the present study, the primary hydrostatic pressure scale is extended to 55 GPa with the integration of Brillouin scattering and x-ray diffraction data for MgO, which is an ideal calibration material because of its high crystallographic symmetry and its wide range of stability.
Experimental Measurements
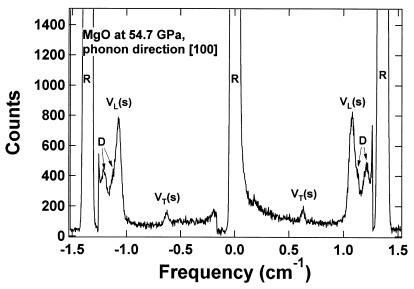
High-pressure elastic properties of single-crystal MgO were measured at 300 K with a Brillouin scattering system and a method similar to that described by Zha et al. (26, 30, 31). Additional cylindrical lenses were used for the correction of astigmatism (3). Argon-ion laser radiation at 514.5 nm was used with a symmetric 90° scattering geometry (32). Velocities of thermally exited acoustic phonons were determined from the Doppler shift of the probing laser beam diffracted by the traveling phonon waves. Single-crystal MgO platelets of (011̄) orientation were doubly polished to 13-μm thickness and cleaved along (100) and (011) to form a 50 × 50 μm2 platelet. A long piston-cylinder type diamond-anvil cell with eight optical access holes and 0.4-mm diamond culets was used for reaching pressures beyond 50 GPa (33), thus extending the pressure range of the flat diamond cells previously used for Brillouin spectroscopy. The MgO platelet sample was introduced into the sample chamber of the cell with the [100] and [011] directions matching the directions of the optical access holes of the cell. Measurements of sound velocities in these two crystallographic directions are sufficient for fully constraining the three elastic tensor elements C11, C12, and C44 of cubic MgO. Several pieces of fine-grained ruby were placed in the same pressure chamber as pressure markers. Helium was loaded as a pressure medium. The longitudinal (VL100 and VL011) and fast transverse (VT100) acoustic velocities were obtained from the Brillouin signals (superscripts denote the propagation directions of the acoustic wave). Crystal orientations were optimized by fine-tuning the rotation of the diamond cell axis until self-consistent results were obtained for transverse signals at both crystallographic orientations. Fig. 1 shows an example of the Brillouin spectra obtained at 54.7 GPa.
Figure 1.
Brillouin scattering spectra of MgO at 54.7 GPa. VL(s) and VT(s) are the longitudinal and transverse sound velocities, respectively, for the sample. R and D are the Rayleigh and diamond peaks, respectively. The longitudinal peaks of the helium medium, which were very close to the sample peaks, can be subtracted by control measurements on the pure helium (area of the gasket hole without the sample).
High-pressure measurements of density (ρ) at 300 K were made by energy dispersive x-ray diffraction at Beamline X17C of the National Synchrotron Light Source, Brookhaven National Laboratory. A symmetric piston-cylinder type diamond anvil cell with a 35° (included) conical opening was used. Polycrystalline MgO with a grain size of 1 to 2 μm was loaded in a rhenium gasket with a methanol–ethanol mixture as a pressure medium below 10 GPa and with helium for higher pressures. Two ruby chips (2 to 3 μm in grain size) located at the center and edge of the gasket hole were used as pressure indicators. Ruby fluorescence shifts were measured before and after each x-ray measurement to confirm the pressure stability. Hydrostatic conditions up to the maximum pressure were monitored and confirmed by the following observations: (i) strong light scattering at grain boundaries indicated grain separation by the helium medium; (ii) ruby R1 and R2 peaks were well resolved; (iii) pressure differences between the two ruby chips were within the measurement uncertainty; and (iv) the unit cell volumes obtained from eight diffraction lines were consistent.
Ruby fluorescence shifts were measured in both Brillouin and x-ray experiments—these measurements were not used for pressure determination, but only as a transfer function to correlate the velocities from Brillouin measurements as a function of the densities from x-ray diffraction. All parameters were initially determined as functions of density instead of pressure. Three elastic moduli were obtained (ref. 34): C11 = ρ(VL100)2, C44 = ρ(VT100)2, and C12 = 2ρ(VL011)2 − C11 − 2C44. The adiabatic bulk modulus KS and Voigt–Reuss–Hill averaged shear modulus GS were obtained through the following equations: KS = (C11 + 2C12)/3 and GS = (GV + GR)/2, where the effective Voigt shear modulus GV and Reuss shear modulus GR are:
 |
1 |
 |
The 300-K isothermal bulk modulus, KT, was calculated from KS,
 |
where α is the thermal expansivity and γ is the Mie–Grüneisen parameter. These parameters were estimated based on the ambient values of α0 = 3.12 × 10⁻⁵K−1, γ0 = 1.54 (35, 36), and (∂KT/∂T)P = −0.03 GPa/K (23), and the assumption that the product of γ and ρ is constant. The uncertainty introduced by these assumptions was insignificant because the total correction from KS to KT was less than two percent. The isothermal bulk modulus as a differential equation in pressure and density, KT = ρ(δP/δρ)T, was integrated to yield the pressure–density equation of state, thus providing a primary determination of pressure without reliance on other calibrations. Through this pressure–density relation, all parameters as functions of density can then be redefined as functions of pressure.
Results and Discussion
Elasticity Tensor.
The present study extends the fourth-rank elasticity tensor measurements of MgO to pressures well into the lower mantle region of the Earth, and this triples the previous experimental range of MgO elasticity. This study also extends the maximum hydrostatic pressure of complete elasticity measurements for any material by a factor of 2. Important elastic and thermodynamic properties from theory and seismic observations at lower mantle conditions can thus be directly compared without the ambiguity of extrapolation. Such ambiguity is particularly severe for materials with strongly nonlinear pressure–elasticity relations, such as MgO.
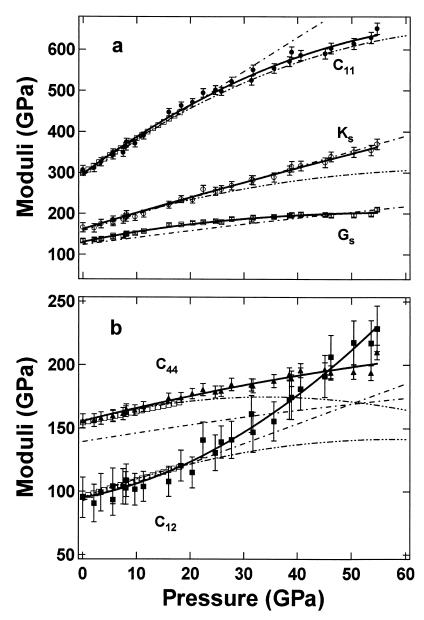
Fig. 2 shows the pressure dependence of the MgO elasticity tensor and aggregate elastic moduli obtained in this study compared with previous results. All elastic moduli increase with increasing pressure, but with quite different slopes and curvatures. The C11 and C12 both show strong nonlinear pressure dependencies, whereas KS is almost linear with pressure. The present high-pressure data and the zero-point constraints from previous ultrasonic data (8) are fitted to polynomials as listed in Tables 1 and 2 and plotted in Fig. 2. Our measurements agree well with previous ultrasonic data and Brillouin scattering measurements (8, 25) within their experimental pressure ranges (3 and 18.6 GPa, respectively), but deviate significantly from their extrapolations beyond 20 GPa. The differences are particularly noticeable in the curvatures of C12 and C44.
Figure 2.
Pressure dependencies of elastic moduli for MgO. Symbols with error bars are the present data points and solid curves are polynomial fittings of this study, with pressures determined by the present MgO scale. Third- and fourth-order Birch–Murnaghan equation of state fits are shown for KS and GS, respectively. Open squares represent the fit to the Brillouin scattering data of Sinogeikin and Bass (25); double dot–dashed curves are extrapolations of ultrasonic data (8); and dot–dashed curves are from theoretical calculations (37).
Table 1.
Single-crystal elastic tensor of MgO as a function of pressure
| Ref. | C11, GPa | C44, GPa | C12, GPa |
|---|---|---|---|
| This study (0–55 GPa) | 297.0(1) + 9.7(2)P − 0.063(6)P2 | 155.7(5) + 1.09(7)P − 0.0047(16)P2 | 95.2(7) + 0.82(14)P + 0.030(3)P2 |
| Ref. 25 (0–18.6 GPa) | 297.9(2) + 9.1(2)P − 0.045(15)P2 | 154.4(20) + 0.84(20)P + 0.003(10)P2 | 95.8(10) + 1.34(15)P − 0.001(10)P2 |
| Ref. 8 (0–3 GPa) | 296.8(2) + 9.2(1)P − 0.059(30)P2 | 155.8(2) + 1.11(1)P − 0.016(3)P2 | 95.3(2) + 1.61(12)P − 0.014(34)P2 |
The numbers in parentheses give the uncertainties in the last significant figures.
Table 2.
Aggregate elastic moduli of MgO as functions of pressure
| Ref. | K0S, GPa | K′0S | K″0S, GPa−1 | G0S, GPa | G′0S | G″0S, GPa−1 |
|---|---|---|---|---|---|---|
| This study* (0–55 GPa) | 162.5(7) | 3.99(3) | — | 130.4(1.7) | 2.85(9) | −0.084(6) |
| Ref. 25* (0–18.6 GPa) | 163.2(1.0) | 4.0(1) | −0.04(2) | 130.2(1.0) | 2.4(1) | −0.04(2) |
| Ref. 8† (0–3 GPa) | 162.5(2) | 4.13(9) | −0.058(66) | — | — | — |
| Ref. 14† (0–37 GPa) | 162.0(1.0) | 4.08(9) | −0.036(16) | 130.9(5) | 2.56(6) | −0.030(10) |
| Ref. 37* | 159.7 | 4.26 | −0.026 | 121.5 | 2.18 | −0.034 |
Elastic moduli were fit to third- or fourth-order Birch–Murnaghan equations of state.
Elastic moduli were fit to the polynomial Mij(P) = Mij0 + M′ij0P + 0.5M″ij0P2.
Equation of State.
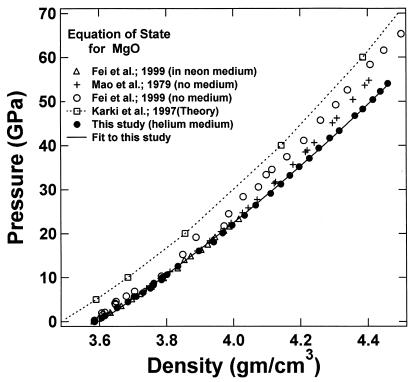
Fig. 3 shows the pressure–density equation of state for MgO. A total of 33 x-ray diffraction points were obtained in the present study. Previous measurements carried out under various nonhydrostatic and quasihydrostatic pressure conditions (7, 23), as well as a theoretical calculation (37), are also plotted for comparison. The present results are in excellent agreement with the previous quasihydrostatic (neon medium) measurements at lower pressures (23), but are significantly different from the nonhydrostatic measurements without pressure media, indicating the importance of hydrostatic conditions for the determination of an unbiased equation of state. The adiabatic bulk and shear moduli at 28 pressure points were calculated by using the fitted densities and the sound velocities measured in the Brillouin scattering experiment. The adiabatic bulk modulus KS can be fitted well to a third-order finite strain equation of state:
 |
2 |
but the shear modulus GS requires a fourth-order finite strain equation of state:
 |
3 |
 |
where K0S, K′0S, G0S, G′0S, and G"0S are the adiabatic bulk modulus, shear modulus, and their pressure derivatives (at zero pressure), and the Eulerian strain, f, is given by:
 |
4 |
The adiabatic parameters are listed in Table 2. With the aforementioned adiabatic to isothermal correction factor (1 + αγT), the resultant isothermal bulk modulus is K0T = 160.2(7) GPa and its pressure derivative K′0T = 4.03(3). This isothermal equation of state was used for calculating the primary pressure scale.
Figure 3.
Isothermal (300 K) pressure–density equations of state of MgO, ρ0 = 3.585 g/cm3. The present hydrostatic results from the integration of Brillouin and x-ray measurements are compared with previous theoretical calculations (37) and experimental measurements under various nonhydrostatic and quasihydrostatic conditions (7, 23).
Elastic Anisotropy.
Determination of the single-crystal elastic anisotropy at high pressure reveals the evolution of relative bonding strength. It is also of fundamental importance for understanding the seismic anisotropy of the Earth's interior (38, 39). In cubic crystals, elastic anisotropy can be defined as:
 |
5 |
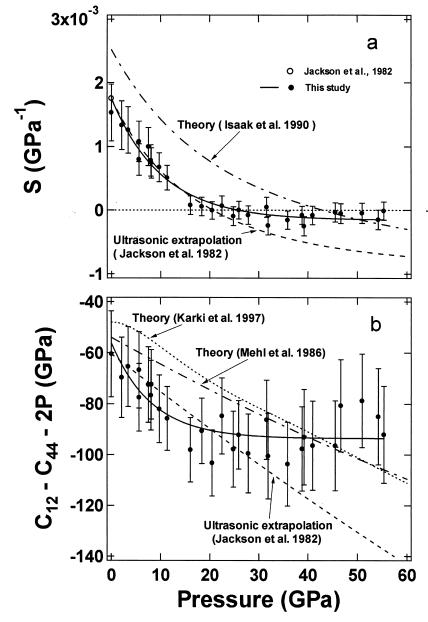
Fig. 4a shows the pressure dependence of the elastic anisotropy of MgO. Previous ultrasonic data (8) and theoretical calculations using the Potential-Induced Breathing (PIB) model (13) show a large elastic anisotropy for MgO at ambient pressure that decreases sharply with increasing pressure and becomes negative above 20 and 43 GPa, respectively. The present results show a similar trend but with more curvature. Our measured anisotropy of MgO is initially in excellent agreement with the low-pressure ultrasonic data, decreasing with increasing pressure, crossing zero at 20 GPa, and remaining slightly negative above 20 GPa. The anisotropy is similar to the theoretically calculated value measured (13) at the highest pressures.
Figure 4.
Pressure dependence of elastic anisotropy (a) and Cauchy condition for MgO (b). The solid circles are measured points from this study, and the solid curves indicate the observed trend. Ultrasonic results measured at ambient pressure and extrapolations to higher pressure are given by open-circle and dashed curves (8). Dot–dashed curves are theoretical PIB results from refs. 10 and 13, and the dotted curve in b is the theoretical result from ref. 37.
Cauchy Violation.
Many investigators have noted the Cauchy violation of MgO at ambient and at high pressures (6, 10, 25, 37). For centrosymmetric cubic crystals, the Cauchy relation requires C12 = C44 at zero pressure or C12 − C44 = 2P under pressure. Violations of the Cauchy condition require noncentral forces and therefore provide an important measure of many-body interactions in the crystal. As shown in Fig. 4b, we find C12 − C44 = −60.5 GPa at zero pressure, consistent with the previous ultrasonic value. Under applied pressure, we find that (C12 − C44 − 2P) becomes more negative, reaching −90 GPa at 17 GPa, and remaining at −90 GPa without significant changes up to 55 GPa. This trend appears to contrast with various theoretical results, which suggest a monotonically decreasing trend until 150 GPa (37). The different behavior observed experimentally above 20–30 GPa, which is just outside the measurement uncertainties, is not yet understood.
Aggregate Sound Velocities.
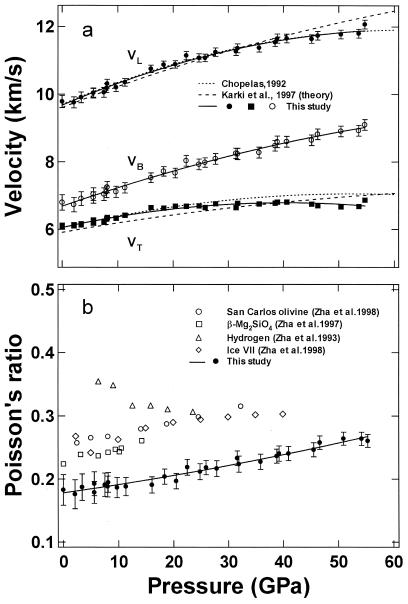
Aggregate longitudinal (VL), transverse (VT), and bulk (VB) sound velocities are primary information obtained in seismological observations. Aggregate sound velocities of MgO have been previously measured by shock compression at high pressures and temperatures (15) and calculated from fluorescence side-band spectroscopy data at high pressures and ambient temperature (14). They are also derived from the present elasticity measurements by the relationships: ρVL2 = KS + 4GS/3, ρVT2 = GS, and ρVB2 = KS. The pressure dependencies of the aggregate sound velocities of MgO are shown in Fig. 5a and Table 3. The present results show excellent agreement with values obtained by fluorescence side-band spectroscopy for VL over the entire pressure range and VT below 20 GPa.
Figure 5.
Aggregate sound velocities and Poisson's ratio for MgO under high pressures. (a) VL, VT, and VB are the longitudinal, transverse, and bulk sound velocities, respectively. Symbols and solid curves are from this study. The dotted curves are results calculated from fluorescence side-band measurements (14); the dashed curves are theoretical results (37). (b) Pressure dependence of Poisson's ratio for MgO compared with different materials, including San Carlos olivine [(Mg0.88Fe0.12)2SiO4] (3), β-Mg2SiO4 (31), solid molecular hydrogen (30), and ice VII (40). The solid curve is the fitted result for MgO given by ν = 0.18 + 1.3 × 10⁻³P + 6.4 × 10⁻⁶P2, where P is based on the new primary pressure scale.
Table 3.
Pressure dependencies of aggregate compressional, shear, and bulk sound velocities of MgO
| Ref. | VL, km/s | VT, km/s | VB, km/s |
|---|---|---|---|
| This study | 9.68(4) + 0.0698(37)P − 0.00054(7)P2 | 6.06(3) + 0.0365(28)P − 0.00045(5)P2 | 6.69(4) + 0.057(3)P − 0.00027(6)P2 |
| Ref. 14 | 9.70(2) + 0.0704(20)P − 0.00056(6)P2 | 6.05(1) + 0.0381(13)P − 0.00036(4)P2 | — |
| Ref. 37 | 9.687 + 0.0545P − 0.000147P2 | 5.968 + 0.0224P − 0.000075P2 | — |
F. Poisson's Ratio.
The Poisson ratio, ν, is calculated from aggregate sound velocities by the equation
 |
6 |
and is plotted in Fig. 5b. The Poisson ratio of MgO increases strongly with increasing pressure, from 0.18 at ambient pressure to 0.27 at 55 GPa. Previous high-pressure measurements of ν for four other materials, San Carlos olivine [(Mg0.88Fe0.12)2SiO4] (3), β-Mg2SiO4 (31), solid molecular hydrogen (30), and ice VII (40) are shown for comparison. In geophysics, Poisson's ratio is often used to distinguish different mineralogical compositions in the crust because different minerals often have quite different ratios. However, Fig. 5b shows an interesting feature in that differences in Poisson's ratio tend to decrease at high pressures. The pressure derivatives of ν are positive for those with ν0 < 0.3 and negative for those with ν0 > 0.3; eventually, the Poisson ratios for all five nonmetallic materials with very different bonding and structure characteristics converge to 0.3, which is typical for ν0 of metals at ambient conditions.
G. Ruby Pressure Scale.
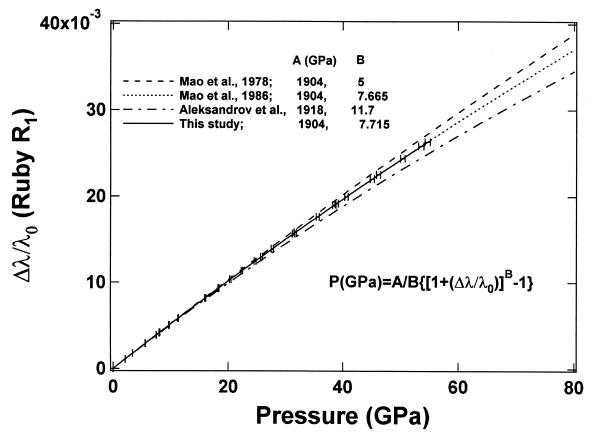
The ruby fluorescence shift under compression is reestablished here as a pressure scale based on the primary calibration of the MgO pressure–density relation from our integrated Brillouin and x-ray measurements. Fig. 6 compares previously used (or proposed) ruby scales with the present result. The functional form
 |
7 |
has been used for ruby pressure scales (27, 28), with the initial slope fixed (except for ref. 41) at A = 1904 GPa (42), and B determined by a least-squares fit of the data. The ruby scale proposed by Aleksandrov et al. (41), which was based on an extrapolated correlation of the diamond Raman shift and ruby fluorescence, shows an extremely high B value of 11.7 that is inconsistent with the present result. Other B values based on shock-wave primary calibrations, including 5.0 for nonhydrostatic (27) and 7.665 for quasihydrostatic conditions (28), show excellent agreement with the present value of 7.715 for hydrostatic conditions and a clear correlation with the hydrostaticity. This is also in good agreement with the ruby fluorescence shift measured against the equation of state of tungsten in a neon medium to 110 GPa (43), a result that indicated slightly higher pressures (larger B) than that obtained with the less hydrostatic argon-medium scale (28). With the present primary calibration, the ruby scale is now constrained to ±1% accuracy up to 55 GPa. The result also provides an independent verification that the reduced 300-K isotherms and the temperature corrections to the shock wave data for Au, Ag, Cu, Pd, Mo, and Pt, the basis of the previous ruby scales (27, 28), are accurate to ±1%.
Figure 6.
Comparison of ruby fluorescence frequency shifts under different stress calibrations. The solid curve is the primary pressure scale from this study. Other curves are previous calibrations based on shock-wave equations of state of metals (27, 28) and extrapolation of the diamond Raman shift (41).
Conclusions
The application of high-pressure single-crystal Brillouin scattering and synchrotron x-ray diffraction techniques has permitted a complete study of the elasticity and equation of state of MgO to 55 GPa in diamond cells. The use of a helium pressure medium is crucial for eliminating stress anisotropy and inhomogeneity to the maximum pressures. The C11, C12, and C44 obtained by combining the velocity data from Brillouin scattering with the density data from x-ray diffraction show monotonic increases with pressure. Higher-order single-crystal properties, such as elastic anisotropy and deviations from the Cauchy condition as functions of pressure, show more significant curvature. Theoretical calculations are generally in good agreement with the present results, but quantitative differences suggest the need for additional treatment of the bonding, even for this putatively simple oxide material. Finally, the combination of Brillouin scattering and x-ray diffraction measurements provides a new primary pressure scale to 55 GPa for static compression experiments. Recalibration of the ruby R1 fluorescence scale for materials in the nearly hydrostatic helium medium indicates a very small shift to higher pressure relative to the previous scale calibrated against shock-wave equations of state of metals in argon. Extensions of such measurements into the megabar pressure range are now feasible.
Acknowledgments
We thank T. S. Duffy for help with the experiments and analysis, and J. D. Bass, W. A. Bassett, S. Gramsch, R. E. Cohen for comments, and J. Z. Hu for beamline technical support. This work is supported by National Science Foundation Grants EAR-9730617, EAR-9706624, and DMR-9972750. The National Synchrotron Light Source is supported by the Department of Energy.
Footnotes
Article published online before print: Proc. Natl. Acad. Sci. USA, 10.1073/pnas.240466697.
Article and publication date are at www.pnas.org/cgi/doi/10.1073/pnas.240466697
References
- 1.Nye J F. Physical Properties of Crystals. Oxford: Clarendon; 1985. [Google Scholar]
- 2.Birch F. J Geophys Res. 1952;57:227–286. [Google Scholar]
- 3.Zha C S, Duffy T S, Downs R T, Mao H K, Hemley R J. Earth Planet Sci Lett. 1998;159:25–34. [Google Scholar]
- 4.Singh A K, Mao H K, Shu J, Hemley R J. Phys Rev Lett. 1998;80:2157–2160. [Google Scholar]
- 5.Chang Z P, Barsch G R. J Geophys Res. 1969;74:3291–3294. [Google Scholar]
- 6.Cohen A J, Gordon R G. Phys Rev B. 1976;14:4593–4605. [Google Scholar]
- 7.Mao H K, Bell P M. J Geophys Res. 1979;84:4533–4536. [Google Scholar]
- 8.Jackson I, Niesler H. In: High Pressure Research in Geophysics. Akimoto S, Manghnani M H, editors. Tokyo: Center for Academic Publishing; 1982. pp. 93–133. [Google Scholar]
- 9.Hemley R J, Jackson M D, Gordon R J. Geophys Res Lett. 1985;12:247–250. [Google Scholar]
- 10.Mehl M J, Hemley R J, Boyer L L. Phys Rev B. 1986;33:8685–8696. doi: 10.1103/physrevb.33.8685. [DOI] [PubMed] [Google Scholar]
- 11.Cohen R E, Boyer L L, Mehl M J. Phys Rev B. 1987;35:5749–5760. doi: 10.1103/physrevb.35.5749. [DOI] [PubMed] [Google Scholar]
- 12.Isaak D G, Anderson O L, Goto T. Phys Chem Minerals. 1989;16:704–713. [Google Scholar]
- 13.Isaak D G, Cohen R E, Mehl M J. J Geophys Res. 1990;95:7055–7067. [Google Scholar]
- 14.Chopelas A. Earth Planet Sci Lett. 1992;114:185–192. [Google Scholar]
- 15.Duffy T S, Ahrens T J. J Geophys Res. 1995;100:529–542. [Google Scholar]
- 16.Chen G, Liebermann R C, Weidner D J. Science. 1998;280:1913–1916. doi: 10.1126/science.280.5371.1913. [DOI] [PubMed] [Google Scholar]
- 17.Cohen R E. In: Physics Meets Mineralogy: Condensed Matter Physics in the Geosciences. Aoki H, Syono Y, Hemky R J, editors. Cambridge, U.K.: Cambridge Univ. Press; 2000. pp. 95–123. [Google Scholar]
- 18.Utsumi W, Weidner D J, Liebermann R C. In: Properties of Earth and Planetary Materials at High Pressures and Temperatures. Manghnani M H, Yagi T, editors. Washington, DC: Am. Geophys. Union; 1998. pp. 327–333. [Google Scholar]
- 19.Jamieson J C, Fritz J N, Manghnani M H. In: High-Pressure Research in Geophysics. Akimoto S, Manghnani M H, editors. Tokyo: Center for Academic Publications; 1982. pp. 27–48. [Google Scholar]
- 20.Fei Y, Mao H K, Mysen B O. J Geophys Res. 1991;96:2157–2169. [Google Scholar]
- 21.Takahashi E, Ito E. In: High Pressure Research in Mineral Physics. Manghnani M H, Syono Y, editors. Tokyo/AGU, Washington, DC: Terra Scientific; 1987. pp. 427–437. [Google Scholar]
- 22.Duffy T S, Hemley R J, Mao H K. Phys Rev Lett. 1995;74:1371–1374. doi: 10.1103/PhysRevLett.74.1371. [DOI] [PubMed] [Google Scholar]
- 23.Fei Y. Am Mineralogist. 1999;84:272–276. [Google Scholar]
- 24.Meade C, Jeanloz R. Phys Rev B. 1990;42:2532–2535. doi: 10.1103/physrevb.42.2532. [DOI] [PubMed] [Google Scholar]
- 25.Sinogeikin S V, Bass J D. Phys Rev B. 1999;59:R14141–R14144. [Google Scholar]
- 26.Zha C S, Duffy T S, Downs R T, Mao H K, Hemley R J. J Geophys Res. 1996;101:17535–17545. [Google Scholar]
- 27.Mao H K, Bell P M, Shaner J, Steinberg D. J Appl Phys. 1978;49:3276–3283. [Google Scholar]
- 28.Mao H K, Xu J, Bell P M. J Geophys Res. 1986;91:4673–4676. [Google Scholar]
- 29.Ruoff A L, Lincoln R C, Chen Y C. J Phys D Appl Phys. 1973;6:1295–1306. [Google Scholar]
- 30.Zha C S, Duffy T S, Mao H K, Hemley R J. Phys Rev B. 1993;48:9246–9255. doi: 10.1103/physrevb.48.9246. [DOI] [PubMed] [Google Scholar]
- 31.Zha C S, Duffy T S, Mao H K, Downs R T, Hemley R J, Weidner D J. Phys Earth Planet Inter. 1997;147:E9–E15. [Google Scholar]
- 32.Whitfield C H, Brody E M, Bassett W A. Rev Sci Instrum. 1976;47:942–947. [Google Scholar]
- 33.Mao H K, Bell P M. Carnegie Inst Washington Year Book. 1980;79:411–415. [Google Scholar]
- 34.Musgrave M J P. Crystal Acoustics. San Francisco: Holden–Day; 1970. [Google Scholar]
- 35.Anderson O L, Oda H, Isaak D. Geophys Res Lett. 1992;19:1987–1990. [Google Scholar]
- 36.Ahrens T, editor. Mineral Physics and Crystallography—A Handbook of Physical Constants. Washington, DC: Am. Geophys. Union; 1995. [Google Scholar]
- 37.Karki B B, Stixrude L, Clark S J, Warren M C, Ackland G J, Crain J. Am Mineral. 1997;82:51–60. [Google Scholar]
- 38.Silver P, Chan W W. Nature (London) 1988;335:34–39. [Google Scholar]
- 39.Kaneshima S J. J Phys Earth. 1995;43:301–320. [Google Scholar]
- 40.Zha C S, Mao H K, Hemley R J, Duffy T S. In: The Review of High Pressure Science and Technology. Nakahara M, editor. Vol. 7. Kyoto: Japan Soc. High Pressure Sci. Tech.; 1998. pp. 739–741. [Google Scholar]
- 41.Aleksandrov I V, Goncharov A F, Zisman A N, Stishov S M. Sov Phys JETP. 1987;66:384–390. [Google Scholar]
- 42.Piermarini G J, Block S, Barnett J D, Forman R A. J Appl Phys. 1975;46:2774–2780. [Google Scholar]
- 43.Hemley R J, Zha C S, Jephcoat A P, Mao H K, Finger L W, Cox D E. Phys Rev B. 1989;39:11820–11827. doi: 10.1103/physrevb.39.11820. [DOI] [PubMed] [Google Scholar]


