Abstract
Objective—To examine the left ventricular regional wall motion abnormality and to evaluate dispersion of this abnormality in patients with long QT syndrome. Design—Left ventricular short axis images at basal and middle levels were recorded on videotape and digitised to reconstruct digitised M mode echocardiograms, from which left ventricular wall thickness curves were obtained. The wall thickening time (ThT) was defined as the period in which the instantaneous wall thickness exceeded 90% of the maximum wall thickness. ThT was measured at three segments in each of the septal and free wall sides of the left ventricle, a total of 12 segments. To examine the mechanical dispersion of the left ventricle, the difference between the maximum and minimum ThT of 12 segments in each subject was obtained. Patients—Eight patients with congenital long QT syndrome (averaged QTc interval (SD) 509 (27) ms1/2) and 10 control subjects (QTc interval 397 (26) ms1/2) were examined. Results—The averaged ThT values of the 12 segments pooled from all subjects were correlated with the QT intervals (r = 0.72, p < 0.005). Thus the averaged ThT in the long QT syndrome patients was longer than in the control subjects (p < 0.005). The segmental variation of ThT in the patients was greater than in the control subjects (p < 0.001). The dispersion of ThT in the patients was therefore larger than in control subjects (p < 0.005). However, the pattern of ThT variation in the patients varied according to the individual subject. Conclusions—There is not only electrical but also mechanical dispersion in the left ventricle of long QT syndrome patients. Regional assessment of ventricular wall motion may allow quantification of the spatial variation of wall motion abnormality. Keywords: echocardiography; long QT syndrome; regional wall motion; dispersion
Full Text
The Full Text of this article is available as a PDF (201.3 KB).
Figure 1 .
Digitised B mode and M mode echocardiography of a representative long QT syndrome (LQTS) patient. The upper images show the digitised B mode echocardiography and measurement sites used to reconstruct the digitised M mode echocardiography. These sites were mid-septum and lateral wall (A), posterior septum and anterior wall (B), and anterior septum and posterior wall (C). The lower images show the digitised M mode echocardiography of each measurement site in the upper images.
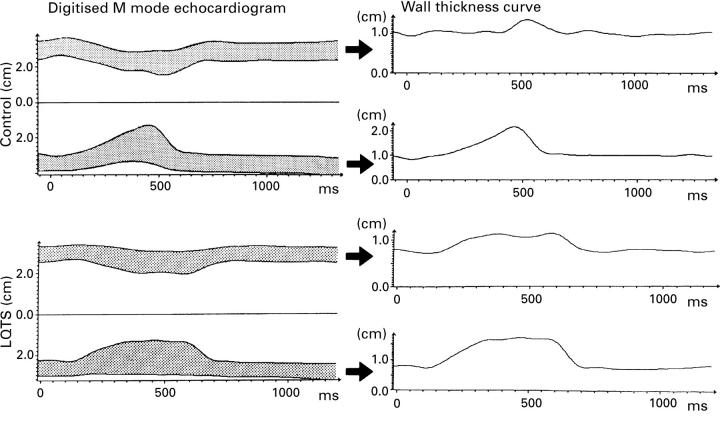
Figure 2 .
Wall thickness curve obtained from digitised M mode echocardiogram. The left side images are digitised M mode echocardiograms of mid-septum and lateral wall in a control subject and in a long QT syndrome (LQTS) patient. The wall thickness curves are obtained from tracing the digitised M mode echocardiograms in each measurement site.
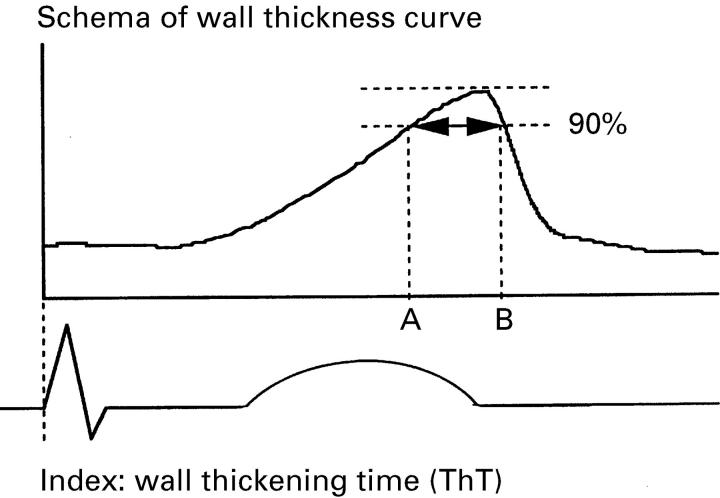
Figure 3 .
Schema of the wall thickness curve and the ThT index. This shows the thickening curve of the left ventricular wall at one measurement site. Segment AB represents ThT, defined as the period in which the late systole exceeded 90% of the maximum wall thickness.
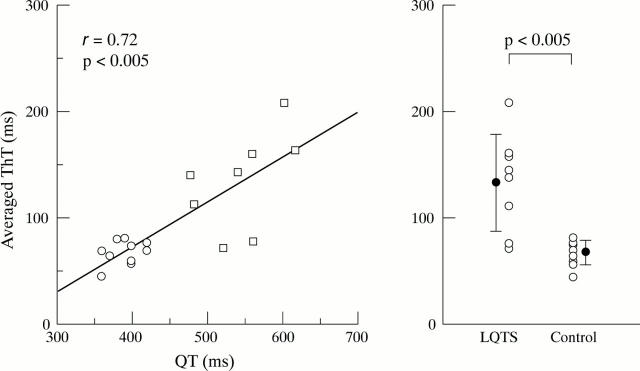
Figure 4 .
Left: scatterplot of the relation between the QT interval and the averaged ThT of 12 segments in the controls (∘, n = 10) and the long QT syndrome (LQTS) patients (□, n = 8). A significant correlation was found between the averaged ThT and the QT intervals (r = 0.72, p < 0.005). Right: plot comparing the averaged ThT between the LQTS patients (n = 8) and the control subjects (n = 10). The mean and 1 SD are indicated by the vertical bars. The ThT index of the LQTS patients was significantly larger than that of the control subjects (p < 0.005).
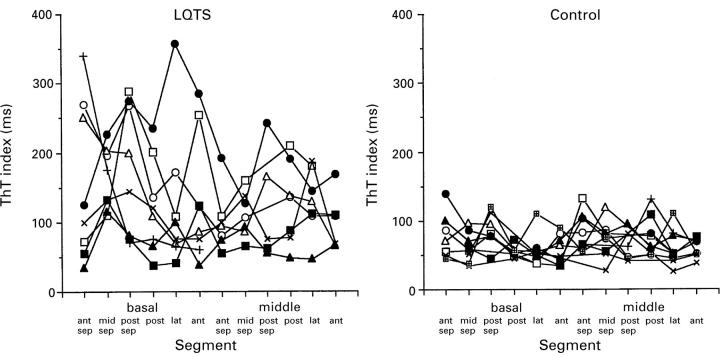
Figure 5 .
Segmental variance in the ThT index at 12 segments of the left ventricle of the long QT syndrome (LQTS) patients (n = 8) and the control subjects (n = 10); ant, anterior wall; ant sep, anterior septum; lat, lateral wall; mid-sep, mid-septum; post, posterior wall; post sep, posterior septum.
Figure 6 .
Left: plot comparing the dispersion of ThT between the long QT syndrome (LQTS) patients (n = 8) and the control subjects (n = 10). The mean and 1 SD are indicated by the vertical bars. The dispersion of ThT was significantly greater in the LQTS group than in the control group (p < 0.005). Right: scatterplot of the relation between the QT dispersion and the ThT dispersion in the controls (∘, n = 10) and the LQTS patients (□, n = 8). A significant correlation was found between QT dispersion and ThT dispersion (r = 0.84, p < 0.001).
Selected References
These references are in PubMed. This may not be the complete list of references from this article.
- Day C. P., McComb J. M., Campbell R. W. QT dispersion: an indication of arrhythmia risk in patients with long QT intervals. Br Heart J. 1990 Jun;63(6):342–344. doi: 10.1136/hrt.63.6.342. [DOI] [PMC free article] [PubMed] [Google Scholar]
- De Ambroggi L., Bertoni T., Locati E., Stramba-Badiale M., Schwartz P. J. Mapping of body surface potentials in patients with the idiopathic long QT syndrome. Circulation. 1986 Dec;74(6):1334–1345. doi: 10.1161/01.cir.74.6.1334. [DOI] [PubMed] [Google Scholar]
- De Ferrari G. M., Nador F., Beria G., Sala S., Lotto A., Schwartz P. J. Effect of calcium channel block on the wall motion abnormality of the idiopathic long QT syndrome. Circulation. 1994 May;89(5):2126–2132. doi: 10.1161/01.cir.89.5.2126. [DOI] [PubMed] [Google Scholar]
- Franz M. R., Bargheer K., Rafflenbeul W., Haverich A., Lichtlen P. R. Monophasic action potential mapping in human subjects with normal electrocardiograms: direct evidence for the genesis of the T wave. Circulation. 1987 Feb;75(2):379–386. doi: 10.1161/01.cir.75.2.379. [DOI] [PubMed] [Google Scholar]
- Hirao H., Shimizu W., Kurita T., Suyama K., Aihara N., Kamakura S., Shimomura K. Frequency-dependent electrophysiologic properties of ventricular repolarization in patients with congenital long QT syndrome. J Am Coll Cardiol. 1996 Nov 1;28(5):1269–1277. doi: 10.1016/S0735-1097(96)00313-0. [DOI] [PubMed] [Google Scholar]
- Jackman W. M., Friday K. J., Anderson J. L., Aliot E. M., Clark M., Lazzara R. The long QT syndromes: a critical review, new clinical observations and a unifying hypothesis. Prog Cardiovasc Dis. 1988 Sep-Oct;31(2):115–172. doi: 10.1016/0033-0620(88)90014-x. [DOI] [PubMed] [Google Scholar]
- LEPESCHKIN E., SURAWICZ B. The measurement of the Q-T interval of the electrocardiogram. Circulation. 1952 Sep;6(3):378–388. doi: 10.1161/01.cir.6.3.378. [DOI] [PubMed] [Google Scholar]
- Linker N. J., Colonna P., Kekwick C. A., Till J., Camm A. J., Ward D. E. Assessment of QT dispersion in symptomatic patients with congenital long QT syndromes. Am J Cardiol. 1992 Mar 1;69(6):634–638. doi: 10.1016/0002-9149(92)90155-r. [DOI] [PubMed] [Google Scholar]
- Nador F., Beria G., De Ferrari G. M., Stramba-Badiale M., Locati E. H., Lotto A., Schwartz P. J. Unsuspected echocardiographic abnormality in the long QT syndrome. Diagnostic, prognostic, and pathogenetic implications. Circulation. 1991 Oct;84(4):1530–1542. doi: 10.1161/01.cir.84.4.1530. [DOI] [PubMed] [Google Scholar]
- Priori S. G., Napolitano C., Diehl L., Schwartz P. J. Dispersion of the QT interval. A marker of therapeutic efficacy in the idiopathic long QT syndrome. Circulation. 1994 Apr;89(4):1681–1689. doi: 10.1161/01.cir.89.4.1681. [DOI] [PubMed] [Google Scholar]
- Schwartz P. J. Idiopathic long QT syndrome: progress and questions. Am Heart J. 1985 Feb;109(2):399–411. doi: 10.1016/0002-8703(85)90626-x. [DOI] [PubMed] [Google Scholar]
- Schwartz P. J., Moss A. J., Vincent G. M., Crampton R. S. Diagnostic criteria for the long QT syndrome. An update. Circulation. 1993 Aug;88(2):782–784. doi: 10.1161/01.cir.88.2.782. [DOI] [PubMed] [Google Scholar]
- Schwartz P. J., Periti M., Malliani A. The long Q-T syndrome. Am Heart J. 1975 Mar;89(3):378–390. doi: 10.1016/0002-8703(75)90089-7. [DOI] [PubMed] [Google Scholar]
- Shimizu W., Kamakura S., Ohe T., Kurita T., Takaki H., Aihara N., Shimomura K. Diagnostic value of recovery time measured by body surface mapping in patients with congenital long QT syndrome. Am J Cardiol. 1994 Oct 15;74(8):780–785. doi: 10.1016/0002-9149(94)90434-0. [DOI] [PubMed] [Google Scholar]
- Shimizu W., Ohe T., Kurita T., Takaki H., Aihara N., Kamakura S., Matsuhisa M., Shimomura K. Early afterdepolarizations induced by isoproterenol in patients with congenital long QT syndrome. Circulation. 1991 Nov;84(5):1915–1923. doi: 10.1161/01.cir.84.5.1915. [DOI] [PubMed] [Google Scholar]
- Surawicz B. Electrophysiologic substrate of torsade de pointes: dispersion of repolarization or early afterdepolarizations? J Am Coll Cardiol. 1989 Jul;14(1):172–184. doi: 10.1016/0735-1097(89)90069-7. [DOI] [PubMed] [Google Scholar]
- Surawicz B. Will QT dispersion play a role in clinical decision-making? J Cardiovasc Electrophysiol. 1996 Aug;7(8):777–784. doi: 10.1111/j.1540-8167.1996.tb00583.x. [DOI] [PubMed] [Google Scholar]
- Zipes D. P. The long QT interval syndrome. A Rosetta stone for sympathetic related ventricular tachyarrhythmias. Circulation. 1991 Sep;84(3):1414–1419. doi: 10.1161/01.cir.84.3.1414. [DOI] [PubMed] [Google Scholar]


