Abstract
Connecting genotype to phenotype is fundamental in biomedical research and in our understanding of disease. Phenomics—the large-scale quantitative phenotypic analysis of genotypes on a genome-wide scale—connects automated data generation with the development of novel tools for phenotype data integration, mining and visualization. Our yeast phenomics database PROPHECY is available at http://prophecy.lundberg.gu.se. Via phenotyping of 984 heterozygous diploids for all essential genes the genotypes analysed and presented in PROPHECY have been extended and now include all genes in the yeast genome. Further, phenotypic data from gene overexpression of 574 membrane spanning proteins has recently been included. To facilitate the interpretation of quantitative phenotypic data we have developed a new phenotype display option, the Comparative Growth Curve Display, where growth curve differences for a large number of mutants compared with the wild type are easily revealed. In addition, PROPHECY now offers a more informative and intuitive first-sight display of its phenotypic data via its new summary page. We have also extended the arsenal of data analysis tools to include dynamic visualization of phenotypes along individual chromosomes. PROPHECY is an initiative to enhance the growing field of phenome bioinformatics.
INTRODUCTION
Understanding the mechanistic connections between genotype and phenotype is fundamental to biomedical research and has far-reaching implications for the treatment of diseases. A major challenge in the post-genomic era is the functional characterization of genes, and in that process analysis of mutant phenotypes is vital. The field of phenomics—the large-scale quantitative phenotypic analysis of phenotypes on a genome-wide scale—is evolving rapidly, leading to increasing demand for novel data analysis, integration, mining and visualization tools. PROPHECY (PROfiling of PHEnotypic Characteristics in Yeast) is a project created to further advance our understanding of the functional role of yeast genes and an initiative to explore and enhance the growing field of phenome bioinformatics. We previously reported on a high-resolution system aimed at the precise quantification of growth alterations [recorded by measuring changes in optical density (OD) over time] as a consequence of the loss of every individual gene in the yeast genome during various physiological states, i.e. the growth variables adaptation time, growth rate and growth efficiency (1,2). One key feature of our data generation and handling is the inclusion of internal controls in each experimental run, thus providing standardization, over time, technician and instrument. Thus, each mutant's growth will be represented in relation to the growth of the parental strain (wild type) in that particular condition, forming logarithmic strain coefficients (LSCs). At the highest level of phenotypic characterization we present gene-by-environment phenotypes, thereby normalizing for any general growth defects in the mutant and forming logarithmic phenotypic indexes (LPIs) (2). We also introduced and described PROPHECY, a yeast phenomics database (3) that is designed to mine, filter and visualize genome-wide gene dispensability data in an easy to use manner. Here we present and describe new features of our web-based database, PROPHECY, including an extension of the phenotype datasets now allowing analysis of essential genes and effects from gene overexpressions, enhanced compact visualization of cell growth dynamics and novel data mining tools. Our PROPHECY database is available at http://prophecy.lundberg.gu.se.
Extending yeast genotype–phenotype data
Phenomics is based on the large-scale construction of various genotypes in combination with precise, ingenious and automated phenotypic screens. A major advantage of working with the yeast Saccharomyces cerevisiae is the ease with which genetic manipulations can be achieved. This is most apparent in the recent creation of several genome-wide mutant/strain collections, where the most widely used is the gene-deletion collection (4). We initially screened the viable haploid gene-deletion collection for gene-by-environment links to salt stress (2) or redox imbalance (J. Warringer, E. Ericson, L. Fernandez-Ricaud, O. Nerman and A. Blomberg, manuscript resubmitted) and visualized the phenotypic data using PROPHECY. We have now extended the genotype repertoire to include all yeast genes for which high-resolution phenotypic data are available to include genotype–phenotype links also for the essential genes using 984 heterozygous diploid strains (E. Ericson, F. Nilsson, P. Davidsson and A. Blomberg, unpublished data). Further, phenotype data from 574 gene overexpression strains have recently been added. This study was performed on the full set of integral membrane proteins of mainly the yeast plasma membrane revealing the benefit of overexpression as a means of gene characterization (5). The phenotypic data for the heterozygous diploids for the essential genes as well as the gene overexpression strains can be selected and explored under Advanced Query in the main menu. We have thus widely extended the genotypes analysed and presented in PROPHECY.
Improvements in the display of phenotype data
As reported previously (3), PROPHECY displays quantitative phenotypic data at different levels of abstraction. The display options start from the highest level of abstraction with a gene-by-environment representation of the data, i.e. the Compact LPI Display. In this display, the LPI phenotypes are presented in the graphical form where phenotype severity is coded by colour (red indicates resistance and green indicates sensitivity) and statistical significance is coded by shape (significant, P < 0.001, represented by circles; for a full level description of how LSC and LPI are calculated and information on how these are employed for estimates of statistical significance can be found under Materials and Methods on the PROPHECY website). The aim is to provide a snapshot overview of the phenotypes for that particular gene-deletion strain. At the lowest level of abstraction the user was earlier presented with tabulated, non-normalized and non-standardized growth variables, i.e. raw adaptation times, growth rates and growth efficiencies, as well as the corresponding growth curves. To facilitate easier interpretation of our quantitative phenotypic data we have now added a new phenotype display option; the Comparative Growth Curve Display.
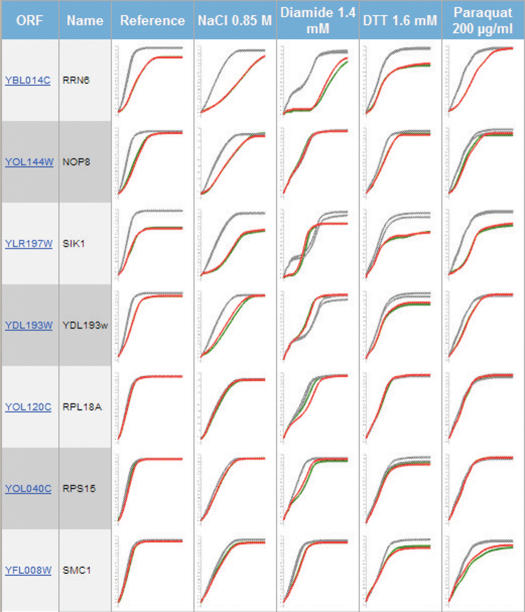
This compact graphical representation of the comparison of growth curves between mutant and the wild type resembles the functionality of the Compact LPI Display in that it provides a condensed form of phenotypic data representation in several environments (Figure 1). However, to enhance readability of the compact curve representation, which is particularly important when results from multiple environments are compared, two aspects of this tool had to be addressed.
Figure 1.
Compact Comparative Growth Curve Display. As a part of the Advanced Query facility multiple mutants under many environmental conditions can be visualized in a compact way. In this particular case some of the heterozygous diploids of essential genes exhibiting statistically significant phenotype have been selected and their compact comparative growth curve displays are presented.
First, representative wild types have to be selected. Our experimental set-up for providing statistically robust measurements uses several wild-type controls, usually eight per experimental run (the number may vary slightly depending on the project). For reasons of enhanced readability the Compact Curve Display only shows two wild types in contrast to the mutant being displayed (mutants are usually run in duplicates). These two wild-type curves are selected from the eight by the following procedure to ensure that the most representative wild-type curves are displayed: (i) the mean and the standard deviation values for each of the three growth variables for all the wild types are calculated, (ii) the two wild-type strains that are the closest to the calculated means of each growth variable are selected. This is done by selecting the wild types that are in the range of +/− half a standard deviation for each growth variable and (iii) if fewer than two of the wild types fall into this selected interval, then the interval is expanded by 0.1 SD until at least two wild types are selected.
Second, adjustments are made to compensate for slight differences in start-OD values. This standardization is essential to visually discriminate mutant versus wild-type differences when multiple environments are compared. However, it should be emphasized that calculation of growth variables are made on the curves that are not start-OD standardized, since the start-OD standardization procedure can result in some curve distortion, especially at the lower OD. The mean start-OD of all 50 000 growth curves currently in the database is 0.122 ± 0.023 (coefficient of variation = 1.9%). Thus, for the large majority of growth experiments, the start-OD adheres strongly to the target start value of 0.12 (corresponding to OD 0.05 after the blank correction of 0.067). However, technical variation is introduced by air bubbles and dust particles (this usually produces a single deviating initial OD measurement) or pipetting errors (smaller or larger volumes than expected). For ∼1% of the growth curves we find that start-OD deviates more than 3 standard deviations from the mean. In those cases the standardized start-OD procedure will slightly distort the appearance of the initial part of the growth curve. We recommend the user to go to the Individual Growth Curve Display where the non-standardized curves can be compared. This is done by clicking on the wild type versus mutant comparative graphs; thus, the raw unperturbed growth data are always easily accessible. The start-OD standardization is performed in the following ways: (i) we calculate an off-set value by subtracting 0.05 (the set value after blank correction) to the start-OD measurement and (ii) the individual off-set value is then subtracted from every point of the (non-logged) curve. This procedure only marginally influences non-logged growth curves, but can substantially affect logged growth curves. Attempts have been made to use parametric models for start-OD standardization (Ilona Pylvänäinen, Thesis, 2005). However, these procedures rely on growth data adhering closely to the parametric model, which in many environments is not the case. Thus, at this stage parametric models are unsuitable for general growth curve standardization and we apply this simplified standardization procedure to enable comparative visualization of cell growth dynamics.
Both procedures described above are performed in real-time following a database query for a particular mutant; thus, the algorithms are implemented at the database level in order to shorten the response time. The wild-type selection algorithm is now also used in our Growth Curve Display to pre-select two wild types, saving the user from having to select the most representative wild-type curves to be compared to the mutant. Thus, the whole procedure for phenotype visualization and data mining has been largely automated.
An improved phenotype summary page
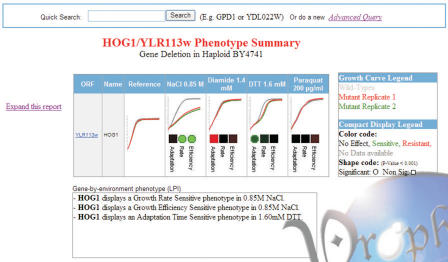
The Saccharomyces Genome Database (SGD) is a very important centralized information resource for the yeast community (http://db.yeastgenome.org) (6). In 2004 SGD established a link to PROPHECY as a phenotype resource from its Locus Summary Pages. PROPHECY now offers a more informative and intuitive first-sight display of its phenotypic data. Our new phenotypic summary page presents the user with a snapshot of the phenotypic data for a gene-deletion of interest using our two extreme levels of display-abstraction; the Compact LPI Display and the Comparative Growth Curve Display (Figure 2). This phenotypic summary page is the same either when linked to PROPHECY from SGD or when performing a Quick Search from the PROPHECY home page.
Figure 2.
Example for Phenotypic summary page. This page is the output from a quick search from the PROPHECY home page or via linking from the SGD Locus Page. From the summary page the user is directed to the Advanced Query tool.
Enhanced data filtering
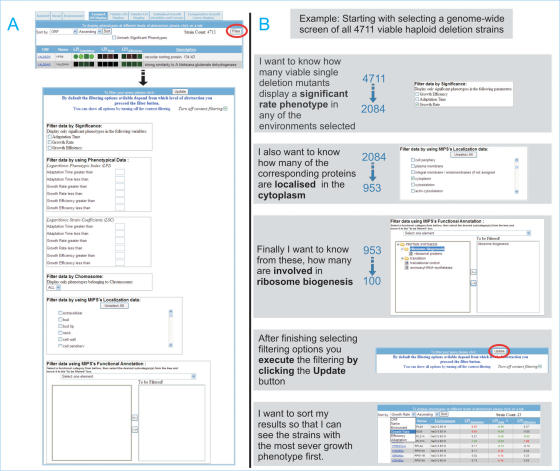
PROPHECY integrates phenotype data with other features, notably protein localization and functional annotation, by using a Filter tool. The Filter capabilities that are part of the Advanced Query facility have been extended in several ways (Figure 3). After selecting all 4711 mutants and all environments, one can filter for specific features that are of particular interest, e.g. one can select mutants that show a statistically significant rate phenotype in any of the environments (brings down the number to 2084), where the encoded protein is localized to the cytoplasm (brings down the number to 953) and is involved in ribosome biogenesis (final number of gene-deletions is 100). Thus, one can filter for classes of proteins that are of particular interest and integrate phenotypes with other types of relevant information.
Figure 3.
Data filtering and integration. The filtering tool provides several means of integrating phenotypic information with features such as protein localization and annotation. (A) Clicking on the Filter button opens a page where specific features can be selected. Note that the Filter tool is context dependent and will therefore contain different filtering options depending on the level of abstraction being used as the start point. (B) An example of a filtering procedure for mutants with a significant rate phenotype in any of several stress environments and where the encoded protein is annotated as involved in ribosome biogenesis.
A new tool for chromosomal phenotypic display
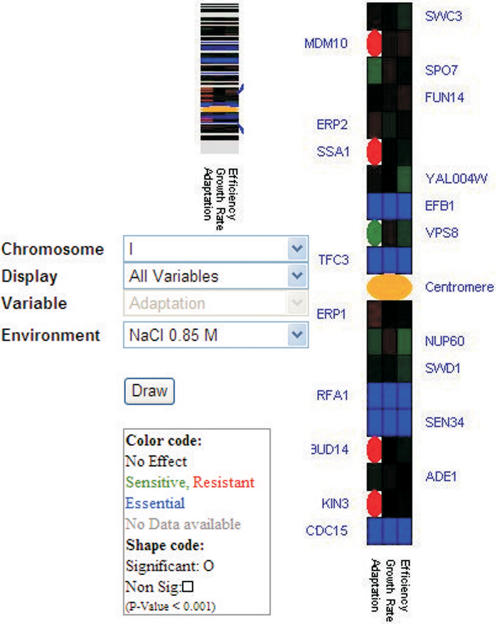
PROPHECY provides several specific tools for alternative data visualization and mining. For example, PROPHECY visualizes gene dispensability for components in protein complexes (3). We now extend this arsenal of data analysis tools to include a dynamic visualization of phenotypes along individual chromosomes. The user can find this new feature, Gene Dispensability in Regions of Chromosomes under Specific Data Analysis Tools in the main menu. Here the user can adjust the display to show one growth variable at a time, all growth variables together or one of the variables in multiple environments simultaneously. The view presents a summary chromosome where all genes associated with particular phenotypes are colour-coded (phenotype severity is indicated in green or red, significance/insignificance is indicated by shape and the centromere is displayed in orange) and where the chromosomes are oriented according to common standards (Figure 4). By clicking on a specific region on the summary chromosome one gets a zoom-in of that region. In the extended view, both significance and phenotype magnitude becomes apparent, and individual genes are indicated with names to allow efficient mining of chromosomal clumping of specific features.
Figure 4.
Clumping of phenotypes along chromosomes. In this display certain regions on specific chromosomes can be selected and enlarge for better visualization of phenotypic similarities between neighbouring gene.
Future perspectives
Understanding phenotypic consequences of genotypic changes is central in several aspects of biological and medical research. Yeast constitutes an attractive model for the analysis of phenotypes on a genome-wide scale because of its ease in genetic manipulation (almost any type of genotype can be constructed) and in cultivation and phenotype monitoring (can readily be screened for alterations in growth and molecular features such as gene expression). From large-scale gene-deletion projects we have come to appreciate that a large subset of genes are largely dispensable for growth, indicating that most phenotypes are marginal in nature (7). The molecular cause for that robustness can vary but is in most situations not known. However, it is getting more and more apparent that a reason for the minor importance of certain genes is the presence of cellular backup systems. Thus, a better understanding of the functional genetic network is vital in understanding not only many basic physiological phenomenon and individual phenotypes, but also for providing insight into disease mechanisms. Also here the yeast system promises to make a major contribution to our knowledge via efficient methods for systematic generation of double deletions (8,9). With the novel tools for phenotype visualization and data integration the PROPHECY database is well prepared for handling and analysing future large-scale projects encompassing wide screens to unravel the genetic network. High-resolution phenotypic characterization, presentation and comparison of single and double deletions will certainly be an exciting future challenge in phenome bioinformatics.
Acknowledgments
Funding for creating and maintaining PROPHECY and to pay the Open Access publication charges for this article was provided by the Foundation for Strategic Research in Sweden (SSF), Chalmers University of Technology, Göteborg University and the Swedish Research Council (VR).
Conflict of interest statement. None declared.
REFERENCES
- 1.Warringer J., Blomberg A. Automated screening in environmental arrays allows analysis of quantitative phenotypic profiles in Saccharomyces cerevisiae. Yeast. 2003;20:53–67. doi: 10.1002/yea.931. [DOI] [PubMed] [Google Scholar]
- 2.Warringer J., Ericson E., Fernandez L., Nerman O., Blomberg A. High-resolution yeast phenomics resolves different physiological features in the saline response. Proc. Natl Acad. Sci. USA. 2003;100:15724–15729. doi: 10.1073/pnas.2435976100. [DOI] [PMC free article] [PubMed] [Google Scholar]
- 3.Fernandez-Ricaud L., Warringer J., Ericson E., Pylvanainen I., Kemp G.J., Nerman O., Blomberg A. PROPHECY—a database for high-resolution phenomics. Nucleic Acids Res. 2005;33:D369–D373. doi: 10.1093/nar/gki126. [DOI] [PMC free article] [PubMed] [Google Scholar]
- 4.Giaever G., Chu A.M., Ni L., Connelly C., Riles L., Veronneau S., Dow S., Lucau-Danila A., Anderson K., Andre B., et al. Functional profiling of the Saccharomyces cerevisiae genome. Nature. 2002;418:387–391. doi: 10.1038/nature00935. [DOI] [PubMed] [Google Scholar]
- 5.Osterberg M., Kim H., Warringer J., Melen K., Blomberg A., von Heijne G. Phenotypic effects of membrane protein overexpression in Saccharomyces cerevisiae. Proc. Natl Acad. Sci. USA. 2006;103:11148–11153. doi: 10.1073/pnas.0604078103. [DOI] [PMC free article] [PubMed] [Google Scholar]
- 6.Cherry J.M., Adler C., Ball C., Chervitz S.A., Dwight S.S., Hester E.T., Jia Y., Juvik G., Roe T., Schroeder M., et al. SGD: Saccharomyces Genome Database. Nucleic Acids Res. 1998;26:73–79. doi: 10.1093/nar/26.1.73. [DOI] [PMC free article] [PubMed] [Google Scholar]
- 7.Thatcher J.W., Shaw J.M., Dickinson W.J. Marginal fitness contributions of nonessential genes in yeast. Proc. Natl Acad. Sci. USA. 1998;95:253–257. doi: 10.1073/pnas.95.1.253. [DOI] [PMC free article] [PubMed] [Google Scholar]
- 8.Tong A.H., Evangelista M., Parsons A.B., Xu H., Bader G.D., Page N., Robinson M., Raghibizadeh S., Hogue C.W., Bussey H., et al. Systematic genetic analysis with ordered arrays of yeast deletion mutants. Science. 2001;294:2364–2368. doi: 10.1126/science.1065810. [DOI] [PubMed] [Google Scholar]
- 9.Tong A.H., Lesage G., Bader G.D., Ding H., Xu H., Xin X., Young J., Berriz G.F., Brost R.L., Chang M., et al. Global mapping of the yeast genetic interaction network. Science. 2004;303:808–813. doi: 10.1126/science.1091317. [DOI] [PubMed] [Google Scholar]


