Abstract
The BASC system provides tools for the integrated mining and browsing of genetic, genomic and phenotypic data. This public resource hosts information on Brassica species supporting the Multinational Brassica Genome Sequencing Project, and is based upon five distinct modules, ESTDB, Microarray, MarkerQTL, CMap and EnsEMBL. ESTDB hosts expressed gene sequences and related annotation derived from comparison with GenBank, UniRef and the genome sequence of Arabidopsis. The Microarray module hosts gene expression information related to genes annotated within ESTDB. MarkerQTL is the most complex module and integrates information on genetic markers, maps, individuals, genotypes and traits. Two further modules include an Arabidopsis EnsEMBL genome viewer and the CMap comparative genetic map viewer for the visualization and integration of genetic and genomic data. The database is accessible at http://bioinformatics.pbcbasc.latrobe.edu.au.
INTRODUCTION
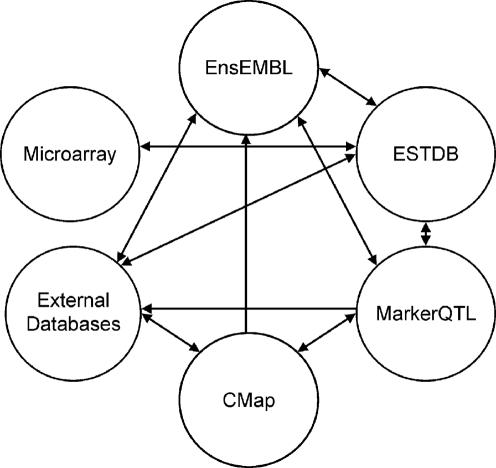
Modern high throughput technologies deliver a wealth of biological data. The increased complexity and abundance of biological data has made it difficult for researchers to gain a comprehensive view of this information. In order to improve accessibility, numerous computational tools and databases have been established (1). However, their independent development has resulted in diverse data structures and formats, limiting the ability to query across data types. To overcome some of these limitations, we have developed a bioinformatics system that integrates gene and genome DNA sequence, gene expression, molecular genetic marker, phenotypic trait and population data (Figure 1). Where possible, established open source database systems have been incorporated, permitting the integration and exchange of public data. The use of bioperl and MySQL, together with EnsEMBL coding standards further promote the interpretability of this system with external databases.
Figure 1.
Overview of Brassica BASC module integration.
DATA AND PROCESSING
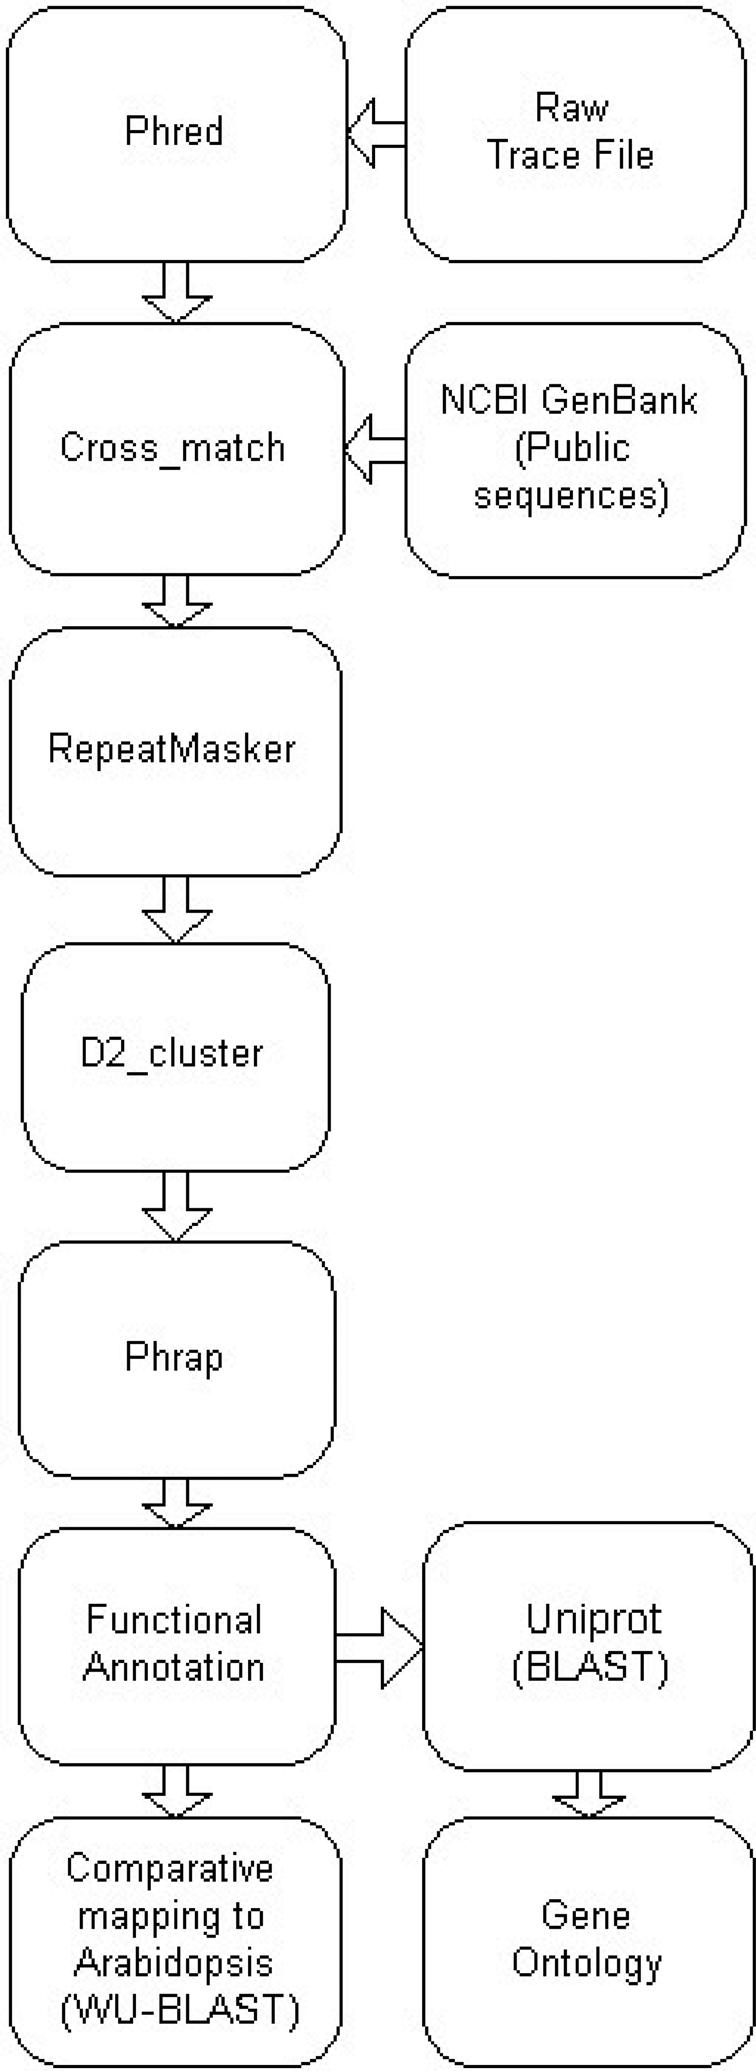
The ESTDB module functionality is based on previous Brassica sequence databases (2,3) and consists of proprietary and public expressed sequences. New sequences are collated quarterly and processed through an automated annotation pipeline (Figure 2). Total sequence numbers within the database are Brassica napus (91 658), Brassica oleracea (6485), Brassica juncea (8576), Brassica rapa (21 256) and Brassica nigra (3267). Where the original trace files are available, the annotation pipeline uses Phred to call the bases (4). Crossmatch (http://www.phrap.org/) and RepeatMasker (http://www.repeatmasker.org/) are used to remove vector sequences and to identify and mask repeat sequences. Processed sequences are clustered using D2 cluster (5) and assembled using Phrap (http://www.phrap.org/). Each assembly is stored in the database along with individual EST and consensus sequences. Parameters relating to sequence processing, assembly and annotation are maintained and linked from the associated results pages. The current database (Version 4, August 2006) contains 47 555 unigenes made up of 17 939 consensus and 29 616 singleton sequences. Functional annotation is assigned to the unigenes by sequence similarity to entries within UniProt and GenBank, using BLAST (6). A cut-off value of E < 10−5 is applied, with results parsed, stored and indexed in the database. Of the unigene sequences, 70% have a significant match with either UniProt or GenBank. Intermediate Gene Ontology (GO) annotation is derived via mapping to UniProt, with 40% of the unigenes annotated with at least one GO term. Sequences are compared with the Arabidopsis genome sequence using WU-BLAST (http://blast.wustl.edu/) to identify the best matching ortholog. These similarities are displayed using the Arabidopsis EnsEMBL genome viewer (7). Additional links to related molecular genetic marker and gene expression data are maintained. The Microarray module provides a platform for storing and visualizing gene expression data. The database stores both raw and normalized data and includes results from hydridizations of Brassica unigene cDNA microarrays representing 7000 unigenes.
Figure 2.

Brassica BASC EST sequence processing and annotation pipeline.
The MarkerQTL module stores a variety of data relating to molecular genetic markers, individuals, populations, genotypes, genetic and trait maps and phenotypic information. Data has been incorporated from the B.napus IMSORB project (http://Brassica.bbsrc.ac.uk/IMSORB/), the Biotechnology and Biological Sciences Research Council (BBSRC) (8) and the Osborn lab at the University of Wisconsin (http://osbornlab.agronomy.wisc.edu/).
The EnsEMBL and CMap modules are both open source tools developed by the European Bioinformatics Institute (EBI) (9) and The Generic Model Organism Database Project (GMOD) (10), respectively. The Arabidopsis EnsEMBL genome browser was developed by the Nottingham Arabidopsis Stock Centre (NASC) in the UK and allows the anchoring of biological features to the genome sequence of Arabidopsis. In collaboration with NASC, we have anchored the Brassica unigenes from the BASC ESTDB module and the B.oleracea whole genome shotgun sequences produced by The Institute for Genome Research (TIGR) and Cold Spring Harbor (http://www.tigr.org/tdb/e2k1/bog1/) to the Arabidopsis genome. B.rapa Bacterial Artificial Chromosomes (BAC) end sequences, produced by the Multinational Brassica Genome Sequencing Project, have also been mapped by their candidate syntenic locus (7). The Brassica BASC CMap displays genetic maps for Brassica and Arabidopsis. The current version hosts data for 6 Arabidopsis, 6 B.juncea, 9 B.napus, 3 B.rapa and 8 B.oleracea maps, with consensus maps generated using a rule-based approach. One QTL map for B.napus has been included, with measurements for 13 traits and 181 QTL. The genetic viewer and genome browser permit the identification of syntenic regions between Brassica and Arabidopsis and the translation of trait information in the form of QTL on genetic maps in CMap and MarkerQTL, to gene and genome information through the EnsEMBL browser.
QUERY TOOLS AND USER INTERFACE
The web interface provides multiple routes to query the various databases. The inter-related structure of the system permits cross-linking and browsing between divergent data and cross searching of complex data types (Figure 2). Modules may be searched independently or together. All relevant data is indexed, and searching by keyword using MySQL Boolean operators or accession number will retrieve associated sequence and annotation data, as well as molecular marker, gene expression or phenotypic trait information. A BLAST interface permits a similarity based search with an amino acid or DNA sequence. Analysis parameters for sequence assembly and annotation are linked from the relevant pages and help pages. Example searches are also provided.
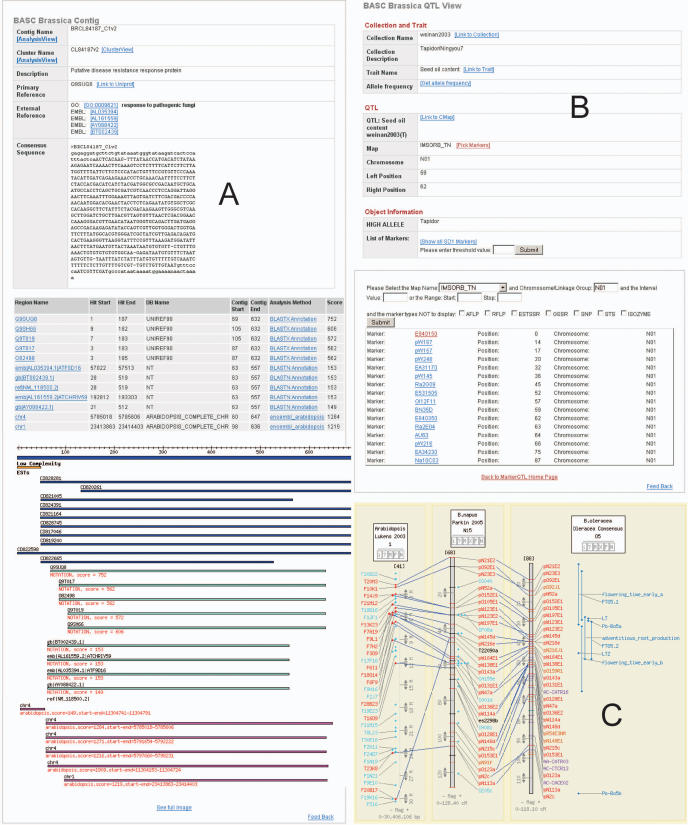
Typical results from the ESTDB module would include EST or consensus gene sequence, cDNA library information, sequence annotation, including UniRef, GenBank and significant GO categories and links to syntenic regions within Arabidopsis. The results are displayed in both tabular and graphical format (Figure 3A). Microarray results include gene expression values across treatments for a gene, experiment and sample details. The MarkerQTL MarkerView displays information related to a marker assay such as SSR, SNP, RFLP or AFLP parameters, including sequence information, amplification primers and any associated maps or locus information where available (Figure 3B). Markers may be selected within a defined region of a map, by association with other mapped markers, through associated QTL loci, or with a defined distribution across a genome. CMap enables the comparison of genetic markers and traits between maps (Figure 3C) as well as the exploitation of information from the complete genome sequence of Arabidopsis. By using this comparative map viewer, users can quickly identify traits in similar positions on other genetic maps. The development of consensus maps further enables the identification of molecular markers around the trait of interest for further characterization in specific populations. The integrated nature of the BASC bioinformatics system allows users to traverse between annotated gene sequence data, gene expression information, molecular genetic marker, genetic map and trait data with a few clicks of the mouse.
Figure 3.
Examples of data visualization, Sequence annotation in tabular and graphical format (A), Brassica QTLview (B) and Brassica CMap (C).
FUTURE DEVELOPMENTS
The structure of the database and application programming interface (API) offers the flexibility to add additional datasets and expand the current capabilities, including additional species such as wheat, barley and legumes. As the Brassica genome sequencing progresses, EnsEMBL based Brassica genome views will be included to display and compare this information and extend comparisons between Brassica species and Arabidopsis. Additional gene expression, gene, trait and genetic map information will be incorporated as it becomes available.
Acknowledgments
Funding to pay the Open Access publication charges for this article was provided by Primary Research Industries Victoria (PIRVic).
Conflict of interest statement. None declared.
REFERENCES
- 1.Edwards D., Batley J. Plant Bioinformatics: from genome to phenome. Trends Biotechnol. 2004;22:232–237. doi: 10.1016/j.tibtech.2004.03.002. [DOI] [PubMed] [Google Scholar]
- 2.Love C.G., Batley J., Lim G., Robinson A.J., Savage D., Singh D., Spangenberg G.C., Edwards D. New computational tools for Brassica genome research. Comp. Funct. Genomics. 2004;5:276–280. doi: 10.1002/cfg.394. [DOI] [PMC free article] [PubMed] [Google Scholar]
- 3.Love C.G., Robinson A.J., Lim G.A.C., Hopkins C.J., Batley J., Barker G., German C., Spangenberg G.C., Edwards D. Brassica ASTRA: an integrated database for Brassica Genomic Research. Nucleic Acids Res. 2005;33:D656–D659. doi: 10.1093/nar/gki036. [DOI] [PMC free article] [PubMed] [Google Scholar]
- 4.Ewing B., Hillier L., Wendl M.C., Green P. Base-calling of automated sequencer traces using phred. I. Accuracy assessment. Genome Res. 1998;8:175–185. doi: 10.1101/gr.8.3.175. [DOI] [PubMed] [Google Scholar]
- 5.Burke J., Davison D., Hide W. d2_cluster: a validated method for clustering EST and full-length cDNA sequences. Genome Res. 1999;9:1135–1142. doi: 10.1101/gr.9.11.1135. [DOI] [PMC free article] [PubMed] [Google Scholar]
- 6.Altschul S.F., Gish W., Miller W., Myers E.W., Lipman D.J. Basic local alignment search tool. J. Mol. Biol. 1990;215:403–410. doi: 10.1016/S0022-2836(05)80360-2. [DOI] [PubMed] [Google Scholar]
- 7.Love C., Logan E., Erwin T., Kaur J., Lim G.A.C., Hopkins C., Batley J., James N., May S., Spangenberg G., et al. Integrating and interrogating diverse Brassica data within an EnsEMBL structured database. Acta Hortic. 2006;706:77–82. [Google Scholar]
- 8.Lowe A.J., Moule C., Trick M., Edwards K.J. Efficient large-scale development of microsatellites for marker and mapping applications in Brassica crop species. Theor. Appl. Genetics. 2004;108:1103–1112. doi: 10.1007/s00122-003-1522-7. [DOI] [PubMed] [Google Scholar]
- 9.Hubbard T., Andrews D., Caccamo M., Cameron G., Chen Y., Clamp M., Clarke L., Coates G., Cox T., Cunningham F., et al. Ensembl 2005. Nucleic Acids Res. 2005;33:D447–D453. doi: 10.1093/nar/gki138. [DOI] [PMC free article] [PubMed] [Google Scholar]
- 10.Ware D.H., Jaiswal P., Ni J., Yap I.V., Pan X., Clark K.Y., Teytelman L., Schmidt S.C., Zhao W., Chang K., et al. Gramene, a tool for grass genomics. Plant Physiol. 2002;130:1606–1613. doi: 10.1104/pp.015248. [DOI] [PMC free article] [PubMed] [Google Scholar]


