

Abstract
Background:
The neurochemical effects of lithium in adolescents with bipolar disorder are largely unknown. This study used proton magnetic resonance spectroscopy (1H MRS) to identify the in vivo effects of lithium on myo-inositol (mI) concentrations in adolescent bipolar depression.
Methods:
Twenty-eight adolescents (12-18 years old) with bipolar I disorder, current episode depressed received open-label lithium 30 mg/kg, adjusted to achieve serum levels of 1.0-1.2 mEq/L. Medial, and left and right lateral prefrontal mI concentrations were measured at baseline, day 7, and day 42 of treatment. Changes in mI concentrations over time were analyzed.
Results:
Significant main effects of time were observed for mI concentrations in the medial (p = 0.03) and right lateral (p = 0.05) prefrontal cortices. Baseline concentrations of mI were not significantly different from day 7 or day 42 concentrations. However, mI concentrations on day 42 were significantly higher than those on day 7 (p = 0.02) in both regions.
Conclusions:
This study demonstrates that prefrontal mI concentrations do not significantly change from baseline following acute and chronic lithium treatment in adolescents with bipolar depression. Further investigation of the effect of lithium on mI is warranted to better understand possible mechanisms by which lithium exerts antidepressant activity.
Keywords: lithium, bipolar disorder, depression, adolescents, proton magnetic resonance spectroscopy, myo-inositol
Introduction
While the neurophysiology of bipolar disorder as it progresses across the lifespan is largely unknown, abnormalities within the phosphoinositol (PI) signaling pathway have been hypothesized to underlie this condition. Supporting evidence for this hypothesis is that lithium, a primary treatment for bipolar disorder, may exert its therapeutic effects by depleting neuronal myo-inositol (mI) concentrations through the inhibition of inositol monophosphatase (IMPase) (Berridge et al 1989; Hallcher and Sherman 1980), resulting in the downregulation of the PI signaling pathway and dampening overactive neurotransmission. The “inositol depletion” hypothesis proposed by Berridge et al (1989) may account for lithium’s mood stabilizing properties in acutely manic children and adolescents, in which mI concentrations have been observed to be elevated compared to healthy subjects (Cecil et al 2002; Davanzo et al 2001; Davanzo et al 2003). In contrast, mI concentrations in adult patients with bipolar depression have been reported to be lower than or no different than mI concentrations in healthy subjects (Dager et al 2004; Frey et al 1998; Silverstone et al 2005). To investigate the possibility of state-dependent mI concentrations, preliminary comparisons of baseline brain mI concentrations of bipolar depressed adolescents and a cohort of healthy subjects (DelBello et al 2005) were conducted. The bipolar depressed group had higher mean baseline mI concentrations in the medial, and left and right lateral prefrontal cortices, indicating that bipolar disorder, independent of episode polarity, may be characterized by elevated prefrontal mI concentrations.
There are relatively few proton magnetic resonance spectroscopy (1H MRS) studies of patients with bipolar depression examining changes in brain mI concentrations with lithium treatment. In a study of 12 bipolar depressed adults, Moore et al (1999) used single voxel spectroscopy to evaluate the acute (5-7 days) and chronic (3-4 weeks) effects of lithium on mI concentrations in the frontal, occipital, parietal, and temporal lobes. Concentrations of mI in the right frontal lobe significantly changed over time. Frontal lobe mI concentrations were significantly lower than baseline with acute lithium treatment, and this decrease persisted with chronic treatment (Moore et al 1999). These differences did not maintain significance when appropriate Bonferroni corrections for multiple comparisons were applied. No significant changes over time in mI concentrations were observed in the occipital, parietal, or temporal regions (Moore et al 1999). Friedman et al (2004) used proton echo-planar proton spectroscopy (PEPSI) to examine mI concentrations in adults with bipolar depression who were treated with lithium for approximately three months. Significantly higher regional gray matter mI concentrations at follow-up were observed in lithium-treated patients compared with healthy subjects, although the change in mI concentrations from baseline to follow-up in lithium-treated patients was nonsignificant. The strength of the PEPSI approach used by Friedman et al (2004) is the ability to simultaneously sample a larger region of interest (i.e., a slice, multiple slices or whole brain) at high resolution with improved elimination of lipid signals from subcutaneous fat and bone marrow over single voxel spectroscopy. However, the PEPSI approach is sensitive to inherent distortions in the magnetic field (i.e., tissue interfaces, iron deposition, and blood) and can have incomplete water suppression on short echo versions of the technique. These studies, although different with regard to 1H MRS technique, suggest that brain mI concentrations in patients with bipolar depression may not decrease with lithium treatment. To our knowledge, there are no 1H MRS studies examining lithium effects on brain mI concentrations in adolescents with bipolar depression.
1H MRS is a noninvasive technique that allows for the examination of the in vivo effects of psychotropic medications on certain brain neurometabolites. It is important to develop a better understanding of the neurochemical effects of lithium to gain insight into its potential therapeutic mechanism of action as it is used as a treatment for pediatric bipolar depression (Bhangoo et al 2003; Kowatch et al 2005). Furthermore, identifying neurochemical markers of treatment response may lead to future studies that develop MRS methods, which guide clinicians in tailoring pharmacological treatment regimens for individual patients in order to achieve more favorable outcomes.
With these considerations in mind, we conducted a single voxel 1H MRS study similar to that by Moore et al (1999) to examine the acute (7 days) and chronic (42 days) effects of lithium treatment on brain mI concentrations in bipolar depressed adolescents. Assuming elevated mI concentrations in bipolar depressed adolescents (as discussed above) and subsequent normalization with lithium treatment, we hypothesized that prefrontal mI concentrations would decrease, corresponding with improvement in depressive symptoms. Our secondary aim was to identify neurochemical markers of treatment remission.
Methods and Materials
This study was approved by the University of Cincinnati and the Cincinnati Children’s Hospital Medical Center (CCHMC) institutional review boards. Adolescent subjects provided written assent and their parents or legal guardians provided written informed consent for study participation after study procedures were fully explained.
Subjects
Adolescents (12-18 years old) consecutively admitted to the inpatient Adolescent Medicine Psychiatric Service at Cincinnati Children’s Hospital Medical Center (CCHMC), who met DSM-IV criteria for a diagnosis of bipolar I disorder, currently depressed, were eligible. Diagnoses were determined by using the Washington University in St. Louis Kiddie Schedule for Affective Disorders and Schizophrenia (WASH-U-KSADS) by interviewers with established diagnostic reliability (DelBello et al 2001; Geller et al 2001). Patients were also required to have a Children’s Depression Rating Scale - Revised (CDRS-R; Poznanski and Mokros 1995) total score = 40 and a Young Mania Rating Scale (YMRS; Young et al 1978) total score < 20 at day 0. Patients were excluded by having depressive symptoms secondary to substance intoxication or withdrawal, a diagnosis of substance abuse during the past 30 days or lifetime substance dependence, (excluding nicotine), a diagnosis of mental retardation (IQ < 70); a clinically significant or unstable medical or neurological disorder, or clinically significant baseline laboratory abnormalities; pregnancy or sexual activity without reliable use of an effective form of birth control; a history of hypersensitivity or intolerance to lithium; or, any contraindication to having a magnetic resonance imaging or 1H MRS scan. Patients were also excluded if they had treatment with antidepressants (fluoxetine within 1 month), antipsychotics, or mood stabilizers within 1 week, or benzodiazepines or psychostimulants within 72 hours. No patient was discontinued from treatment upon which he/she was stable for a wash-out period in order to determine if he/she met inclusion criteria. Nineteen (68%) patients had exposure to psychotropic medications in the past 6 months; the mean duration of time off psychotropic medications prior to the start of the study was 18.0 days (SD = 31.4).
After meeting study criteria, all subjects received an initial lithium carbonate dose of 30 mg/kg/day (BID dosing) up to a maximum starting dose of 1200 mg/day (600 mg BID) on day 0. Serum lithium levels were obtained at day 7, 14, 21, and 42 or more frequently as necessary, and lithium dosing was adjusted to achieve a therapeutic serum level of 1.0-1.2 mEq/L. Adjunctive psychotropic medications were not permitted during the study, with the exception of adjunctive lorazepam (maximum of 2 mg/day; not within 72 hours of scanning). Only 1 subject required lorazepam 0.5 mg at bedtime on 2 occasions.
Severity of depressive and manic symptoms was evaluated using the CDRS-R (Poznanski and Mokros 1995) and the YMRS (Young et al 1978), respectively. Overall level of improvement at each visit after initiation of lithium treatment was assessed using the Clinical Global Impressions Improvement Scale for Bipolar Disorder (CGI-BP) (Spearing et al 1997). Efficacy and safety ratings were performed at baseline and weekly thereafter until day 42 or termination from the study. Clinical remission was defined as a CDRS-R endpoint score = 28 (Emslie et al 2002) and a CGI-BP Improvement score of 1 or 2 (Spearing et al 1997). Complete details of the clinical aspects of this study have been published elsewhere (Patel et al 2006).
1H MRS Procedures
All subjects underwent a 1H MRS scan at baseline, prior to receiving medication and on days 7 and 42 or termination from the study. The scans on days 7 and 42 were performed in order to differentiate between the acute biochemical and longer-term antidepressant effects of lithium, respectively. Biochemical differentiation may possibly arise from the PI system and allied systems adjusting for the inhibitory effects of lithium on IMPase and other related enzymes. 1H MRS was acquired on a 1.5 T Magnetic Resonance scanner (Signa LX, General Electric Medical Systems, Milwaukee, WI). For each subject, a three-plane echo localizer was performed. An axial three-dimensional, inversion recovery prepped, fast spoiled gradient echo (3D IR FSPGR) was also acquired [TE=5.4 msec, TR=12.5 msec, inversion time (TI)=300 msec, FOV = 24 cm, 1.5-mm thick with contiguous slices] in order to provide an anatomic template for MRS voxel placement. Single voxel spectra were prescribed from the axial 3D IR FSPGR series based upon anatomical landmarks (see below). In the event a subject moved or needed to be removed from the scanner, a relocalization imaging sequence was performed. Three single voxels, each approximately 8 cubic centimeters (cm3) in volume, were positioned in the medial prefrontal cortex (predominately gray matter) and in the left and right lateral prefrontal cortices (predominately white matter). An experienced spectroscopist (KMC) positioned voxels in order to ensure consistent placement and to avoid signal artifacts from the orbits. To address potential variability in voxel relocalization, the position of each subject’s head was noted using the angle of the interpupillary line, which was compared with the transverse landmark light on the scanner. The outer canthus and external auditory meatus were aligned with the transverse landmark light on the scanner and the position of the intersection with the longitudinal light along the midline (typically on the nose) to determine the angle of head flexion-extension. Head motion was minimized by comfortably securing subjects’ heads with padding within the quadrature head coil (DelBello et al 2005).
The medial prefrontal (predominately gray matter) voxel included the orbital frontal, middle frontal and cingulate gyri, corresponding to Brodmann areas 9, 10, 24, 32, and 47 (Cecil et al 2002). The lateral prefrontal (predominately white matter) voxels were positioned at the same level as the medial prefrontal voxel (Figure 1). The level was chosen such that the inferior portion of the lateral prefrontal white matter voxels would not include the orbital gyri. The lateral prefrontal white matter voxels were positioned lateral to Brodmann areas 10, 45, and 46 (Cecil et al 2002). Single voxel magnetic resonance spectroscopy was acquired with the proton brain examination (PROBE) software (General Electric Medical System, Milwaukee, WI) using a point resolved spectroscopy acquisition mode (PRESS) sequence (TE = 35 msec, TR = 2 seconds with 64 averages) and with automatic shimming to achieve water line widths of <5 Hz (Figure 2). A reference spectrum, acquired within the PROBE acquisition, collected 16 acquisitions of unsuppressed water signal for eddy current and baseline corrections.
Figure 1.
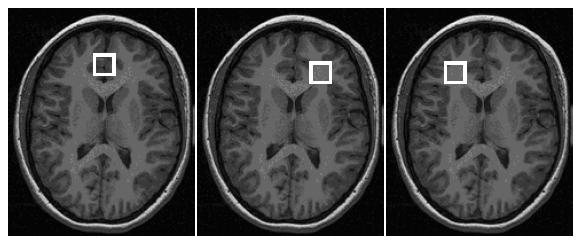
Medial, and left and right prefrontal cortex voxel placement
Figure 2.
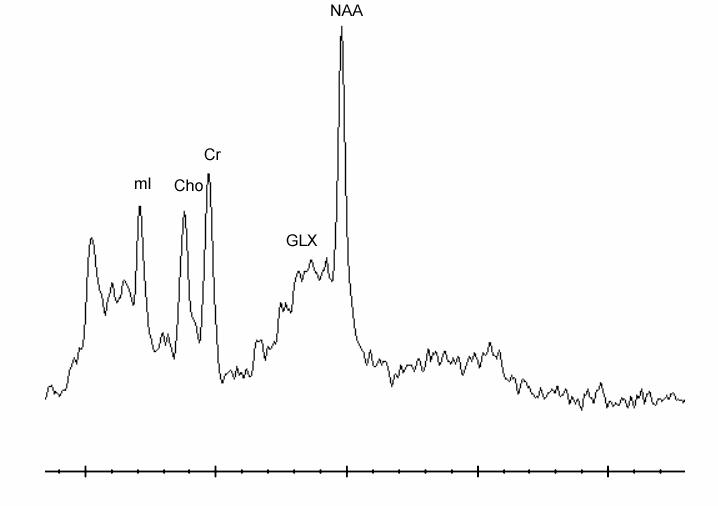
Short echo time (TE = 35 msec) proton magnetic resonance spectrum acquired within the medial prefrontal cortex of a 12 year old, male patient*
*Cho = choline, Cr = creatine/phosphocreatine, Glx = glutamate/glutamine, mI = myo-inositol, NAA = N-acetyl aspartate.
Data were processed using the Linear Combination (LC) Model program, which is a commercially available, user-independent frequency domain spectral-fitting program that provides measures of metabolite concentrations (Provencher 1993) and uses the water reference signal as an internal standard. The program uses in vitro spectra of the expected metabolites as model functions. Concentrations of mI, choline (Cho), creatine/phosphocreatine (Cr), and glutamate/glutamine (Glx) were determined in each spectrum. The concentrations are reported in institutional units (IU), rather than millimolar levels since corrections for field and coil inhomogeneities as well as T1 and T2 relaxation effects are not accounted for due to the excessive examination times required to determine such effects. However, metabolite concentrations were adjusted for amount of cerebral spinal fluid (CSF) in each voxel (Cecil et al 2002). Specifically, the LC Model software determines the metabolite concentrations assuming a parenchymal volume as prescribed (8 cm3). To compensate for the parenchymal assumption, we used a K-means segmentation algorithm employed for analysis of the volumetric FSPGR sequence incorporated into custom software to determine gray, white and CSF contributions to each voxel for each subject for each scan. We then applied a scale factor based upon the ratio of volume of CSF to total volume and adjusted each metabolite concentration accordingly (DelBello et al 2005). For inclusion in the data analysis, a metabolite Cramer-Rao bound had to be less than 10. The mI mean values for the three voxels were approximately 7.
Statistical analyses
All analyses were performed using the Statistical Analysis System (SAS) for the PC (SAS Institute, Cary, NC, 1999) and significance was defined a priori as p=0.05 unless otherwise specified. Changes over time in mI concentrations within each voxel of interest were examined within the bipolar depressed adolescents using likelihood-based mixed-model repeated measures analysis of variance (SAS PROC MIXED). This method of longitudinal data analysis utilizes all available data, handles missing data more appropriately than last observation carried forward (LOCF) repeated measures analysis of variance, properly accounts for correlation between repeated measurements on the same subject, and demonstrates greater flexibility to model time effects. Likelihood-based mixed-effects models avoid biased treatment estimates that might be introduced with LOCF analyses (Gueorguieva and Krystal 2004). Post hoc paired t-tests with corrections for multiple comparisons were performed to identify differences in mI concentrations between time points; significance for these post hoc comparisons was p=0.02 (0.05/3). Within-group effect sizes for change in mI concentrations at days 7 and 42 from baseline were determined using Cohen’s d (Cohen 1988). Pearson correlation coefficients were computed to identify statistically significant associations among change in mI concentrations and CDRS-R and YMRS scores.
To examine the effects of categorical symptom resolution on 1H MRS measures, the bipolar depressed adolescent sample was categorized into remitters and non-remitters. The same analyses described above were conducted comparing these respective groups, and differences in baseline mI concentrations were evaluated using Student’s t-tests. Descriptive statistics for the mean (SD) concentrations of Cho, Cr, and Glx within each voxel of interest are reported. Other analyses were performed as necessary.
Results
Fifty-three patients were screened for this study. Sixteen patients did not meet diagnostic criteria for bipolar I disorder, depressed, 3 refused to participate, and 1 had a seizure disorder and substance use disorder. Two patients with braces (a contraindication to having a 1H MRS scan) were also excluded. Three of the 31 patients who enrolled did not start lithium treatment because of a baseline YMRS total score of 25 (n=1) and claustrophobia during the baseline MRS scan (n=2). Therefore, a total of 28 patients who started lithium treatment had at least 1 1H MRS scan and provided data for the repeated measures analyses evaluating change over time in mI concentrations. Two (7%) patients did not have day 7 and day 42 scans, and 3 (18%) patients did not have day 42 scans. Data from these 5 patients were excluded only from the correlation analyses of change in mI concentrations and CDRS-R scores at respective timepoints.
The majority were female (82%) and white (79%), with a mean age of 15.5 years (SD = 1.5). The mean self-rated Tanner score was 4.4 (SD = 0.7). The mean age at onset was 11.4 years (SD = 4.0, n = 26). Six (22%) patients presented with psychosis, and 15 (54%) patients had a comorbid disruptive behavioral disorder, including 7 (47%) with attention-deficit hyperactivity disorder (ADHD). Baseline mean CDRS-R and YMRS scores were 63.2 (SD = 12.6) and 15.0 (SD = 6.9), respectively.
A significant main effect for time was observed for CDRS-R scores (F6, 130 = 19.3, p < 0.001) (Figure 3), with mean scores at all weeks significantly lower than that at baseline (p < 0.001). Eight patients (29%) achieved remission; there were no significant demographic or clinical (including mean maximum and endpoint serum lithium levels) differences between remitters and nonremitters. No significant main effects for time were observed for YMRS scores (F6, 130 = 1.7, p = 0.1).
Figure 3.

Change over time in medial prefrontal mI concentrations and CDRS-R scores*†‡ *CDRS-R = Children’s Depression Rating Scale, Revised; IU = institutional units of concentration; mI = myo-inositol. †Significant main effects for time: mI (p = 0.03), CDRS-R (p < 0.001). ‡mI: day 42 different from day 7 (p = 0.02), CDRS-R: days 7-42 different from day 0 (p < 0.001).
1H MRS: Total Sample
In the medial prefrontal cortex, a significant main effect for time was observed for mI concentrations (F2,47 = 3.8, p = 0.03) (Table 1, Figure 3). Baseline mI concentrations did not significantly differ from day 7 or day 42 concentrations. Concentrations of mI on day 42 were significantly higher than those on day 7 (t = 2.5, p = 0.02). A significant main effect for time was also found in right lateral prefrontal mI concentrations (F2,47 = 3.2, p = 0.05). Baseline mI concentrations did not significantly differ from day 7 or day 42 concentrations, but mI concentrations on day 42 were significantly higher than those on day 7 (t = 2.5, p = 0.02). No significant main effect for time was seen in left lateral prefrontal mI concentrations (F2,46 = 0.7, p = 0.5). When the 5 patients who had missing scan data were excluded from these analyses, a significant main effect for time was observed only in medial prefrontal mI concentrations (F2,44 = 3.6, p = 0.04).
Table 1.
Adjusted mean mI concentrations over time (n = 28)*
| Mean (SD) Concentrations in IU |
||||||
|---|---|---|---|---|---|---|
| Voxel | Day 0 | Day 7 | Day 42 | p-value (main for time) | p-value (post hoc comparisons) | Effect size (post hoc comparisons) |
| Medial prefrontal | 4.9 (0.5) | 4.7 (0.6) | 5.0 (0.6) | 0.03 | Day 0 vs. day 7: 0.1 | Day 0 vs. day 7: 0.4 |
| cortex | Day 7 vs. day 42:0.02 | Day 7 vs. day 42: 0.5 | ||||
| Day 0 vs. day 42: 0.2 | ||||||
| Day 0 vs. day 42: 0.4 | ||||||
| Left lateral prefrontal white matter | 4.6 (1.0) | 4.4 (1.1) | 4.6 (1.2) | 0.5 | - | - |
| Right lateral prefrontal white matter | 4.3 (0.7) | 4.0 (0.7) | 4.4 (0.7) | 0.05 | Day 0 vs. day 7: 0.2 | Day 0 vs. day 7: 0.4 |
| Day 7 vs. day 42: 0.02 | Day 7 vs. day 42: 0.6 | |||||
| Day 0 vs. day 42: 0.2 | ||||||
| Day 0 vs. day 42: 0.3 | ||||||
IU = institutional units; mI = myo-inositol; SD = standard deviation.
Change in mI concentrations in the medial prefrontal cortex from baseline to day 7 did not correlate with change in CDRS-R scores over the same period (p = 0.2). Change in mI concentrations in the medial prefrontal cortex from day 7 to day 42 was significantly correlated with change in CDRS-R scores from day 7 to day 42 (r = 0.4, p = 0.04). No significant relationship was found between change in serum lithium levels and medial prefrontal mI concentrations from day 7 to day 42 (p = 0.3). Change in mI concentrations in the right lateral prefrontal cortex did not correlate with change in CDRS-R scores (baseline to day 7: p = 0.3; day 7 to day 42: p = 0.4) or serum lithium levels (day 7 to day 42: p = 0.9).
Table 2 shows the mean (SD) concentrations of Cho, Cr, and Glx at baseline, day 7, and day 42 in the medial, and left and right prefrontal cortices.
Table 2.
Mean concentrations of Cho, Cr, and Glx at baseline, day 7, and day 42 (n = 28)*
| Neurometabolite | Voxel | Mean (SD) Concentrations in IU |
||
|---|---|---|---|---|
| Day 0 | Day 7 | Day 42 | ||
| Cho | Medial prefrontal cortex | 1.3 (0.2) | 1.4 (0.2) | 1.4 (0.2) |
| Left lateral prefrontal white matter | 1.7 (0.2) | 1.7 (0.2) | 1.7 (0.3) | |
| Right lateral prefrontal white matter | 1.6 (0.2) | 1.7 (0.2) | 1.7 (0.3) | |
| Cr | Medial prefrontal cortex | 5.5 (0.5) | 5.4 (0.5) | 5.6 (0.5) |
| Left lateral prefrontal white matter | 4.6 (0.6) | 4.4 (0.6) | 4.5 (0.6) | |
| Right lateral prefrontal white matter | 4.4 (0.6) | 4.3 (0.7) | 4.6 (0.7) | |
| Glx | Medial prefrontal cortex | 12.3 (1.3) | 12.8 (1.3) | 13.2 (1.4) |
| Left lateral prefrontal white matter | 8.9 (1.3) | 8.6 (1.4) | 8.9 (1.5) | |
| Right lateral prefrontal white matter | 9.5 (1.5) | 9.4 (1.5) | 9.3 (1.6) | |
Cho = choline, Cr = creatine/phosphocreatine, Glx = glutamate/glutamine, IU = institutional units; SD = standard deviation.
1H MRS: Remitters versus non-remitters
No significant interactions for time by remission status were observed with regard to mI concentrations in the medial prefrontal cortex (F2,45 = 1.3, p = 0.3), and the left (F2,44 = 0.4, p = 0.7) and right (F2,45 = 0.3, p = 0.8) lateral prefrontal cortices. At baseline, mI concentrations in the medial prefrontal cortex were significantly lower for remitters compared to non-remitters (t = 3.3, p = 0.003) (Table 3). There were no differences in baseline left (p = 0.5) and right (p = 0.4) lateral prefrontal mI concentrations based upon remission status. Day 7 and day 42 mI concentrations in all voxels of interest did not differ between remitters and non-remitters (p > 0.1 for all comparisons). In remitters, change in mI concentrations from day 7 to day 42 in the medial and right lateral prefrontal cortices significantly correlated with change in CDRS-R scores during the same timeframe (r = 0.7, p = 0.04 and r = 0.7, p = 0.05, respectively).
Table 3.
Comparison of baseline mI concentrations between remitters (n = 8) and non-remitters (n = 20)*
| Mean (SD) Concentrations in IU |
||||
|---|---|---|---|---|
| Remitters | Non-remitters | p-value | Effect size | |
| Medial prefrontal cortex | 4.6 (0.2) | 5.0 (0.5) | 0.003 | 0.9 |
| Left lateral prefrontal white matter | 4.3 (0.7) | 4.6 (1.2) | 0.5 | 0.3 |
| Right lateral prefrontal white matter | 4.1 (0.7) | 4.3 (0.5) | 0.4 | 0.4 |
IU = institutional units; mI = myo-inositol; SD = standard deviation.
Discussion
The results of this 6-week 1H MRS study of adolescents with bipolar depression show that lithium administration does not result in significant changes from baseline in mI concentrations in the medial, and left and right lateral prefrontal cortices. Concentrations of mI in the medial and right lateral prefrontal cortices at day 42 were significantly higher than those at day 7. These findings suggest that the “inositol depletion” hypothesis may not be the mechanism of action of lithium in patients with bipolar depression, which is consistent with the Bonferroni corrected results of Moore et al (1999) as well as those reported by Friedman et al (2004).
A potential explanation for the observed increase in mI concentrations in the medial and right lateral prefrontal cortices with chronic lithium treatment (day 7 to day 42) may be the up-regulation of IMPase activity. Studies in rat brains have reported increased IMPase activity with lithium in the cerebral cortex (Renshaw et al 1986), as well as other brain regions, including the hippocampus, cerebellum, and striatum (Parthasarathy et al 2003). Kaya et al (2004) recently reported increased erythrocyte IMPase activity in euthymic patients on chronic lithium monotherapy compared to nonlithium treated euthymic patients and healthy subjects. Although no difference in leukocyte IMPase activity between the subgroups existed, leukocyte IMPase activity and duration of lithium treatment was positively correlated. It should be noted, however, that the sample in the study conducted by Kaya et al (2004) included only 8 (13%) bipolar depressed patients, the mean duration of lithium treatment was 30.4 months (SD = 24.6), and mI brain concentrations were not measured simultaneously with IMPase activity. Increased IMPase activity, in conjunction with increased IMPase mRNA levels seen with lithium (Nemanov et al 1999), suggests that chronic lithium treatment may result in the up-regulation of IMPase activity. In turn, this would result in increased dephosphorylation of inositol monophosphates to produce mI (Silverstone et al 2005).
The onset of clinical improvement in adults with bipolar depression occurred after 5 to 7 days of lithium treatment (Moore et al 1999). In contrast, the greatest degree of improvement in severity of depressive symptoms, indicated by the change in CDRS-R scores, occurred during the first week of treatment in the current study. This rapid improvement may be partially explained by hospitalization because there was no significant decrease in medial prefrontal mI concentrations from baseline to day 7 and no significant correlation in change in medial prefrontal mI concentrations and CDRS-R scores. However, our findings do suggest that increases in mI concentrations with chronic lithium treatment may still correspond with therapeutic benefit. As seen in Figure 2, group mean mI concentrations in medial prefrontal mI concentrations from day 7 to day 42 paralleled continued decreases in group mean CDRS-R scores. In support, preliminary studies of exogenous inositol have demonstrated antidepressant effects in unipolar and bipolar depression (Levine et al 1995; Chengappa et al 2000), although more research is clearly needed to address this treatment approach. It should be noted, however, that our correlation analyses indicated that changes in medial prefrontal mI concentrations and CDRS-R scores from day 7 to day 42 were positively correlated. Upon detailed examination of the data to determine possible reasons for this unexpected correlation, it was observed that individual patients with smaller increases in medial prefrontal mI concentrations had larger decreases in CDRS-R scores from day 7 to day 42.
Our results also suggest that lower baseline mI concentrations in the medial prefrontal cortex may predict lithium remission. Because the remission rate was relatively low (29%), this finding should be interpreted with caution. While the use of 1H MRS in routine clinical practice is not established, knowledge of neurochemical predictors of remission with pharmacological treatments may eventually provide a means to identify a specific agent that when administered, would improve the overall prognosis of specific adolescents with bipolar disorder.
The study’s results should be viewed in the context of its limitations. First, the lack of a healthy comparison group did not allow for the assessment of normal variability in mI concentrations over the 42-day study period and between time points. In our study examining the neurochemical effects of olanzapine on brain metabolites, healthy subjects did not show significant variation over 28 days in mI concentrations (DelBello et al 2005). The data acquisition for the DelBello et al (2005) study was concurrent and on the same MRS scanner as the current study. Second, nonsignificant core findings in our study may be explained by a lack of statistical power in the available sample. Analyses based upon remission status may not have been adequately powered as these analyses were considered secondary. Third, the short washout period may have confounded the results, as prior use of certain psychotropic medications, such as divalproex sodium, may have effects on brain mI concentrations (Moore et al 2000; Silverstone et al 2002). Fourth, quantifying brain mI concentrations with 1H MRS results is inherently confounded due to spectral overlap between mI, inositol monophosphates, and glycine. In the current study, increases in the mI peak seen with chronic lithium treatment in the medial prefrontal cortex, which is predominantly gray matter, may be partially attributable to increases in inositol monophosphates (O’Donnell et al 2003; Renshaw et al 1986) and glycine (Deutsch et al 1983). The use of higher strength spectroscopy systems with increased spectral dispersion and sensitivity may resolve this issue of co-resonance and to provide a clearer picture of lithium’s possible mechanism of action. In addition, the TR was short (2s), which may have confounded mI quantification because the water signal was not fully relaxed. A prior study we conducted in adult bipolar disorder patients (Cecil et al 2002) used an extended TR of 5s. This did not improve our quantification, but rather it limited our ability to sample in other areas of interest implicated in bipolar disorder. Finally, we investigated the effects of lithium on neurometabolites in the medial prefrontal cortex, and left and right lateral prefrontal white matter including some inevitable contributions from the cortex. Future studies should investigate other specific regions in which mI has been implicated in the neurophysiology of bipolar disorder, such as the dorsolateral prefrontal cortex (Frey et al 2005), anterior cingulate cortex (Davanzo et al 2001; Davanzo et al 2003), and basal ganglia (Sharma et al 1992). Despite these limitations, this is the first 1H MRS study in adolescents with bipolar depression examining the longitudinal effects of lithium treatment on mI concentrations in the prefrontal cortex.
In conclusion, acute and chronic lithium treatment in adolescents with bipolar depression may not significantly change prefrontal mI concentrations compared to baseline values, arguing against the “inositol depletion” hypothesis. Up-regulation in IMPase activity secondary to continued lithium administration may lead to increases in brain mI concentrations. Further investigation of the neurochemical effects of lithium on mI is warranted in studies with larger samples of adolescents with bipolar depression and a healthy comparison group in order to better understand possible mechanisms behind lithium’s antidepressant activity.
Acknowledgments
This study was supported in part by a Klingenstein Third Generation Foundation Fellowship (MPD), NIMH grant MH63373 (MPD), NIEHS grants ES011261, ES013524, EPA R82938901 (KMC), and the Stanley Medical Research Institute (SMS). The authors appreciate the support of the CCHMC Adolescent Medicine Psychiatric Service attending, nursing, social work, and administrative staff. This study was presented in part at the “Collaborative Pediatric Bipolar Conference,” on April 16, 2005 in Coral Gables, FL. The conference was funded by a NIH grant MH064077 (J. Biederman).
Dr. Patel serves on the speakers’ bureaus for Eli Lilly, and is a consultant for Eli Lilly and Shire. Dr. DelBello has received research support from Abbott Laboratories, AstraZeneca, Eli Lilly, Janssen, Ortho-McNeil, and Shire, is on the speakers’ bureau for Abbott Laboratories, AstraZeneca, Eli Lilly, GlaxoSmithKline, Janssen, Ortho-McNeil, and Pfizer, and is a consultant for AstraZeneca, Eli Lilly, Janssen, and Ortho-McNeil. Dr. Adler is a consultant for AstraZeneca. Dr. Strakowski has received research support from AstraZeneca, Eli Lilly, Forest Laboratories, and Janssen, is a consultant to AstraZeneca, Bristol-Myers Squibb, Eli Lilly, and Ortho-McNeil, and is on the speakers’ bureau of all of these companies as well. Dr. Cecil, Mrs. Bryan, and Mr. Stanford have no financial relationships to disclose.
References
- Berridge MJ. The Albert Lasker Medical Awards. Inositol trisphosphate, calcium, lithium, and cell signaling. JAMA. 1989;262:1834–1841. [PubMed] [Google Scholar]
- Bhangoo RK, Lowe CH, Myers FS, Treland J, Curran J, Towbin KE, Leibenluft E. Medication use in children and adolescents treated in the community for bipolar disorder. J Child Adolesc Psychopharmacol. 2003;13:515–522. doi: 10.1089/104454603322724904. [DOI] [PubMed] [Google Scholar]
- Cecil KM, DelBello MP, Morey R, Strakowski SM. Frontal lobe differences in bipolar disorder as determined by proton MR spectroscopy. Bipolar Disord. 2002;4:357–365. doi: 10.1034/j.1399-5618.2002.02235.x. [DOI] [PubMed] [Google Scholar]
- Cheng L, Lumb M, Polgar L, Mudge AW. How can the mood stabilizer VPA limit both mania and depression? Mol Cell Neurosci. 2005;29:155–161. doi: 10.1016/j.mcn.2004.12.003. [DOI] [PubMed] [Google Scholar]
- Chengappa KN, Levine J, Gershon S, Mallinger AG, Hardan A, Vagnucci A, et al. Inositol as an add-on treatment for bipolar depression. Bipolar Disord. 2000;2:47–55. doi: 10.1034/j.1399-5618.2000.020107.x. [DOI] [PubMed] [Google Scholar]
- Cohen L. Statistical Power Analysis for the Behavioral Sciences. Erlbaum; Hillsdale, NJ: 1988. [Google Scholar]
- Dager SR, Friedman SD, Parow A, Demopulos C, Stoll AL, Lyoo IK, et al. Brain metabolic alterations in medication-free patients with bipolar disorder. Arch Gen Psychiatry. 2004;61:450–458. doi: 10.1001/archpsyc.61.5.450. [DOI] [PubMed] [Google Scholar]
- Davanzo P, Thomas MA, Yue K, Oshiro T, Belin T, Strober M, McCracken J. Decreased anterior cingulate myo-inositol/creatine spectroscopy resonance with lithium treatment in children with bipolar disorder. Neuropsychopharmacology. 2001;24:359–369. doi: 10.1016/S0893-133X(00)00207-4. [DOI] [PubMed] [Google Scholar]
- Davanzo P, Yue K, Thomas MA, Belin T, Mintz J, Venkatraman TN, et al. Proton magnetic resonance spectroscopy of bipolar disorder versus intermittent explosive disorder in children and adolescents. Am J Psychiatry. 2003;160:1442–1452. doi: 10.1176/appi.ajp.160.8.1442. [DOI] [PubMed] [Google Scholar]
- DelBello MP, Cecil KM, Adler CM, Daniels JP, Strakowski SM. Neurochemical effects of olanzapine in first-hospitalization manic adolescents: a proton magnetic resonance spectroscopy study. Neuropsychopharmacology. 2005 doi: 10.1038/sj.npp.1300950. [Epub ahead of print] [DOI] [PubMed] [Google Scholar]
- DelBello MP, Soutullo CA, Hendricks W, Niemeier RT, McElroy SL, Strakowski SM. Prior stimulant treatment in adolescents with bipolar disorder: association with age at onset. Bipolar Disord. 2001;3:53–57. doi: 10.1034/j.1399-5618.2001.030201.x. [DOI] [PubMed] [Google Scholar]
- Deutsch SI, Stanley M, Peselow ED, Banay-Schwartz M. Glycine: a possible role in lithium’s action and affective illness. Neuropsychobiology. 1983;9:215–218. doi: 10.1159/000117967. [DOI] [PubMed] [Google Scholar]
- Emslie GJ, Heiligenstein JH, Wagner KD, Hoog SL, Ernest DE, Brown E, et al. Fluoxetine for acute treatment of depression in children and adolescents: a placebo-controlled, randomized clinical trial. J Am Acad Child Adolesc Psychiatry. 2002;41:1205–1215. doi: 10.1097/00004583-200210000-00010. [DOI] [PubMed] [Google Scholar]
- Frey BN, Folgierini M, Nicoletti M, Machado-Vieira R, Stanley JA, Soares JC, Kapczinski F. A proton magnetic resonance spectroscopy investigation of the dorsolateral prefrontal cortex in acute mania. Hum Psychopharmacol. 2005;20:133–139. doi: 10.1002/hup.671. [DOI] [PubMed] [Google Scholar]
- Frey R, Metzler D, Fischer P, Heiden A, Scharfetter J, Moser E, Kasper S. Myo-inositol in depressive and healthy subjects determined by frontal 1H-magnetic resonance spectroscopy at 1.5 tesla. J Psychiatr Res. 1998;32:411–420. doi: 10.1016/s0022-3956(98)00033-8. [DOI] [PubMed] [Google Scholar]
- Friedman SD, Dager SR, Parow A, Hirashima F, Demopulos C, Stoll AL, et al. Lithium and valproic acid treatment effects on brain chemistry in bipolar disorder. Biol Psychiatry. 2004;56:340–348. doi: 10.1016/j.biopsych.2004.06.012. [DOI] [PubMed] [Google Scholar]
- Geller B, Zimerman B, Williams M, Bolhofner K, Craney JL, DelBello MP, Soutullo C. Reliability of the Washington University in St. Louis Kiddie Schedule for Affective Disorders and Schizophrenia (WASH-U-KSADS) mania and rapid cycling sections. J Am Acad Child Adolesc Psychiatry. 2001;40:450–455. doi: 10.1097/00004583-200104000-00014. [DOI] [PubMed] [Google Scholar]
- Gueorguieva R, Krystal JH. Move over ANOVA: progress in analyzing repeated-measures data and its reflection in papers published in the Archives of General Psychiatry. Arch Gen Psychiatry. 2004;61:310–317. doi: 10.1001/archpsyc.61.3.310. [DOI] [PubMed] [Google Scholar]
- Hallcher LM, Sherman WR. The effects of lithium ion and other agents on the activity of myo-inositol-1-phosphatase from bovine brain. J Biol Chem. 1980;255:10896–10901. [PubMed] [Google Scholar]
- Kaya N, Resmi H, Ozerdem A, Guner G, Tunca Z. Increased inositol-monophosphatase activity by lithium treatment in bipolar patients. Prog Neuropsychopharmacol Biol Psychiatry. 2004;28:521–527. doi: 10.1016/j.pnpbp.2004.01.020. [DOI] [PubMed] [Google Scholar]
- Kowatch RA, Fristad M, Birmaher B, Wagner KD, Findling RL, Hellander M, Child Psychiatric Workgroup on Bipolar Disorder Treatment guidelines for children and adolescents with bipolar disorder. J Am Acad Child Adolesc Psychiatry. 2005;44:213–235. doi: 10.1097/00004583-200503000-00006. [DOI] [PubMed] [Google Scholar]
- Levine J, Barak Y, Gonzalves M, Szor H, Elizur A, Kofman O, Belmaker RH. Double-blind, controlled trial of inositol treatment of depression. Am J Psychiatry. 1995;152:792–794. doi: 10.1176/ajp.152.5.792. [DOI] [PubMed] [Google Scholar]
- Manji HK, Lenox RH. Lithium: a molecular transducer of mood-stabilization in the treatment of bipolar disorder. Neuropsychopharmacology. 1998;19:161–166. doi: 10.1016/S0893-133X(98)00021-9. [DOI] [PubMed] [Google Scholar]
- Moore CM, Breeze JL, Gruber SA, Babb SM, Frederick BB, Villafuerte RA, et al. Choline, myo-inositol and mood in bipolar disorder: a proton magnetic resonance spectroscopic imaging study of the anterior cingulate cortex. Bipolar Disord. 2000;2:207–216. doi: 10.1034/j.1399-5618.2000.20302.x. [DOI] [PubMed] [Google Scholar]
- Moore GJ, Bebchuk JM, Parrish JK, Faulk MW, Arfken CL, Strahl-Bevacqua J, Manji HK. Temporal dissociation between lithium-induced changes in frontal lobe myo-inositol and clinical response in manic-depressive illness. Am J Psychiatry. 1999;156:1902–1908. doi: 10.1176/ajp.156.12.1902. [DOI] [PubMed] [Google Scholar]
- Nemanov L, Ebstein RP, Belmaker RH, Osher Y, Agam G. Effect of bipolar disorder on lymphocyte inositol monophosphatase mRNA levels. Int J Neuropsychopharmacol. 1999;2:25–29. doi: 10.1017/S1461145799001315. [DOI] [PubMed] [Google Scholar]
- O’Donnell T, Rotzinger S, Ulrich M, Hanstock CC, Nakashima TT, Silverstone PH. Effects of chronic lithium and sodium valproate on concentrations of brain amino acids. Eur Neuropsychopharmacol. 2003;13:220–227. doi: 10.1016/s0924-977x(03)00070-1. [DOI] [PubMed] [Google Scholar]
- Parthasarathy LK, Seelan RS, Wilson MA, Vadnal RE, Parthasarathy RN. Regional changes in rat brain inositol monophosphatase 1 (IMPase 1) activity with chronic lithium treatment. Prog Neuropsychopharmacol Biol Psychiatry. 2003;27:55–60. doi: 10.1016/s0278-5846(02)00315-9. [DOI] [PubMed] [Google Scholar]
- Patel NC, DelBello MP, Bryan HS, Adler CM, Kowatch RA, Stanford KE, Strakowski SM. Open-label lithium for the treatment of adolescents with bipolar depression. J Am Acad Child Adolesc Psychiatry. 2006;45:289–297. doi: 10.1097/01.chi.0000194569.70912.a7. [DOI] [PubMed] [Google Scholar]
- Poznanski E, Mokros H. Children’s Depression Rating Scale-Revised. WPS; Los Angeles, CA: 1995. [Google Scholar]
- Provencher SW. Estimation of metabolite concentrations from localized in vivo proton NMR spectra. Magn Reson Med. 1993;30:672–679. doi: 10.1002/mrm.1910300604. [DOI] [PubMed] [Google Scholar]
- Renshaw PF, Joseph NE, Leigh JS., Jr Chronic dietary lithium induces increased levels of myo-inositol-1-phosphatase activity in rat cerebral cortex homogenates. Brain Res. 1986;380:401–404. doi: 10.1016/0006-8993(86)90245-3. [DOI] [PubMed] [Google Scholar]
- Sharma R, Venkatasubramanian PN, Barany M, Davis JM. Proton magnetic resonance spectroscopy of the brain in schizophrenic and affective patients. Schizophr Res. 1992;8:43–49. doi: 10.1016/0920-9964(92)90059-e. [DOI] [PubMed] [Google Scholar]
- Silverstone PH, McGrath BM, Kim H. Bipolar disorder and myo-inositol: a review of the magnetic resonance spectroscopy findings. Bipolar Disord. 2005;7:1–10. doi: 10.1111/j.1399-5618.2004.00174.x. [DOI] [PubMed] [Google Scholar]
- Silverstone PH, Wu RH, O7#X2019;Donnell T, Ulrich M, Asghar SJ, Hanstock CC. Chronic treatment with both lithium and sodium valproate may normalize phosphoinositol cycle activity in bipolar patients. Hum Psychopharmacol. 2002;17:321–327. doi: 10.1002/hup.420. [DOI] [PubMed] [Google Scholar]
- Spearing MK, Post RM, Leverich GS, Brandt D, Nolen W. Modification of the Clinical Global Impressions (CGI) Scale for use in bipolar illness (BP): the CGI-BP. Psychiatry Res. 1997;73:159–171. doi: 10.1016/s0165-1781(97)00123-6. [DOI] [PubMed] [Google Scholar]
- Stork C, Renshaw PF. Mitochondrial dysfunction in bipolar disorder: evidence from magnetic resonance spectroscopy research. Mol Psychiatry. 2005;10:900–919. doi: 10.1038/sj.mp.4001711. [DOI] [PubMed] [Google Scholar]
- Vaden DL, Ding D, Peterson B, Greenberg ML. Lithium and valproate decrease inositol mass and increase expression of the yeast INO1 and INO2 genes for inositol biosynthesis. J Biol Chem. 2001;276:15466–15471. doi: 10.1074/jbc.M004179200. [DOI] [PubMed] [Google Scholar]
- Young RC, Biggs JT, Ziegler VE, Meyers DA. A rating scale for mania: reliability, validity and sensitivity. Br J Psychiatry. 1978;133:429–435. doi: 10.1192/bjp.133.5.429. [DOI] [PubMed] [Google Scholar]