

Abstract
Two equivalent anthropomorphic breast phantoms were constructed, one for use in ultrasound elastography and the other in magnetic resonance (MR) elastography. A complete description of the manufacturing methods is provided. The materials used were oil-in-gelatin dispersions, where the volume percent oil differentiates the materials, primarily according to Young’s moduli. Values of Young’s moduli are in agreement with in vitro ranges for the corresponding normal and abnormal breast tissues. Ultrasound and nuclear magnetic resonance (NMR) properties are reasonably well represented. Phantoms of the type described promise to aid researchers who are developing hardware and software for elastography. Examples of ultrasound and MR elastograms of the phantoms are included to demonstrate the utility of the phantoms. Also, the level of stability of elastic properties of the component materials is quantified over a 15-month period. Such phantoms can serve as performance-assessing intermediaries between simple phantoms (consisting, for example, of homogeneous cylindrical inclusions in a homogeneous background) and a full-scale clinical trial. Thus, premature clinical trials may be avoided.
Keywords: Elastography, Elasticity, Phantom, Breast, Ultrasound, MR
INTRODUCTION
The ultimate test of the clinical utility of a new diagnostic imaging system consists of the clinical trial in which values of sensitivity and specificity regarding targeted diseases are determined. Obtaining adequate statistical significance requires a clinical study involving many patients and considerable time and cost. Many imaging systems show great promise but fail to live up to expectations in clinical trials.
Phantoms can aid in uncovering weaknesses in prototype imaging systems. It can be argued that the more closely a phantom mimics patients including, for example, ultrasound beam refraction at fat-to-nonfat interfaces (Madsen et al. 1980; 1982; 1988; 2006a) or the complicated spatial variations in stiffness at tumor boundaries, the more effective the phantom is as an aid for determining whether clinical trials are warranted. Such phantoms would be anthropomorphic and have representative normal and abnormal tissue types regarding geometries and physical properties. For the foreseeable future, however, it is unlikely that any phantom or set of phantoms will obviate clinical trials.
Elastography is usually facilitated with an intermediate imaging modality, particularly ultrasound (Ophir et al.1991; Cespedes et al. 1993; Gao et al.1995; Nightingale et al. 2002; O’Donnell et al.1994) or magnetic resonance (MR) (Plewes et al.1995; Muthupillai R et al. 1995; Muthupillai R et al.1996; Sinkus et al. 2000; Weaver et al. 2001). Thus, the various components of an anthropomorphic phantom should mimic tissue not only with respect to mechanical properties, but also with respect to ultrasound and/or MR properties. It is valuable to researchers involved in refining elastography systems that the mechanical, ultrasound and/or MR properties be quantified for each component of the phantom.
A small number of articles involving anthropomorphic breast phantoms for use in elastography has been published, and phantoms were not the main topics of those articles. Descriptions of production methods are limited, and tests for long-term stability of geometries and physical properties are not included.
One breast phantom has been made for use in quasi-static MR elastography (MRE) (Samani et al. 2001). This breast phantom is formed from polyvinyl chloride (PVC) and has three stiffnesses represented. A 12-mm diameter spherical simulated tumor exists at the center of a softer irregularly shaped simulated fibroglandular region, which is surrounded by a simulated adipose tissue layer. The method of production is abbreviated, however; for example, how different stiffness values are produced is not described. Although values of Young’s moduli are given, it is not clear whether the samples on which measurements were made came from the phantom or were separate quantities. Whether the physical properties are stable when different types (e.g, tumor, fibroglandular, adipose) are in direct contact is not addressed. Also, no values of nuclear magnetic resonance (NMR) relaxation times are given.
Another phantom that might be referred to as “anthropomorphic” is one formed from polyvinyl alcohol (PVA) (Sinkus et al. 2005). This material becomes stiffer with increasing number of freeze-thaw cycles (Chu and Rutt 1997). According to Sinkus et al. (2005), two “small square inclusions of about 6 mm edge length” exist in a uniform background. The term “square” may indicate that this phantom would be characterized as 2-D rather than 3-D. Magnetic resonance images of the phantom show an external boundary simulating that of a breast. The ratio of the shear modulus of the inclusions (~ 60 kPa) to that of the background (~ 40 kPa) is about 1.5. Typical ranges of NMR relaxation times are given in Chu and Rutt (1997): T1 of 600 to 800 ms and T2 of 60 to 80 ms. The T2 values might be lower than the actual values, however, because only simple spin-echo sequences were used on an MR imager for their determination. The PVA materials shrink with extrusion of liquid at the surface during freeze-thaw cycles; thus, it is not clear that adequate bonding occurred between the “6 mm squares” in the breast phantom and the background to ensure a “nonslip” condition at the boundary of the inclusion.
Finally, an MR breast phantom has been described by McKnight et al. (2002). The phantom has a cone shape with a rounded tip. A 2.5-cm diameter sphere of agarose, representing a stiffer lesion, is surrounded by bovine gelatin. It is not clear that there is bonding between the agarose sphere and the surrounding gelatin.
The only articles found that refer to anthropomorphic phantoms for use in ultrasound elastography are not breast phantoms. Two reports Baldeswing et al. (2004a, 2004b) describe a PVA vessel-mimicking phantom with a soft plaque represented. Perrey et al. (2003) also report on vessel phantoms with hard and soft plaques represented; the phantoms were made from agar and PVA.
We have constructed two nearly identical anthropomorphic breast phantoms, each with six simulated lesions and one fat clump surrounded by a simulated glandular parenchyma. Surrounding the latter is a layer of simulated subcutaneous fat. The materials consist of oil-in-gelatin dispersions in which different volume percentages of oil result in different mechanical, acoustic and NMR properties. One of the phantoms is for use in ultrasound quasi-static strain imaging (Ophir et al. 1991; Plewes et al.1995; Hall et al. 2003) and is kept submerged in a tank of safflower oil at all times, including during ultrasound imaging and elastography. The oil is an excellent vapor barrier, preventing desiccation of the aqueous gelatin-based phantom materials.
The other phantom is also stored in a tank of safflower oil, but when in use for MR shear wave elastography (Sinkus et al. 2000; Weaver et al. 2001), it must be removed from the oil bath for hours at a time. Therefore, this MR elastography phantom has an enclosing polyvinylidine chloride sheet (Saran Wrap®: The Dow Chemical Co., Midland, MI, USA) and an acrylic container to minimize desiccation during use. The MR breast phantom is not suitable for quasi-static ultrasound strain imaging because the rigid acrylic discs on the phantom would interfere with the use of broad compression plates. A complete description of manufacturing methods is given, as are values of relevant mechanical, ultrasound and MR properties for the component materials.
The reader should not infer that the purpose of the phantoms reported is merely to compare ultrasound elastography with MR elastography. Their purpose is to allow any user to assess and perhaps improve software and/or hardware for one elastography system or to compare results between two similar systems whether they are both ultrasound-based, both MR-based, or one is ultrasound- and the other is MR-based.
The possible level of geometric complexity and number of different mechanical property values is considerable in phantoms of the type described. Also, firm bonding occurs at interfaces between different materials except when measures are taken to discourage bonding. Such phantoms, however, appear to be limited to millimeter-scale objects or larger and formed from materials with isotropic physical properties. Thus, for example, fascia connecting different structures in real breasts may present a challenge to elastography but cannot be simulated in phantoms of the type described.
PHANTOM STRUCTURE
The MRE system used to obtain images in this study requires that the patient lie prone with the breast resting on a horizontal plate that vibrates in a horizontal plane to generate shear waves in the breast. The shape of the dependent breast during the procedure is approximately a right circular cylinder. As a result, the two phantoms produced have the external shape of a right circular cylinder. A side view of the MR form of the phantom is shown in Fig. 1 and a coronal view is shown in Fig. 2. A central tissue-mimicking (TM) glandular region has an outer boundary with irregularly positioned projections, each with a radius of curvature of 1.5 cm. The TM subcutaneous fat surrounds the TM glandular region and is in direct contact with it. The outer boundary of the TM subcutaneous fat defines the right circular cylinder and has a diameter of 12 cm and a height of 14 cm.
Fig. 1.
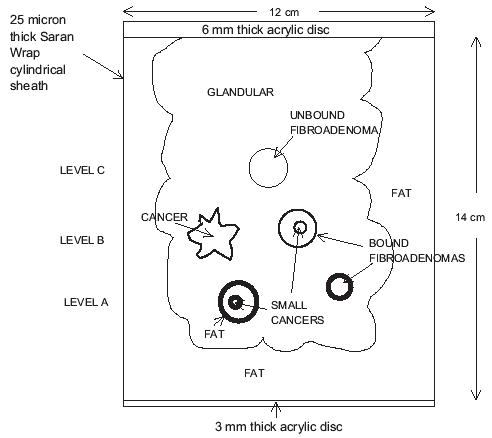
Side view of the MRE breast phantom with polyvinylidine chloride and acrylic vapor barrier. Three lesions at level A have very bold outlines, three at level B have less bold outlines, and the single inclusion at level C has the lightest outline. The purpose of the different outlines is to facilitate inclusion identification in Fig. 2.
Fig. 2.
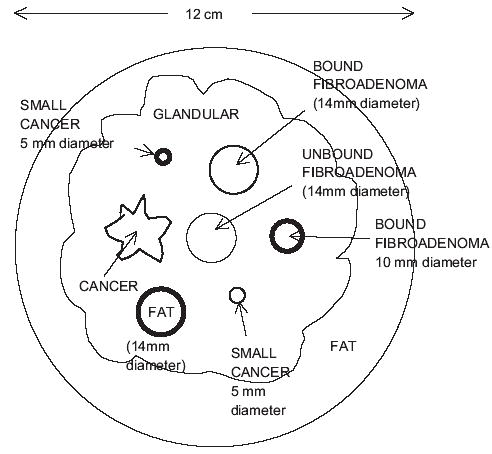
Coronal view of the MRE breast phantom.
Seven inclusions are suspended in the TM glandular region; all but one is spherical. At level A in Figs.1 and 2, there are a 14-mm diameter TM fat sphere, a 5-mm diameter TM cancer and a 10-mm diameter TM “bound” fibroadenoma. All three of these inclusions are bonded to the TM glandular material. At level B, there are three more inclusions, viz, a TM cancer with an irregular boundary, a 14-mm diameter TM bound fibroadenoma and a second 5-mm diameter TM cancer. Again, all three of these inclusions are firmly bonded to the TM glandular material. At level C, there is a single inclusion, viz., a 14-mm diameter TM “unbound” fibroadenoma. A thin layer of petrolatum separates this TM fibroadenoma from the surrounding TM glandular material; thus, little shear stress can occur between the TM unbound fibroadenoma and its surroundings. The reason for the presence of the TM unbound fibroadenoma is that it is thought that some in vivo fibroadenomas are very loosely bound to the surrounding tissue, and the TM unbound fibroadenoma in this phantom is an attempt to simulate that loose connection.
The curved external surface of the MRE phantom is enclosed in a 25-μm thick layer of polyvinylidine chloride, and the ends are covered with acrylic discs. The polyvinylidine chloride sheet is glued to the acrylic discs so that the phantom is sealed from air.
The phantom for use in ultrasound elastography (or in the quasi-static form of MR elastography [Plewes et al.1995]) has exactly the same geometry and inclusions, but there is no polyvinylidine chloride sheet nor are there acrylic discs enclosing it. The phantom is stored in a tank of safflower oil, and data for generating ultrasound elastograms are taken with the phantom in the tank.
In the case of the MR form of the phantom, the 3-mm thick acrylic disc shown in Fig. 1 is coupled to the vibrating plate of the MR elastography system by means of a thin rubber sheet.
MATERIALS AND THEIR PRODUCTION
All materials in the phantoms consist of dispersions of microscopic safflower oil droplets in (solid) aqueous gelatin. (Safflower oil is derived from the seeds of the safflower [Carthamus tinctorius] plant.) Stiffness decreases with increasing volume percent of oil; the volume percent is as low as 10% for simulated fibroadenomas and as high as 70% for simulated fat. The general procedure for producing a 50% oil-in-gelatin dispersion has been described elsewhere (Madsen et al. 2003; Madsen et al. 2006b). However, there are some differences in composition of the aqueous gelatin component for the materials in these breast phantoms, particularly the presence of propylene glycol to increase ultrasound propagation speeds and aid as a preservative. The complete procedure for producing the materials is given below. Briefly, a hot liquid aqueous gelatin is mixed with an equal amount of safflower oil and a small amount of surfactant producing an emulsion. If a volume percent oil less than 50% is needed, then more gelatin is mixed in. If a volume percent oil greater than 50% is needed, more oil is mixed in. Finally, an amount of cross-linking formaldehyde is added that is proportional to the amount of aqueous gelatin; the emulsion is cooled and poured into molds or containers for congealing.
Following is the step-by-step procedure for producing a 1400 mL quantity of 50% oil material, followed by the necessary modifications to the procedure to produce other oil percentages.
In a 1 L beaker, prepare a room temperature solution of 42 g of propylene glycol and 675.5 mL of 18 megohm-cm doubly de-ionized water.
Slowly add, while stirring, 107.8 g (dry weight) 200 bloom calf-skin gelatin (Vyse Gelatin Co., Schiller Park, IL,USA) so that no clumping occurs and a uniform “slurry” results.
Cover the beaker with a plastic food wrap such as polyethylene or polyvinylidine chloride, held in place with a rubber band. Punch a small hole or slit in the plastic wrap so that the gas pressure above the slurry during heating remains at atmospheric pressure.
Place the beaker in a larger container of hot water so that the level of the hot water is at or above the top of the gelatin slurry in the beaker. The larger container should be metal or Pyrex® (Corning Incorporated, Corning, NY, USA), so that it can be placed on a heat source, such as an electric hot plate.
Heat the water until the gelatin temperature rises to about 90°C and becomes transparent. Remove any bubbles at the meniscus. The transparent hot gelatin is referred to below as molten gelatin.
Remove the beaker of molten gelatin from the hot water bath and immerse it partially in a cold water bath. Cool the molten gelatin, while stirring, to 50°C and remove it from the cold water bath.
While cooling the molten gelatin in step 6, heat 700 mL of safflower oil to 50°C in a 2 L beaker.
Add 700 mL of the 50°C molten gelatin to the 50°C safflower oil (Hollywood brand, The Hain Celestial Group, Inc., Melville, NY, USA) and mix vigorously with a tablespoon that is bent at right angles near the bowl of the spoon. During mixing, keep the bowl of the spoon beneath the surface and moving about a horizontal axis, thus minimizing disturbance to the surface of the mixture. (See Fig. 1 in Madsen et al. [2003].)
Add 7.7 mL of Ultra Ivory® liquid surfactant (liquid Ultra Ivory®, Procter and Gamble Co., Cincinnati, OH, USA) or the equivalent (Contains anionic and nonionic surfactants and no phosphate; specific ingredients are proprietary [Procter and Gamble]) and continue the stirring motion until the emulsion is nearly white and a separation of oil does not occur when stirring is stopped.
Cool in the cold water bath to 40°C and slowly add with stirring 5.292 g of formalin. (Note that formalin is a 37% formaldehyde solution.) It is very important that the mass of added formaldehyde is accurate because the amount affects the stiffness of the resulting material. This accuracy can be accomplished by drawing formalin into a 10 mL syringe with a needle on the end, emptying the syringe except for residual that cannot be removed with the syringe piston, weighing the syringe plus needle plus residual formalin, drawing in 5.292 g of formalin (determined by re-weighing) and emptying the formalin into the emulsion.
Continue cooling the emulsion to about 34°C and pour into molds and other containers for further cooling and congealing. The congealing temperature is approximately 26°C.
Allow at least 8 h for cross-linking of the gelatin by formaldehyde to occur before removing the phantom component from its mold.
To make an oil dispersion at a lower volume percent oil, the above procedure should be modified as follows. In steps 1 and 2, increase the amounts of water, propylene glycol and dry weight gelatin by the same factor so that adequate residual 50°C molten gelatin exists to be combined with some of the 50% emulsion resulting from step 9 so that the desired volume percent oil can be realized. Step 10 above should also be replaced with the following:
10a. Add the appropriate amount of 50°C molten gelatin to yield the desired volume percent oil and stir well. For example, if it is desired to produce 1000 mL of 30% oil material, 400 mL of molten gelatin should be combined with 600 mL of the 50% oil emulsion produced in step 9.
10b. Cool in the cold water bath to 40°C and slowly add with stirring the mass of formalin such that the ratio of the mass of formalin to the volume of molten gelatin is 5.292/700g/mL = 0.00756g/mL.
To make a dispersion at a higher volume percent oil than 50%, replace step 10 with the following:
10a. Warm to 50°C the amount of safflower oil needed to increase the volume percent oil to the desired percentage. For example, if it is desired to produce 1000 mL of 70% oil material, 400 mL of safflower oil (at 50°C) should be added to 600 mL of the 50% emulsion produced in step 9.
10b. Add the 50°C safflower oil in 50 to 100 mL increments, mixing well after each addition to assure emulsification is complete. (Do not add any more surfactant.) Continue until all the safflower oil heated in step 10a has been added.
10c. Cool in the cold water bath to 40°C and slowly add with stirring the mass of formalin so that the ratio of the mass of formalin to the volume of molten gelatin is 5.292/700g/mL = 0.00756g/mL.
PHANTOM PRODUCTION
The phantom is produced using a series of molds. First, the lesions are produced by immersing two-part molds into a container of the 34°C molten material resulting from step 11 in the Materials and Their Production section. Figure 3 shows a photograph of two sets of two-part molds, one for producing a TM irregularly shaped simulated cancer (top) and another for producing six 14-mm diameter spherical TM fibroadenomas (bottom). Each of the bottom pair of molds has six hemispherical depressions. Each part of a two-part mold is immersed separately so that the depressions in each are filled with the 34°C molten material. Then, while both are still submerged, the two parts are brought together and clamped with a c-clamp so that the lesion is completely defined. The mold parts on the right each have two alignment pegs embedded in opposite corners; the mold parts on the left have corresponding holes to receive the pegs when the parts are clamped together.
Fig. 3.
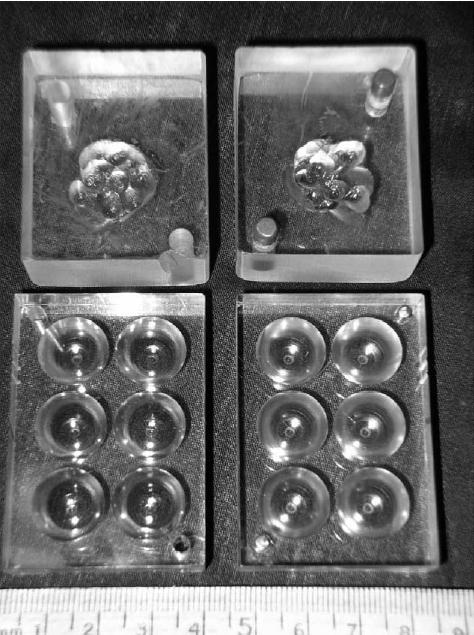
Photograph of two-part molds for making the TM irregular tumor (top pair) and six 14-cm diameter spherical TM fibroadenomas.
A set of four silicone molds defining the glandular section and allowing precise placement of the simulated lesion in that section also were produced by a molding procedure. First, two sheets of low-density polyethylene were heated to transparency and placed on a vacuum-activated acrylic mold, the latter having randomly positioned spherical depressions produced with a 3-cm diameter ball-end mill. Thus, with cooling, the polyethylene sheets have 3-cm diameter sphere surface sections, as shown in Fig. 4 (The two sheets are shown on the right and bottom left.) As shown on the upper left, the longer of these sheets is formed into a cylinder by fusing the ends with heating, and the shorter section is used to cap that cylinder, thus completing the mold for the glandular-to-fat interface mold. The convex spherical surfaces face outward.
Fig. 4.

Photograph of polyethylene sheets such as those used to form the mold defining the glandular region (right and lower left) and the completed mold (upper left).
The outer surface of the polyethylene glandular mold is coated with a mold-release layer, and the mold is then suspended in an acrylic cylindrical container with the closed-end down. The bottom and inner curved surfaces of the acrylic cylinder are also coated with a mold-release layer. Four successive quantities of two-part silicone are then poured between the glandular mold and the cylinder. Each quantity of silicone is allowed to harden completely; then its upper surface is also coated with a mold-release layer before the next layer of silicone is introduced. After all the silicone mold sections have solidified, the silicone sections and polyethylene mold are withdrawn from the acrylic cylinder, and the top three silicone sections are cut along a plane through the axis of the cylinder defined by the acrylic cylinder. The cuts allow the sections to be removed from the polyethylene mold. The four silicone mold sections are shown in Fig. 5, where the cuts are visible.
Fig. 5.

Four silicone mold sections used in forming the glandular region. One of the cuts in the three silicone rings allowing removal from the polyethylene mold is designated by the white arrow.
The TM lesions were positioned precisely in the TM glandular region using another molding procedure. For example, to produce the TM lesions shown in level A in Fig. 1, an acrylic disc with plastic spheres embedded to a depth of half their diameter into one side of the disc is placed on the bottom section of the silicone glandular mold with the hemispherical projections downward, as shown in Fig. 6. (Before placement, the downward surface of the plastic mold and the surface of the silicone mold that were to be in contact with TM material were coated with a thin layer of petrolatum to prevent adhering of the TM material). The three spheres—one transparent and two white— can be seen in Fig. 6. The hole on the lower side of the disc (white arrows in Fig. 6) is for the insertion of a filling tube (the sawed-off barrel of a syringe). Molten TM glandular material is poured through the syringe barrel, and the syringe piston is inserted so that no air exists inside. After approximately 24 h, the TM glandular material will have hardened and formaldehyde cross-linking will have been adequately advanced.
Fig. 6.

Bottom section of the silicone mold forming the glandular region with acrylic plate having hemispherical projections downward. There are three spheres visible (black arrows), two white and one nearly transparent. The hole for the filling syringe barrel is between the two white arrows.
The disc is then removed, a small amount of molten TM glandular material is introduced into each hemispherical socket, and the spherical lesions are quickly pressed into the sockets. There is sufficient molten material that the entire hemisphere is coated. The purpose of the small amount of molten TM glandular material is to act like a “glue” to aid in bonding the sphere to the previously hardened TM glandular material. After the “glue” has congealed (about 1 min), the next section of the glandular mold is placed on the first section, and the next layer of TM glandular material is introduced, etc. (The petrolatum adheres to the acrylic disc, not to the TM material.) The last acrylic disc has no lesion molds, but has three 8-mm long plastic pegs that project downward. These pegs keep the glandular region positioned on the base plate when the final step is performed, viz., introduction of the subcutaneous fat layer.
In the case of the TM “unbound” fibroadenoma, no TM glandular “glue” is used. Instead, the entire surface of the 14-mm diameter TM fibroadenoma is coated with a layer of petrolatum and then inserted into the hemispherical depression in the third TM glandular layer.
After the four-section TM glandular region has been completed and all silicone mold sections removed, (Prior to production of the TM glandular region, the two sides of the cuts in the rings [Fig. 5] are temporarily glued together with a silicone rubber glue [type 732 RTV Sealant, The Dow Corning Corporation, Midland, MI, USA]. The glue joint is cut with a razor blade to facilitate removal of each ring from around the TM glandular region.) an enclosure for the TM subcutaneous fat material is formed by gluing the acrylic ring at the end of a barrel-shaped “container,” with filling syringe attachment, to the base plate on which the TM glandular region is positioned. (See Fig. 7.)
Fig. 7.

Completion of cylindrical enclosure for the TM subcutaneous fat layer of the MRE phantom. The downward-directed arrows indicate the lowering of the barrel-shaped container onto the base plate.
After a 12-cm (inner diameter) constraining acrylic cylinder is slid around the polyvinylidine chloride (Fig. 7), molten fat-mimicking material is poured through the syringe barrel shown in Fig. 7, until the entire volume between the polyvinylidine chloride and TM glandular region has been filled. After 24 h, the syringe barrel is removed and a 3-mm thick acrylic disc (“plug”) is glued into the hole so that the external surface of the 3-mm thick plate is planar, including the plug surface. The acrylic glue used was a viscous solution of acrylic shavings (from machining) dissolved in ethylene dichloride. (Details of the plugging procedure are as follows: 1. The syringe barrel is removed from the 3-mm thick plate and a razor blade used to cut the TM material (formerly in the syringe barrel) coplanar with the external surface of the 3-mm thick plate. 2. A drop of distilled water is used to replace the air in the ring originally occupied by the end of the syringe barrel; 3. The curved edges of the 3-mm thick acrylic plug and the edges of the hole are coated with acrylic glue and the plug inserted into the hole. A 0.5mm-deep notch in the edge of the disc allows excess water and acrylic glue to exit under pressure. 4. The notch is filled with additional acrylic glue extruded from a syringe fitted with a needle.)
The resulting phantom is the MRE form of the anthropomorphic breast phantom. The enclosing acrylic and polyvinylidine chloride walls act as vapor barriers preventing significant desiccation of the phantom during the times it must be removed from a safflower oil storage bath for acquisition of data in the MR unit.
The difference between the ultrasound form and the MRE form of the phantom is that there is no need for a vapor barrier for the former because all ultrasound data are obtained while the phantom remains submerged in safflower oil in its storage tank. In the final step in producing the TM subcutaneous fat layer for ultrasound form, the polyvinylidine chloride layer and acrylic discs were coated with a thin film of petrolatum so that they could be removed after the TM subcutaneous fat layer had congealed.
MATERIAL PROPERTIES
Determinations were made at 22°C of the mechanical, ultrasonic and NMR properties of all components for both phantoms. Regarding mechanical properties, the complex Young’s moduli were determined using an EnduraTEC model 3200 ELF system (Bose Corporation, EnduraTEC Systems Group, Minnetonka, MN, USA) at a frequency of 1 Hz for each of the five types of TM material (viz., fibroadenoma, cancer, glandular, fat sphere and subcutaneous fat) using a pair of 1-cm thick, 2.6-cm diameter samples for each type of TM material; values that were determined about one month after production of the two phantoms are shown in Table 1. The real part of the complex Young’s modulus is the storage modulus, and the imaginary part is the loss modulus.
Table 1.
Storage moduli, loss moduli and elastic contrasts at 1 Hz of the various components in the phantoms
| MR elastography phantom
|
Ultrasound elastography phantom
|
|||||
|---|---|---|---|---|---|---|
| Tissue-mimicking material | Storage modulus (kPa) | Loss modulus (kPa) | Elastic contrast | Storage modulus (kPa) | Loss modulus (kPa) | Elastic contrast |
| Fibroadenoma | 99.7 ± 3.1 | 4.1 ± 0.1 | 2.35 ± 0.14 | 97.8 ± 2.9 | 6.5 ± 1.4 | 2.45 ± 0.11 |
| Cancer | 72.6 ± 3.7 | 4.0 ± 0.3 | 1.71 ± 0.12 | 64.6 ± 1.9 | 3.8 ± 0.6 | 1.62 ± 0.07 |
| Glandular | 42.5 ± 2.1* | 2.7 ± 0.2* | 1.00 | 39.9 ± 1.3* | 2.3 ± 0.1* | 1.00 |
| Fat sphere | 19.6 ± 2.5 | 1.5 ± 0.3 | 0.46 ± 0.06 | 20.6 ± 0.5 | 1.4 ± 0.1 | 0.52 ± 0.02 |
| SF | 20.1 ± 0.6 | 1.4 ± 0.1 | 0.47 ± 0.03 | 21.5 ± 0.6 | 1.5 ± 0.1 | 0.54 ± 0.02 |
The elastic contrast of a material equals its storage modulus divided by the storage modulus of the TM glandular material. SF = subcutaneous fat;
= “uncertainties” are standard deviations for values for all four layers of the TM glandular region.
Detection of any of the seven simulated masses in the MRE breast phantom was not successful until five months after production of the phantom, and then only the 14-mm diameter TM bound fibroadenoma was detected. Partly as a result of the subdued involvement of MRE, determinations of complex Young’s moduli were carried out almost entirely at 1 Hz, a frequency that is pertinent to the ultrasound quasi-static local strain imaging, which depicted all seven simulated masses. Figures 8 and 9 show elastic contrasts and storage moduli, respectively, determined at 1 Hz over a 16-month period following production of the MRE phantom. Table 2 shows storage moduli and elastic contrasts for the TM materials in the MRE breast phantom, determined at 50 Hz, 16 months after production of the phantom. A frequency of 50 Hz is the maximum for which results using the EnduraTEC 3200 are considered to be reliable using our experimental method.
Fig. 8.

Elastic contrasts of TM fibroadenoma, TM cancer and TM fat relative to TM glandular for the MRE breast phantom, monitored over a 15-month period. Zero months corresponds to the time of production of the phantom.
Fig. 9.

Storage moduli of the TM materials in the MRE breast phantom monitored over a 15-month period. Zero months corresponds to the time of production of the phantom.
Table 2.
Storage moduli, loss moduli, and elastic contrasts at 50 Hz of the various components in the MRE breast phantom
| TM material | 50 Hz ELF storage modulus (kPa) | 50 Hz ELF loss modulus (kPa) | 50 Hz ELF el. contrast |
|---|---|---|---|
| Fibroadenoma | 91.7 ± 1.8 | 9.6 ± 0.9 | 2.8 ± 0.2 |
| Cancer | 59.1 ± 5.6 | 7.1 ± 1.9 | 1.8 ± 0.2 |
| Glandular | 32.3 ± 1.9 | 4.6 ± 0.7 | 1 |
| Fat sphere | 16.3 ± 1.0 | 3.8 ± 0.3 | 0.50 ± 0.04 |
| SF | 15.2 ± 0.5 | 5.8 ± 0.6 | 0.47 ± 0.03 |
Measurements were made 16 months after production of the phantom. SF = subcutaneous fat; el. contrast = elastic contrast.
Ultrasonic attenuation coefficients were determined at five diagnostic frequencies and propagation speeds at 2.5 MHz. Results are shown in Table 3 as are values of mass densities since the latter are needed for determining ultrasound reflection coefficients. Ultrasonic properties were determined only for materials in the ultrasound breast phantom.
Table 3.
Ultrasound properties at 22°C for the components of the ultrasound elastography phantom
| Attenuation coefficient
|
|||||
|---|---|---|---|---|---|
| Tissue-mimicking material | Propagation speed (m/s) | Density (g/ml) | α0 (dB cm−1MHz−n) | n | Atten. coeff. ÷ freq. at 7.4 MHz (dB/cm/MHz) |
| Fibroadenoma | 1557 ± 1 | 1.01 ± 0.005 | 0.09 ± 0.03 | 1.57 ± 0.17 | 0.28 ± 0.02 |
| Cancer | 1533 ± 1 | 0.99 ± 0.005 | 0.13 ± 0.03 | 1.55 ± 0.12 | 0.39 ± 0.02 |
| Glandular | 1511.5 ± 1.3* | 0.97 ± 0.005 | 0.22 ± 0.02† | 1.31 ± 0.05† | 0.41 ± 0.02† |
| Fat sphere | 1491 ± 1 | 0.95 ± 0.005 | 0.36 ± 0.06 | 1.18 ± 0.08 | 0.52 ± 0.02 |
| Subcutaneous fat | 1492 ± 1 | 0.95 ± 0.005 | 0.35 ± 0.06 | 1.16 ± 0.08 | 0.48 ± 0.02 |
The attenuation coefficients, α, have been fitted to the relation α = α0 f n where α0 and n are fitting constants; the uncertainties in α0 and n account for an instrumental uncertainty in measurements of each attenuation coefficient of 0.15 dB/cm (Bevington 1969). The attenuation coefficient ÷ frequency at 7.4 MHz is also shown for reference because the ultrasound elastograms in Figs. 10–18 were generated using ultrasound near that frequency.
= “uncertainty” is the standard deviation for values for all four layers of the glandular region;
= result using attenuation coefficient values for all four layers of the glandular region; atten. coeff. = attenuation coefficiencies; freq. = frequency.
NMR relaxation times T1 and T2 were measured at 60 MHz using a Bruker mq 60 minispec NMR analyzer® (Bruker Optics, Inc., Minispec Division, The Woodlands, TX, USA) and are shown in Table 4 for the materials in both phantoms.
Table 4.
NMR relaxation times at 22°C for the components of both phantoms
| Ultrasound breast phantom
|
MR breast phantom
|
|||
|---|---|---|---|---|
| Tissue-mimicking material | T1 (ms) | T2 (ms) | T1 (ms) | T2 (ms) |
| Fibroadenoma | 530 ± 30 | 180 ± 3 | 550 ± 30 | 181 ± 2 |
| Cancer | 350 ± 20 | 132 ± 2 | 360 ± 20 | 132 ± 1 |
| Glandular | 280 ± 10 | 110 ± 1 | 280 ± 10 | 110 ± 1 |
| Fat sphere | 241 ± 7 | 95 ± 1 | 239 ± 7 | 95 ± 1 |
| Subcutaneous fat | 239 ± 7 | 96 ± 1 | 240 ± 7 | 95 ± 1 |
Complete descriptions of the measurement procedures are given in Madsen et al. (2006b). Mass density for each type of material was computed using knowledge of the density of the pure gelatin with no oil droplets (1.02g/mL) and the density of safflower oil (0.92g/mL); e.g, the mass density of the TM fat (70% oil) is 0.7×0.92g/mL + 0.3×1.02g/mL = 0.95g/mL.
IMAGES OF PHANTOM INCLUSIONS
Ultrasound
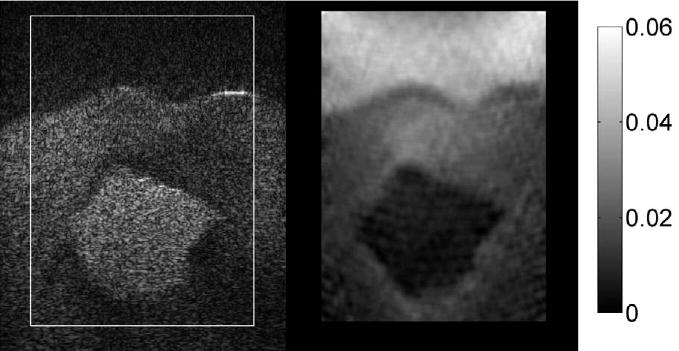
Two systems were used for generating elastograms with ultrasound. One system consisted of a Siemens SONOLINE Antares (Siemens Medical Solutions, Inc., Mountain View, CA, USA) with a VF10–5 8 MHz linear array with data acquired by using the Axius Direct Ultrasound Research Interface (URI) (Siemens Medical Solutions, Inc., Mountain View, CA, USA). The other system was an Aloka SD 2000 (Aloka Inc., Tokyo, Japan) with a 7.5 MHz linear array. In both cases, the phantom was scanned in a bath of safflower oil and satisfied slip boundary conditions, i.e., the phantom was free to move in both the lateral and elevational directions. The Siemens system shows corresponding B-mode images and elastograms side-by-side. The images shown in Figs. 10 to 15 were acquired with the Siemens Antares transducer mounted in a fixture that provides vertical displacement of the transducer (for phantom deformation) via a micrometer screw. A 12.5 cm × 6.5 cm rectangular acrylic plate contained a slot into which the transducer was fitted so that a nearly planar surface was formed by the plate and the transducer’s radiating surface. The nearly planar surface was used to compress the phantom axially. Displacements in the phantom were estimated using a modified 2-D block matching algorithm (Zhu and Hall 2002), and axial strain was estimated from 2-D displacements using a sliding 2.1 mm linear regression window. Strain images in Figs. 10 to 15 were all mapped with the same gray scale (0% strain = black, 6% strain = white).
Fig. 10.

B-mode image (left) and elastogram (right) with the Siemens Antares of the 10-mm diameter TM bound fibroadenoma. The elastogram corresponds to the part of the B-mode image enclosed in the white rectangle. The softer TM subcutaneous fat is depicted as the light region at the top of the elastogram. Increased strain (lighter) areas appear in the TM glandular region extending about 1 cm above and below the harder TM fibroadenoma (arrows).
Fig. 15.
B-mode image (left) and elastogram (right) with the Siemens Antares of the 14-mm diameter TM fat sphere. A ghost echo appears near the center of the TM fat sphere in the B-mode image (solid white arrow), and corresponding artifacts appear in the elastogram (solid white arrow). Also, more severe artifacts appear in the elastogram (open arrow) corresponding to the specular reflection at the proximal sphere surface in the B-mode image. Those artifacts are the result of local echo signal decorrelation. The ghost echo in the B-mode image is a reverberation artifact; it is not present when the scan slice is tilted at different angles.
The images shown in Figs. 16–18 were generated with the Aloka scanner operating with a 7.5 MHz linear array transducer (40 mm width) with a 60% bandwidth. The ultrasound radio frequency (RF) signals were digitized using a 12-bit data acquisition board (CompuScope 12400, Gage Applied Technologies Inc., Montreal, Quebec, Canada) at a sampling rate of 50 MHz. RF data are acquired before and after a stepper motor-controlled compression of 1% of the phantom height. A 17 cm × 17 cm stainless steel compression plate with the transducer fitted into a slot was used to approximate uniform stress conditions in the phantom. A personal computer controls the operation of the entire data acquisition system. RF echo-signal frames were compared line-by-line using a 1-D cross-correlation algorithm. Local tissue displacements were estimated from shifts in the cross-correlation peak due to the echo-shifts between pre- and postcompression echo signals. The axial gradient of the tissue displacements were computed to estimate the local strain using a least squares strain estimator (Kallel and Ophir 1997).
Fig. 16.

Set of three elastograms of the inclusions in the ultrasound breast phantom made using the Aloka SD 2000 with the 7.5 MHz linear array: (a) 5-mm diameter cancer, (b) 14-mm TM fat sphere, (c) 10-mm TM bound fibroadenoma.
Fig. 18.

Elastogram for a central slice through the TM irregular cancer made with the Aloka SD 2000.
MR imaging
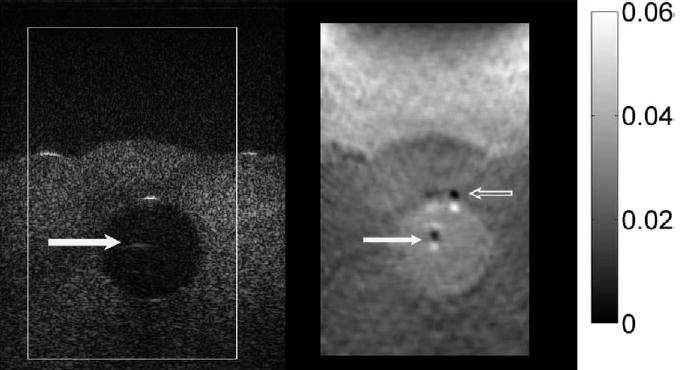
Figure 19 shows an MR image of a slice through the 14-mm diameter bound TM fibroadenoma. Figure 20 shows the corresponding MR elastogram corresponding to the gray scale depiction of the shear modulus. The method of data reduction to yield the MR elastogram is described in Weaver et al. (2001) and involves the generation of 100 Hz shear waves in the phantom and observing the propagation of those shear waves through the phantom.
Fig. 19.

MR image of a slice of the MR breast phantom through the 14-mm diameter TM bound fibroadenoma (open arrow). Evidence of the TM unbound fibroadenoma is also seen (black arrow) as is a grazing incidence of the TM irregular tumor (white arrow).
Fig. 20.

Elastogram consisting of a gray-scale mapping of the shear modulus. (Scale values are in Pa.) The stiffer 14-mm diameter TM fibroadenoma (arrow) is seen as the brighter (stiffer) object; the TM subcutaneous fat is seen as the darker edges on the top, bottom and right side.
DISCUSSION
The emphasis in producing these two phantoms was to make the materials mimic adequately the mechanical properties of the various tissue types and make the two phantoms identical regarding composition and geometry. The emphasis on equal composition and geometry was to allow a direct comparison of ultrasound and MR elastography. Reasonable mimicking of the ultrasound and NMR properties exists in the phantoms, but improvements can be made in future phantoms. It is probably too much to expect to significantly improve mimicking of ultrasound and NMR properties in the same phantom; thus, we anticipate making future phantoms with different compositions depending on whether the phantom will be used in ultrasound or MR elastography.
The materials composing the phantoms are oil-in-gelatin dispersions, the differences between the various simulated tissue types being in the volume percent oil. The gelatin component contains propylene glycol which serves as a preservative and also raises the ultrasound propagation speed into the range of the soft tissues simulated.
Material properties
Krouskop et al. (1998) reported mean and standard deviation values for storage moduli (real parts of the complex Young’s moduli) for glandular tissue, cancer and breast fat; values at 1 Hz are given in Table 5. Values of storage moduli at 1 Hz for the corresponding TM materials (Table 1) lie within one standard deviation of the mean values in Table 5.
Table 5.
Literature values for mechanical, ultrasonic and NMR properties of normal and abnormal breast tissue
| Ultrasound
|
NMR
|
||||
|---|---|---|---|---|---|
| Tissue type | Storage modulus | Propagation speed (m/s) | Atten. coeff. + freq. at 7 MHz (dB/cm/MHz) | T1 (ms) | T2 (ms) |
| Fibroadenoma | - | 1584 ± 27b | - | 1160 ± 336d | 60 ± 11d,h |
| Cancer | 93 ± 33a | 1550 ± 35b | 1.0 ± 0.2c | 900 ± 225d | 94 ± 48d |
| Glandular | 33 ± 11a | 1553 ± 35b | 2.0 ± 0.7c | 305e | 49 ± 16d |
| Fat | 19 ± 7a | 1479 ± 32b | 0.6 ± 0.1c | 209 ± 17f 266 ± 45g | 135 ± 16f 57 ± 3g |
Values shown are means ± standard deviations, except for the case of T1 for the glandular parenchyma where no standard deviation was given. Unless otherwise stated, values result from measurements in vitro at 37°C or in vivo. Typical values of the storage modulus and attenuation coefficient for fibroadenomas were not found in the literature.
= Krouskop et al. (1998) at 1 Hz and at room temperature;
= Scherzinger et al. (1989) in vivo;
= Bottomley et al. (1987), Table 16, p 25. Values at 60 MHz, but temperature is not known;
= Koenig and Brown (1984), 50 MHz;
= Just and Thelen (1988), 12 MHz;
= Nyman et al. (1986), 15 MHz;
= Small number of samples (5).
Values of ultrasound properties (Table 3) and NMR properties (Table 4) of the TM materials are in reasonably good agreement with mean literature values, but show greater deviation from mean literature values than do the storage modulus values, although the propagation speeds for three of the four types of TM materials are within one standard deviation of the means for the corresponding tissues. The propagation speed of the TM glandular material (1511 m/s) is only 7 m/s below the glandular tissue range (mean minus standard deviation).
The TM materials do not mimic the corresponding tissue types nearly as well in terms of the attenuation coefficients. The greatest discrepancy is for the glandular tissue where the attenuation coefficient slope for the TM glandular material is only (0.373/2.0)× 100 = 19% of the mean tissue value measured by D’Astous and Foster (1986). For cancer, the TM value is (0.32/1.0)× 100 = 32% of the tissue mean value. The attenuation coefficient slope for TM fat, however, lies within 1.5 standard deviations of the mean tissue value. Note that attenuation coefficients of TM materials can be increased through inclusion of solid microscopic particles, such as glass beads. However, the addition of such particles can compromise the validity of the NMR T2 value because glass beads can cause local microscopic variations in magnetic susceptibility resulting in nontissue-like dependence of T2 on 180° pulse separations (Blechinger et al.1988). In the present report, it was decided to make the ultrasound and MR breast phantoms identical except for the desiccation-preventing plastic covering on the MR phantom so that a direct comparison could be made between ultrasound and MR elastography. Therefore, compromises regarding fidelity to both ultrasound and NMR tissue properties were tolerated.
Except for TM fat, the T2 values of the TM materials are higher than the values for the corresponding tissues. Increasing the dry-weight agar concentration reduces T2 values. Thus, one way to produce more realistic T2 values in anthropomorphic breast phantoms is to employ oil-in-agar/gelatin dispersions (Madsen et al. 2005b), where the aqueous gel matrix is a mixture of gelatin and agar. (Agar lowers T2.)
Regarding NMR T1s, the TM material values for glandular and fat agree rather well with the tissue values, and the increase in T1 from fat to glandular, to cancer, to fibroadenoma is followed. However, the values are too low for fibroadenoma and cancer. Use of oil-in-agar/gelatin dispersions could solve the problem of the limited T1 range while also solving the T2-lowering need. For the same volume percent oil, the oil-in-agar/gelatin materials exhibit a lower Young’s modulus than the oil-in-gelatin materials. Therefore, the Young’s modulus of the TM fibroadenoma could be well represented with the pure (0% oil) agar/gelatin material, which can have T1 values as high as 1100 ms (Blechinger et al. 1988); the T2-lowering due to the agar would also be present. A considerable amount of materials testing will need to be done to arrive at an optimal composition of the oil-in-agar/gelatin materials. An appropriate concentration of NaCl could also be included in the agar/gelatin component of the phantoms to produce realistic MR coil loading (Rice et al.1998).
Long-term stability
Long-term stability of heterogeneous phantoms formed from oil dispersions in aqueous gels has been reported for periods as long as five months (Madsen et al. 2006b). In that report, strong evidence is given that elastic contrasts are stable over many months. Regarding stability of elastic contrasts for the TM materials in the present report, elastic contrasts for TM fibroadenoma, TM cancer and TM fat, relative to TM glandular, are shown in Fig. 8, monitored over a 15-month period. Elastic contrasts of TM cancer and TM fat are stable, while that for the TM fibroadenoma increases by about 25% over the 15-month period, corresponding to a 1.7% increase per month.
In earlier work (Madsen et al. 2003), it was learned that storage moduli of oil-in-gelatin materials rise to a maximum one or two months following production and then decrease slowly by 10 or 15% over the next six months. A similar decrease in storage moduli of about 1.5% per month over a 15-month period for the TM materials in the MRE breast phantom is shown in Fig. 9.
Phantom geometry
All but one of the lesions in each phantom is a simple sphere. Future phantoms should probably include a greater variety of clinically relevant shapes and sizes. Different shapes could include an encapsulated cyst, cancers with more extended spicules or oblate spheroid TM fibroadenomas. Also, if in vitro 3-D mappings of the storage modulus in the vicinity of breast abnormalities become available, representative distributions could be included in breast phantoms.
Future anthropomorphic breast phantoms should also exhibit better representations of the external shape of the breast in terms of the particular elastography system employed. For example, most ultrasound elastography of the breast is performed with the breast compressed against the chest wall in the usual fashion used in B-scanning, which produces a breast that is flattened in the anterior/posterior dimension; that particular shape could be simulated by a breast phantom. In one type of breast MR elastography, the breast is suspended between— and is somewhat compressed by— two flat vertical plates, which illustrates another external form for a breast phantom (Sinkus et al. 2005).
Elastograms
Although the elastograms generated by the Siemens Antares system are more impressive in terms of depictions of lesions in the ultrasound breast phantom, the presence of artifacts at the edges of specular reflections (Figs. 12 and 15) is a weakness. Note that the strain imaging program (Zhu and Hall 2002) used to generate elastograms from data acquired by the Siemens Antares system employs a small 2-D kernel that has a length on the order of one wavelength (0.2 mm). Local specular reflection can result in echo signal saturation, which is no longer a unique pattern to track. As a consequence, echo tracking with “template matching” fails. If the error correction method (Zhu and Hall, 2002) used in the strain imaging program also fails to correct these motion-tracking failures, strain artifacts will appear in the elastograms. It is interesting to note that the error correction method has fixed some of the motion-tracking errors, and so not all specular reflections result in artifacts in elastograms (e.g., Figs. 10 and 14). Obviously, the simple solution is to not allow the echo signal to saturate. No similar artifacts have been seen in the Aloka elastograms because a relatively long one-dimensional kernel (1.5 mm) compared to the size of reflection in the echo field was used to estimate displacements. The overall quality of the elastograms with the Siemens Antares appears to be noticeably better than that of the Aloka elastograms.
Fig. 12.

B-mode image (left) and elastogram (right) with the Siemens Antares of the 14-mm diameter TM unbound fibroadenoma. Slipping at the boundary of the lesion gives rise to the approximately 2-mm wide, bright ring around it in the elastogram (filled black arrows). In the upper right part of the elastogram (open black arrow) at the boundary between the TM subcutaneous fat and the TM glandular region, there is an artifact related to the specular reflection seen on the B-mode image (open white arrow).
Fig. 14.
B-mode image (left) and elastogram (right) with the Siemens Antares of the TM cancer with irregular boundary. The outline of the TM cancer in the elastogram agrees rather well with that on the B-mode image.
The Siemens Antares Axius Direct Ultrasound Research Interface provides digital signals sampled at 40 MHz encoded in 16 bits whereas the Aloka system uses external digitization of the RF signals with a GAGE digitization board (Gage Applied Inc., Montreal, Quebec, Canada) sampling at 50 MHz and 12 bits. RF data for the Aloka system in our lab was collected using a center frequency of 7.5 MHz; the closest frequency to that available for the Siemens in our lab is 7.2 MHz. Note that no attempt was made to match the center frequency or bandwidth of these systems before data acquisition; the manufacturer’s values for transducer operating range and pulse frequency were used as stated. Analysis of the power spectra (Madsen et al. 2005) obtained from the two systems illustrate that the actual center frequency of the Aloka system (6.5MHz) is higher than that for the Antares (5.2MHz), and the −6 dB bandwidths, which were obtained using a Gaussian fit, are also slightly higher for the Aloka (4.5MHz) when compared to the Antares (3.2MHz). The Antares system, on the other hand, has a significantly higher signal-to-noise ratio (SNR) at 38 dB when compared the Aloka at 16 dB. The lower SNR of the Aloka may be due to the external digitization of the RF signals. Another factor that may influence strain imaging performance is the data processing method used. A 2-D block matching algorithm (Zhu and Hall 2002) was used in the case of the Antares, whereas a 1-D cross-correlation method was used for data collected on the Aloka system.
The algorithm used to generate the Siemens Antares elastograms is the same alogrithm expected to be implemented on the Siemens Antares for real-time strain imaging. The high SNR ratio in the elastograms obtained with the Siemens Antares and shown in Figs. 10 to 15 exposes a nearly horizontal banding that is due to bias of the quadratic interpolation used to estimate subsample displacements from integer (RF) sample spacing results of the block matching algorithm (Zhu and Hall 2002). A more sophisticated interpolation algorithm would result in significantly lower bias, and therefore smoother images.
The MR elastogram (Fig. 20) seems to be far inferior in quality to all ultrasound elastograms of the breast phantom. However, it should be noted that the ultrasound elastograms are depictions of local strain values, whereas the MR elastogram depicts the shear modulus distribution. An ultrasound elastogram equivalent to the MR elastogram would be a gray-scale depiction of the storage modulus presumably derived from a local strain image. Obtaining such a depiction is well recognized as extremely challenging, and no attempt has been made to do such a depiction in the case of ultrasound elastograms of the breast phantom.
SUMMARY
The materials and methodology for producing anthropomorphic breast phantoms for use in ultrasound or MR elastography have been thoroughly described. The storage moduli of the materials are representative of breast tissues in terms of published in vitro measurements. The storage moduli range from about 20 kPa for the 70% oil material (TM fat) through about 100 kPa for the 10% oil material (TM fibroadenoma). (Note that 80% oil versions, which have a storage modulus of about 10 kPa, have been produced in our lab.)
These breast phantoms can serve as valuable intermediaries between simple phantoms (containing, for example, cylindrical inclusions) and actual patients for assessment of elastography systems. We feel that such anthropomorphic phantoms can be used by researchers to test refinements in their hardware and/or software preliminary to pursuing expensive and time-consuming clinical trials, perhaps reducing the number of such trials.
We also provide a comparison of the axial-strain elastograms obtained using two different ultrasound elastography systems for the same phantom. The systems involved different hardware manufacturers and different data processing techniques. A limited comparison between ultrasound and MR elastograms was also made.
Stability of elastic properties of the phantoms is reasonably good. Elastic contrasts (Fig. 8) for TM cancer and TM fat relative to TM glandular can be considered invariant for 15 months; that of the TM fibroadenoma increases about 1.7% per month, a tolerable change for comparing elastograms if they were made within a time frame of 2 or 3 months. The storage moduli (Fig. 9) of the TM materials decrease by about 1.5% per month.
Fig. 11.
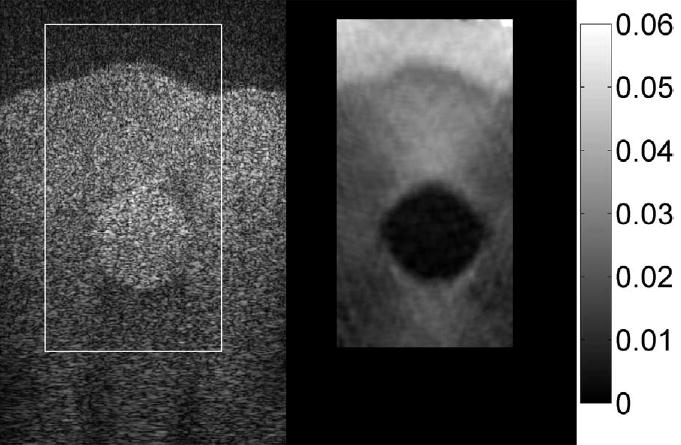
B-mode image (left) and elastogram (right) with the Siemens Antares of the 14-mm diameter TM bound fibroadenoma. Increased strain areas appear in the TM glandular region just above and below the harder TM fibroadenoma. Note the shadowing distal to the lateral surfaces of the TM fibroadenoma on the B-mode.
Fig. 13.

B-mode image (left) and elastogram (right) with the Siemens Antares of the 5-mm diameter TM cancer. Note that the local strain is decreased in a layer (arrow) of the TM glandular region near the TM subcutaneous fat.
Fig. 17.

Aloka SD 2000 elastograms of (a) the bound 14-mm diameter TM fibroadenoma and (b) the unbound 14-mm diameter TM fibroadenoma. Again, slipping at the boundary of the TM unbound fibroadenoma has created a whiter ring, approximately 2-mm in thickness, around the TM lesion.
Acknowledgments
This work was supported in part by NIH grants R01EB000459, R21EB003853 and R01CA100373.
References
- Bevington PR. Data Reduction and Error Analysis for the Physical Sciences. New York: McGraw-Hill; 1969. pp. 106–116. 180–183. [Google Scholar]
- Baldeswing RA, de Korte CL, Schaar JA, et al. Finite element model for performing intravascular ultrasound elastography of vulnerable plaques. Ultrasonics. 2004a;42:723–729. doi: 10.1016/j.ultras.2003.11.017. [DOI] [PubMed] [Google Scholar]
- Baldeswing RA, de Korte CL, Schaar JA, et al. A finite element model for performing intravascular ultrasound elastography of human atherosclerotic coronary arteries. Ultrasound Med Biol. 2004b;30:803–13. doi: 10.1016/j.ultrasmedbio.2004.04.005. [DOI] [PubMed] [Google Scholar]
- Blechinger JC, Madsen EL, Frank GR. Tissue-mimicking gelatin-agar gels for use in magnetic resonance imaging phantoms. Med Phys. 1988;15:629–636. doi: 10.1118/1.596219. [DOI] [PubMed] [Google Scholar]
- Bottomley PA, Hardy CJ, Argersinger RE, Allen-Moore G. A review of 1H nuclear magnetic resonance relaxation in pathology: Are T1 and T2 diagnostic? Med Phys. 1987;14:1–37. doi: 10.1118/1.596111. [DOI] [PubMed] [Google Scholar]
- Cespedes I, Ophir J, Ponnekanti H, Maklad N. Elastography: Elasticity imaging using ultrasound with application to muscle and breast in vivo. Ultrasonic Imaging. 1993;15:73–88. doi: 10.1177/016173469301500201. [DOI] [PubMed] [Google Scholar]
- Chu KC, Rutt BK. Polyvinyl alcohol cryogel: An ideal phantom material for MR studies of arterial flow and elasticity. Magn Reson Med. 1997;37:314–319. doi: 10.1002/mrm.1910370230. [DOI] [PubMed] [Google Scholar]
- D’Astous FT, Foster FS. Frequency dependence of ultrasound attenuation and backscatter in breast tissue. Ultrasound Med Biol. 1986;12:795–808. doi: 10.1016/0301-5629(86)90077-3. [DOI] [PubMed] [Google Scholar]
- Gao L, Parker KJ, Alam SK. Sonoelasticity imaging: Theory and experimental verification. J Acoust Soc Am. 1995;97:3875–3886. doi: 10.1121/1.412399. [DOI] [PubMed] [Google Scholar]
- Hall TJ, Zhu Y, Spalding CS. In vivo real-time freehand palpation imaging. Ultrasound Med Biol. 2003;29:427–435. doi: 10.1016/s0301-5629(02)00733-0. [DOI] [PubMed] [Google Scholar]
- Just M, Thelen M. Tissue characterization with T1, T2 and proton density values: Results in 160 patients with brain tumors. Radiology. 1988;169:779–785. doi: 10.1148/radiology.169.3.3187000. [DOI] [PubMed] [Google Scholar]
- Kallel F, Ophir J. A least-squares strain estimator for elastography. Ultrason Imaging. 1997;19:195–208. doi: 10.1177/016173469701900303. [DOI] [PubMed] [Google Scholar]
- Koenig SH, Brown RD. Determinants of proton relaxation rates in tissue. Magn Reson Med. 1984;1:437–449. doi: 10.1002/mrm.1910010404. [DOI] [PubMed] [Google Scholar]
- Krouskop TA, Wheeler TM, Kallel F, Garra BS, Hall T. Elastic moduli of breast and prostate tissues under compression. Ultrason Imaging. 1998;20:260–274. doi: 10.1177/016173469802000403. [DOI] [PubMed] [Google Scholar]
- Madsen EL, Zagzebski JA, Ghilardi-Netto T. An anthropomorphic torso section phantom for ultrasonic imaging. Med Phys. 1980;7:43–50. doi: 10.1118/1.594657. [DOI] [PubMed] [Google Scholar]
- Madsen EL, Zagzebski JA, Frank GR, Greenleaf JF, Carson PL. Anthropomorphic breast phantoms for assessing ultrasonic imaging system performance and for training ultrasonographers: Part I. J Clin Ultrasound. 1982;10:67–75. doi: 10.1002/jcu.1870100207. [DOI] [PubMed] [Google Scholar]
- Madsen EL, Kelly-Fry E, Frank GR. Anthropomorphic phantoms for assessing systems used in ultrasound imaging of the compressed breast. Ultrasound Med Biol. 1988;14 (Suppl 1):183–201. doi: 10.1016/0301-5629(88)90061-0. [DOI] [PubMed] [Google Scholar]
- Madsen EL, Frank GR, Krouskop TA, Varghese T, Kallel F, Ophir J. Tissue-mimicking oil-in-gelatin dispersions for use in heterogeneous elastography phantoms. Ultrasonic Imaging. 2003;25:17–38. doi: 10.1177/016173460302500102. [DOI] [PubMed] [Google Scholar]
- Madsen EL, Frank GR, Hobson MA, Shi H, Jiang J, Varghese T, Hall TJ. Spherical lesion phantoms for testing the performance of elastography systems. Phys Med Biol. 2005;50:5983–5995. doi: 10.1088/0031-9155/50/24/015. [DOI] [PMC free article] [PubMed] [Google Scholar]
- Madsen EL, Berg WA, Mendelson EB, Frank GR. Anthropomorphic breast phantoms for qualification of investigators to participate in the ACRIN Protocol 6666 “screening breast ultrasound in high risk women”. Radiology. 2006a;239:869–874. doi: 10.1148/radiol.2393051070. [DOI] [PubMed] [Google Scholar]
- Madsen EL, Hobson MA, Shi H, Varghese T, Frank GR. Stability of heterogeneous elastography phantoms made from oil dispersions in aqueous gels. Ultrasound Med Biol. 2006b;32:261–270. doi: 10.1016/j.ultrasmedbio.2005.10.009. [DOI] [PMC free article] [PubMed] [Google Scholar]
- McKnight AL, Kugel JL, Rossman PJ, Manduca A, Hartmann LC, Ehman RL. MR Elastography of breast cancer: Preliminary results. AJR Am J Roentgenol. 2002;178:1411–7. doi: 10.2214/ajr.178.6.1781411. [DOI] [PubMed] [Google Scholar]
- Muthupillai R, Lomas DJ, Rossman PJ, Greenleaf JF, Manduca A, Ehman RL. Magnetic resonance elastography by direct visualization of propagating acoustic strain waves. Science. 1995;269:1854–1857. doi: 10.1126/science.7569924. [DOI] [PubMed] [Google Scholar]
- Muthupillai R, Rossman PJ, Lomas DL, Greenleaf JF, Riederer SJ, Ehman RL. Magnetic resonance imaging of transverse acoustic strain waves. Magn Reson Med. 1996;36:266–274. doi: 10.1002/mrm.1910360214. [DOI] [PubMed] [Google Scholar]
- Nightingale K, Soo MS, Nightingale R, Trahey G. Acoustic radiation force impulse imaging: In vivo demonstration of clinical feasibility. Ultrasound Med Biol. 2002;28:227–235. doi: 10.1016/s0301-5629(01)00499-9. [DOI] [PubMed] [Google Scholar]
- Nyman R, Ericsson A, Hemmingsson A, Jung B, Sperber G, Thuomas KA. T1, T2 and relative proton density at 0.35 T for spleen, liver, adipose tissue and vertebral body: normal values. Magn Reson Med. 1986;3:901–910. doi: 10.1002/mrm.1910030610. [DOI] [PubMed] [Google Scholar]
- O’Donnell M, Skovoroda AR, Shapo BM, Emelianov SY. Internal displacements and strain imaging using ultrasonic speckle tracking. IEEE Transactions on Ultrasonics, Ferroelectrics and Frequency Control. 1994;41:314–325. [Google Scholar]
- Ophir J, Cespedes I, Ponnekanti H, Yazdi Y, Li X. Elastography: A quantitative method for imaging the elasticity of biological tissues. Ultrasonic Imaging. 1991;13:111–134. doi: 10.1177/016173469101300201. [DOI] [PubMed] [Google Scholar]
- Perrey C, Braeker G, Bojara W, Lindstaedt M, Holt S, Ermert H. Strain imaging with intravascular ultrasound array scanners: Validation with phantom experiments. Biomed Technik. 2003;48:135–140. doi: 10.1515/bmte.2003.48.5.135. [DOI] [PubMed] [Google Scholar]
- Plewes DB, Betty I, Urchuk SN, Soutar I. Visualizing tissue compliance with MR imaging. J Magn Reson Imaging. 1995;5:733–738. doi: 10.1002/jmri.1880050620. [DOI] [PubMed] [Google Scholar]
- Rice JR, Milbrandt RH, Madsen EL, Frank GR, Boote EJ. Anthropomorphic 1H MRS head phantom. Med Phys. 1998;25:1145–1156. doi: 10.1118/1.598306. [DOI] [PubMed] [Google Scholar]
- Samani A, Bishop J, Yaffe MJ, Plewes DB. Biomechanical 3-D finite element modeling of the human breast using MRI data. IEEE Transactions on Ultrasonics, Ferroelectrics and Frequency Control. 2001;20:271–279. doi: 10.1109/42.921476. [DOI] [PubMed] [Google Scholar]
- Scherzinger AL, Belgam RA, Carson PL, Meyer CR, Sutherland JV, Bookstein FL, Silver TM. Assessment of ultrasonic computed tomography in symptomatic breast patients by discriminant analysis. Ultrasound Med Biol. 1989;15:21–28. doi: 10.1016/0301-5629(89)90128-2. [DOI] [PubMed] [Google Scholar]
- Sinkus R, Lorenzen J, Schrader D, Dargatz M, Holz D. High-resolution tensor elastography for breast tumor detection. Phys Med Biol. 2000;45:1649–1664. doi: 10.1088/0031-9155/45/6/317. [DOI] [PubMed] [Google Scholar]
- Sinkus R, Tanter M, Catheline S, Lorenzen J, Kuhl C, Sondermann E, Fink M. Imaging anisotropic and viscous properties of breast tissue by magnetic resonance-elastography. Magn Reson Med. 2005;53:372–387. doi: 10.1002/mrm.20355. [DOI] [PubMed] [Google Scholar]
- Weaver JB, Van Houten EEW, Miga MI, Kennedy FE, Paulsen KD. Magnetic resonance elasography using 3D gradient echo measurements of steady state motion. Med Phys. 2001;28:1620–1628. doi: 10.1118/1.1386776. [DOI] [PubMed] [Google Scholar]
- Zhu Y, Hall TJ. A modified block matching method for real-time freehand strain imaging. Ultrason Imaging. 2002;24:161–76. doi: 10.1177/016173460202400303. [DOI] [PubMed] [Google Scholar]