

Abstract
White matter hyperintensities (WMH), commonly found on T2-weighted FLAIR brain MR images in the elderly, are associated with a number of neuropsychiatric disorders, including vascular dementia, Alzheimer’s disease, and late-life depression. Previous MRI studies of WMHs have primarily relied on the subjective and global (i.e., full-brain) ratings of WMH grade. In the current study we implement and validate an automated method for quantifying and localizing WMHs. We adapt a fuzzy connected algorithm to automate the segmentation of WMHs and use a demons-based image registration to automate the anatomic localization of the WMHs using the Johns Hopkins University White Matter Atlas. The method is validated using the brain MR images acquired from eleven elderly subjects with late-onset late-life depression (LLD) and eight elderly controls. This dataset was chosen because LLD subjects are known to have significant WMH burden. The volumes of WMH identified in our automated method are compared with the accepted gold standard (manual ratings). A significant correlation of the automated method and the manual ratings is found (P<0.0001), thus demonstrating similar WMH quantifications of both methods. As has been shown in other studies e.g. (Taylor, et al. 2003)), we found there was a significantly greater WMH burden in the LLD subjects versus the controls for both the manual and automated method. The effect size was greater for the automated method, suggesting that it is a more specific measure. Additionally, we describe the anatomic localization of the WMHs in LLD subjects as well as in the control subjects, and detect the regions of interest (ROIs) specific for the WMH burden of LLD patients. Given the emergence of large neuroimage databases, techniques, such as that described here, will allow for a better understanding of the relationship between WMHs and neuropsychiatric disorders.
Keywords: White matter hyperintensity, late-onset late-life depression
INTRODUCTION
A number of previous studies have shown that white matter hyperintensities (WMH), also called leuokoaraiosis, commonly seen on T2-weighted FLAIR MR images, are associated with neuropsychiatric disorders, including vascular dementia (van Gijn 1998), Alzheimer’s disease (Mirsen, et al. 1991), and late-onset late-life depression (Hickie and Scott 1998; Thomas, et al. 2004). Two analysis strategies have been used to evaluate WMHs on MR brain images: (1) semi-quantitative rating systems and (2) quantitative volumetric analyses. In semi-quantitative system, the WMHs are visually graded by trained expert raters. The rater assigns each MR image a WMH severity score based on its visual similarity to ‘prototype’ MR images. Typical scales range from low to high severity using 4-point or 10-point scales (Fazekas, et al. 1987; Bryan, et al. 1994; Yue, et al. 1997). This method requires subjective judgment; it describes the WMHs through 4 or 10 crude grades. It does not allow accurate information about the location or volume of the WMHs, and thus may ignore some subtle WMH differences across groups. Also different visual rating scales make it difficult to compare or reproduce the findings on WMHs across centers (Davis, et al. 1992).
For the quantitative analyses on WMHs, several methods have been explored to automatically or semi-automatically segment the WMHs. For example, K-Nearest Neighbor (KNN) classification method was used to automatically or semi-automatically label the T2-weighted MR brain images as gray matter, CSF and white matter lesions (Kikinis, et al. 1992; Swartz, et al. 2002; Anbeek, et al. 2004b; Anbeek, et al. 2004a). In this method, the classification of an image voxel from a new patient relies on the voxel intensities and spatial information of a previously manually classified training set. Since the MR image of different subjects at the same center or across centers may have different intensity distribution ranges, and the normal anatomic variations across subjects lead to variability in the spatial features, this method may encounter difficulties for some subjects. Other machine learning algorithms including artificial neural networks (Pachai, et al. 1998) have also been investigated for WMH segmentation, which may face similar dependencies on a training set. An automated method from Stamatakis is used to delineate large brain lesions on T1-weighted structural images, which involves comparing the smoothed individual T1-weighted image to a control group using general linear model (GLM). The accuracy of this method depends on the performance of the spatial normalization technique. The normal anatomical variations in brain structure between the individual subject and the control group may present a problem for the registration accuracy and GLM, so a Gaussian smoothing filter is used to smooth out the anatomical differences, which may also affect the reliability of the volumetric quantification of the lesions (Stamatakis and Tyler 2005).
On T2-weighted FLAIR MR images, the WMHs usually have a higher intensity than normal white matter (WM). Some methods automatically or semi-automatically segment the WMHs on FLAIR images by defining a cut-off threshold on the images. For example, 3.5 standard deviations (SD) of the intensity value of the normal WM has been used as the lower intensity threshold for WMH segmentation (Hirono, et al. 2000). The histogram of the FLAIR image has been used in a regression model to decide on a cut-off intensity threshold, with the pixels above the threshold classified as WMHs (Jack, et al. 2001). Another method uses the mean and standard deviations of the gray matter, white matter and CSF to estimate the intensity threshold for WMH, in which a probability map is used to favor the most likely WM regions (Wen and Sachdev 2004). These methods use only a single intensity threshold to segment the WMHs for the whole brain or for each slice of the brain images, which may misclassify some non-WMHs as WMHs, since some gray matter demonstrates signal intensity above the threshold (Hirono, et al. 2000), and also the image intensity inhomogeneities may be problematic. To exclude the misclassified voxels, a manually outlined mask of WMHs with surrounding WM, GM and CSF has been used as WMH mask in Hirono’s paper, while in Wen’s paper a WM probability map (MNI 152 brains) has been used to favor the most likely WM regions. Manually outlining the WMH mask of a 3D brain volume is time-consuming and labor-intensive, while using a WM probability map in a MNI template to favor the WM regions in the WMH segmentation of the subjects will make the segmentation accuracies dependent on an accurate inter-subject registration.
Previous research suggests that the location or distribution of WMHs is associated with specific symptoms (Benson, et al. 2002). Most previous research focused only on WMH visual inspection or volume measurement and did not distinguish anatomically distinct WMHs, while a few groups have explored semi-automated or automated methods to localize WMHs into large compartments or catergories such as periventricular white matter hyperintensities (PVWMHs) and deep white matter hyperintensities (DWMHs). For example, in (Swartz, et al. 2002), a 3D classification algorithm was applied to separate DWMHs from PVWMHs. Other investigators have used nonlinear image registration methods to convert the WMHs across subjects into a standard space (Taylor, et al. 2003; DeCarli, et al. 2005).
In the current study, we present an alternative automated method for WMH quantification and localization, which uses a fuzzy connected algorithm to segment the WMHs, and the Automated Labeling Pathway (ALP) to localize the WMHs into the anatomical space (Wu, et al. In Press). Previous research used fuzzy connected algorithm for semi-automated WMH segmentation (Miki, et al. 1997; Udupa, et al. 1997), which required some user interaction and did not give spatial information on the WMHs. Our automated method uses the histogram of the FLAIR image to automatically generate the WMH seeds, and then the fuzzy connected algorithm uses specific parameters to form a WMH cluster (containing the respective seed). The system updates the seeds iteratively and combines the scattered WMH clusters into the final WMH segmentation. Since the fuzzy connected algorithm uses different parameters for each seed, this method enables different threshold for each WMH cluster and avoids a single cut-off threshold for the whole brain or brain slice. This potentially offers more precise WMH segmentation. The method automatically identifies WMH seeds and generates WMH segmentation, which is objective and does not require any manual interaction. A fully deformable registration (ALP, Wu, In Press), which combines the piecewise linear registration for coarse alignment with Demons algorithm for voxel-level refinement, is used for accurate WMH localization on the Johns Hopkins University White Matter Atlas (Wakana, et al. 2004).
We report the results of a quantitative assessment WMH of a group of elderly control subjects compared to a group LLD subjects. This group was chosen because it is known that these subjects have a high WMH burden (O’Brien, et al. 1996). We compare the WMH volumes identified with our approach to the gold standard assessments based on manual expert ratings. Additionally, the anatomical localization of the WMHs found with our approach is described, and the WMH burden of the control group is region-wise statistically compared to that of the LLD patient group.
MATERIALS AND METHODS
Subjects
The 19 subjects (eleven patients and eight controls) were recruited through the University of Pittsburgh Intervention Research Center for Late-Life Mood Disorders. Subjects were 63 to 81 years of age (mean age 72.3, standard deviation 4.86), whose WMH visual scores ranged from 0.5 to 6.5 (mean WMH score 2, standard deviation 1.6). All subjects (controls and depressed) received a SCID-IV evaluation, which was reviewed in a diagnostic consensus conference. Eleven of the 19 subjects were diagnosed as depressed patients; while the remaining eight subjects were termed control subjects.
The 11 patients had late-onset late-life depression; they met DSM-IV criteria for Major Depressive Disorder (American Psychiatric Association, 2000) and their depression began at the age of 60 years or older. The mean Hamilton Depression Rating Scale on patients was 20.3 (standard deviation ± 4.9). The subjects did not have significant cognitive impairment; mean Mattis Dementia Rating Scale was 136.3 (standard deviation ± 5.9). They were all participants in a research trial of antidepressant medications. Other than Major Depressive Disorder (for subjects in the depressed group) and anxiety disorders, all other Axis I psychiatric disorders were used as exclusion criteria. We chose to include subjects with co-morbid anxiety disorders due to the high prevalence (48%) of anxiety disorders in subjects with late-life depression (Beekman, et al. 2000).
Each subject was assessed by the Mini Mental State Examination (MMSE), Hamilton Rating Scale for Depression (Hamilton), and Mattis Dementia Rating Scale (Mattis). Clinical characteristics of the subjects (patients and controls) are summarized in Table 1. The 2 groups were well balanced with respect to gender and age.
Table 1.
Clinical Characteristics of the subjects.
| Group I (Depressed) | Group II (Controls) | t-test probability | |
|---|---|---|---|
| No. of subjects | 11 | 8 | |
| Age, year (range) | 72.2±5.3 (63–80) | 72.3±4.8 (67–81) | 0.93560809 |
| Gender, M/F | 5/6 | 4/4 | |
| WMH scores ± SD | 2.55±1.9 | 1.25±0.5 | 0.05412192 |
| MMSE ± SD | 27.7±3.6 | 28.8±1.5 | 0.40560931 |
| Hamilton ± SD | 20.3±4.9 | 2±2.07 | 2.2477E-08 |
| MATTIS ± SD | 136.3±5.9 | 139.9±3.4 | 0.11628563 |
Statistical comparisons utilized a two-sample, unequal variance, two-tailed Student’s t-test.
The MR images used in the current analyses were obtained at the time of subject enrollment, before the antidepressant medication was started. This study was approved by the University of Pittsburgh Institutional Review Board (IRB). Written informed consent was obtained.
MR Imaging Parameters
Magnetic resonance images were acquired on a 1.5 Tesla Signa Scanner (GE Medical Systems, Milwaukee, WI). The 3D structural MR images were acquired at sagittal orientation using 3D Spoiled GRASS (SPGR, TR/TE = 5/25 ms; flip angle = 40º; FOV = 24×18cm, slice thickness = 1.5mm, matrix = 256×192 matrix).
The following axial series were also obtained: T1-weighted (TR/TE = 500/11 ms, Nex = 1); fast fluid-attenuated inversion recovery (fast FLAIR) (TR/TE 9002/56 ms Ef; TI = 2200 ms, NEX = 1). Section thickness was 5 mm with a 1-mm inter-section gap. All axial sequences were obtained with a 24 cm field of view and a 192 x 256 pixel matrix. Slice thickness and orientation were chosen so that the acquired images would be compatible with the WMH rating scales described below.
White Matter Hyperintensity Ratings
The WMH ratings were based on a system developed for the Cardiovascular Health Study (CHS; Bryan, et al. 1994; Yue, et al. 1997). A numerical rating for the WMHs was assigned by the comparison of each subject’s imaging data to predefined CHS visual standards and representative of progressive severity within a 10-point scale (0 through 9). Two raters independently evaluated WMH on the FLAIR images. If they differed in their ratings by one point, the final rating was the mean of the two values. A greater than one-point difference between raters was considered as a disagreement, and was adjudicated by consensus.
Automated WMH Segmentation and Localization
The major steps of the automated WMH segmentation procedure involved (1) image preprocessing, (2) automated WMH segmentation, and (3) automated WMH localization. Image preprocessing included skull stripping of the SPGR and FLAIR brain images, which improved the accuracies of WMH segmentation and localization. For the skull stripping on the FLAIR images, we used the Brain Extraction Tool (BET, Smith 2002) on the T1-weighted images, which were acquired at the same location and voxel-size as the FLAIR images. The resulting stripped T1-weighted image was then used as a brain mask to remove the skull and scalp from the FLAIR image.
This automated WMH segmentation method involved four steps: (1) automatically identifying WMH seeds based on the intensity histogram of the FLAIR image, (2) using a fuzzy connected algorithm to segment the WMH clusters, (3) iteratively updating the set of seeds, and (4) combining the WMH clusters into the final WMH segmentation. The histogram of the skull-stripped FLAIR image was used to define a threshold (mean + 3 × SDs) for seed selection; voxels beyond this threshold were classified as WMHs, which were used as seeds in the fuzzy connected algorithm to segment surrounding WMH voxels. The background of the FLAIR image was excluded when calculating its intensity histogram, mean intensity and standard deviation. In the fuzzy connected algorithm, the fuzzy adjacency and affinity, both between 0 and 1, are defined for each pair of voxels (a,b): the fuzzy adjacency μα(a,b) defines how close the two voxels are, while the affinity μk (a,b) (determined based on adjacency degree μα(a,b) and intensity similarity) indicates how strongly the two voxels “hang together” in space and intensity. A fuzzy connected object is a set of voxels O with properties as follows: any two voxels (a,b) from O have an affinity μk (a,b) > x , 0 ≤ x ≤1, and for any pair a ∈ O,b ∉ O, the affinity μk (a,b) < x,0 ≤ x ≤ 1, a detailed and precise mathematics definition is given in Udupa, et al. (1996) and Udupa, et al. (1997). For each selected WMH seed the fuzzy connected algorithm generates a fuzzy object, within which each pair of voxels has a strong fuzzy connectedness or affinity (above certain threshold, 0.5 in this study), and the system automatically delineates a 3D WMH cluster containing the respective seed. Multiple 3D FLAIR image WMH clusters are generated from the set of automatically selected seeds and then combined to form an overall WMH segmentation volume.
The flow chart of the WMH segmentation is shown in Fig. 1. The fully automated WMH segmentation system was implemented in C++ and ITK. The WMH segmenation algorithm is available to the readers upon request through our website (http://www.pitt.edu/~aizen/GPN_Home.html).
Fig. 1.

WMH Segmentation Flowchart. The processing steps used to automatically segment the WMHs on FLAIR MR brain images.
Automated Labeling Pathway (ALP, see Fig. 2) is an automated method we developed in a series of functional and structural MRI studies to automatically label specific anatomic regions of interest (Rosano, et al.; Aizenstein, et al. In Press; Wu, et al. In Press). The pathway combines a series of publicly available software packages such as AFNI (Cox, 1996), BET (Smith, 2002), FLIRT (Jenkinson, 2002) and ITK(Yoo, 2004), as well as some locally developed programs to implement atlas-based segmentation of MR images. ALP is used to automatically label ROIs on the SPGR image of a subject.
Fig. 2.

ALP Flowchart. The processing steps that constitute our Automated Labeling Pathway (ALP), which is used to generate regional brain volume estimates. The process uses a variety of publicly available packages, as well as some locally developed programs, for atlas-based segmentation of MR images.
In ALP described in Wu, et al. (In Press), the inter-subject registration (template colin27→subject 3D SPGR) is done using a fully deformable registration model similar to that described by Chen (1999). We have implemented this using the registration library in Insight Segmentation and Registration Toolkit (ITK, Yoo 2004). This method starts with a grid-based piecewise linear registration and then uses a demons registration algorithm as a fine-tuning procedure for a voxel-level spatial deformation. The fully deformable registration allows for a high degree of spatial deformation, which seems to give it a particular advantage over other standard registration packages, such as Automated Image Registration (AIR) and Statistical Parametric Mapping (SPM).
An overview of WMH localization procedure is summarized in Fig. 3. The high-resolution reference image (MNI colin27) is registered to the T1-weighted SPGR high-resolution image of the subject using ALP, and the Johns Hopkins University White Matter Atlas (defined on the reference brain MNI colin27 image) is warped into each individual’s anatomic image space. Then the anatomic information in subject SPGR space is transformed further into the subject’s FLAIR image space by rigid-body registration between the subject SPGR image and subject T1 in-plane image, which was acquired the same slice prescription as the subject’s FLAIR image. In this way, the anatomical information in the atlas is carried into the subject’s FLAIR space and the ROIs labeled on the subject’s FLAIR image are used as binary masks to localize the WMHs. In this procedure, the WMH localization task is viewed as a registration procedure. The Johns Hopkins University White Matter Atlas we used in the current study is based on high-resolution diffusion tensor MR imaging and 3d tract reconstruction. The atlas has 17 prominent white tracts including anterior thalamic radiation (ATR), cingulum (Cg) and other tracts (Wakana, et al. 2004), as listed in Table 2.
Fig. 3.

An overview of the WMH localization procedure.
Table 2.
Mean Volumes of WMH (mm3) per region for the control group (8 controls) versus the patient group (11 patients) and the t-test results on normalized WMHs.
| Region\ Group | Mean WMH Volume Control (mm3) | Mean WMH Volume Patient (mm3) | Two tailed t-test on Normalized WMH |
|---|---|---|---|
| Whole Brain | 2737.3437 | 8541.030942 | 0.042665436 |
| ATRL | 649.7712 | 2211.418354 | 0.055444463 |
| ATRR | 821.34 | 1764.802473 | 0.018656432 |
| CCF | 201.6846 | 1165.593838 | 0.016828416 |
| CCO | 416.1456 | 1529.608106 | 0.012737393 |
| CSTL | 148.2975 | 309.167762 | 0.057927493 |
| CSTR | 158.3361 | 652.5467107 | 0.060871669 |
| CgLL | 35.1351 | 110.2963835 | 0.081089283 |
| CgLR | 8.6697 | 40.42591736 | 0.060644356 |
| CgUL | 11.8638 | 550.094162 | 0.136364206 |
| CgUR | 24.1839 | 29.50488595 | 0.818743765 |
| IFOL | 338.1183 | 1226.836086 | 0.034295001 |
| IFOR | 478.6587 | 2039.035002 | 0.039086461 |
| ILFL | 192.5586 | 716.5644694 | 0.018575153 |
| ILFR | 214.9173 | 860.4083306 | 0.038395966 |
| SLFBL | 273.3237 | 929.735762 | 0.35930778 |
| SLFBR | 156.9672 | 1441.153785 | 0.300544506 |
| SLFTL | 128.6766 | 717.4695273 | 0.405860665 |
| SLFTR | 46.5426 | 761.4553388 | 0.297697885 |
| UNCL | 104.0364 | 430.2645025 | 0.168513136 |
| UNCR | 139.1715 | 327.8119537 | 0.030380464 |
Keys: ATRL/R-anterior thalamic radiation (left or right), CCF/O-corpus callusum (frontal or occipital), CSTL/R-corticospinal tract (left or right), CgLL/R-cingulate (lower part left or right), CgUL/R-cingulate (upper part left or right), IFOL/R-interior frontooccipital fasciculus (left or right), SLFBL/F- entire superiro longitudinal fasciculus (left or right), SLFTL/F-superiro longitudinal fasciculus (the branch to the temporal lobe, left or right), UNC-uncinate fasiculus(left or right).
Prior to the ALP registration procedure, the non-brain tissues such as skull and scalp are stripped from the subject’s 3D SPGR image using BET (Smith 2002). A simple morphological method involving threshold, erosion, dilation and hole-filling is used to improve the skull stripping result (Wu, et al. 2005). Also a rigid alignment of the anterior and posterior commissures (AC-PC) and intensity normalization are done on each subject’s 3D SPGR image as well as on the template colin27, which gives each subject the same orientation and image intensity distribution as the template, and therefore improves the registration accuracy.
RESULTS AND DISCUSSION
A subject with some discrete lesions (as well as confluent lesions) is chosen to demonstrate the results of this WMH extraction algorithm. Nine pairs of the segmented WMH slices versus corresponding FLAIR slices from the subject are displayed in Fig. 4, showing this method’s effectiveness in the segmentation of discrete as well as confluent WMHs.
Fig. 4.
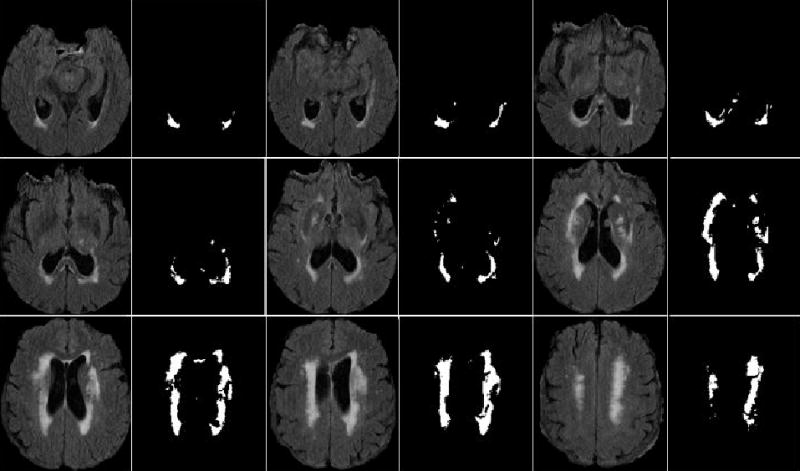
Automated WMH segmentation results on the FLAIR MR images of one subject. Nine paired image slices on the subject are shown here. In each paired slices, the left slice is the FLAIR slice and the right one is the associated automated WMH segmentation result.
WMH segmentation Evaluation
The WMH segmentation results of 19 subjects using this automated method were statistically compared to the WMH visual grades from the manual ratings. The comparison was done with a linear regression model. In this study we chose to use semi-quantitative CHS ratings as the gold standard for comparison. An alternative approach would have been to use manually segmented WMH tracings. Since the two measures being compared used different metrics, we are only demonstrating a correlation between the measures rather an absolute agreement.
The WMH volumes of the 19 subjects from the automated segmentation method were found to be significantly correlated to the visual grades with a R-squared = 0.909 and F(1,18) = 170.7, P < 0.0001. Since the visual grade is a global index to the WMH severity on the subject brain image, the WMH volume is normalized by the overall WM volume (calculated from SPGR brain image). The normalized WMH results were also significantly correlated to the visual grades (R-squared = 0.909, F(1,18) = 170.3, P < 0.0001). This WM normalization method may not be the best way for whole brain adjustment, since previous studies have showed that WMH are significantly related to atrophy (Capizzano, et al. 2004; Schmidt, et al. 2005). A whole brain normalization method, which takes brain atrophy into consideration, may be better for WMH assessment.
The high correlation between the normalized WMH quantifications from the automated method and the visual grades demonstrates that this automated method can successfully segment the WMHs on MR FLAIR images.
Localization of WMHs
Using ALP, the Johns Hopkins University White Matter Atlas was transferred to subject’s 3D SPGR image and further carried into subject FLAIR image space. The atlas regions in the subjects’ FLAIR image space were then used as ROI masks to localize the WMHs. Fig. 5 shows the segmented ROIs in MNI template colin27 space, the individual SPGR structural space and FLAIR image spaces; respective MR images are also shown as underlay images.
Fig. 5.
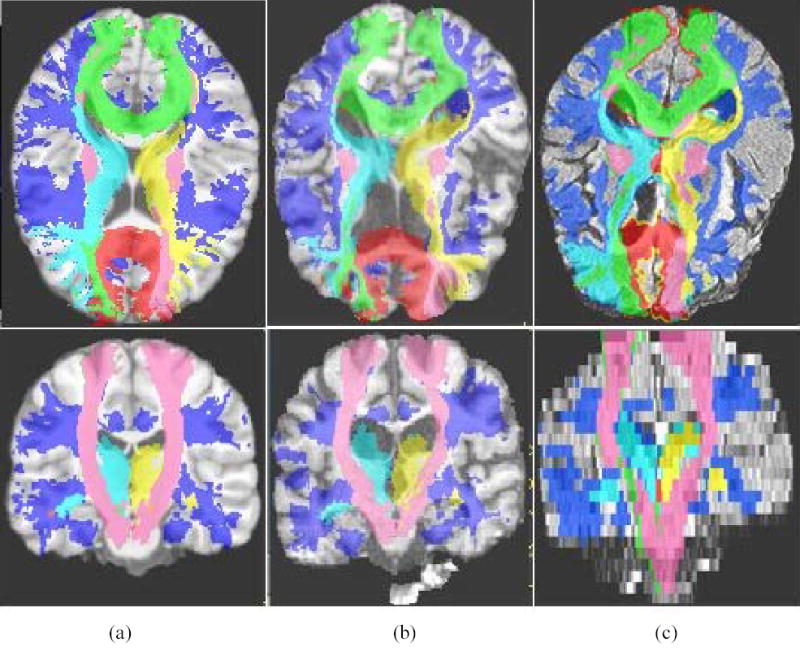
The result of atlas-based segmentation from ALP. Segmentation results are shown at axial orientation in the top row and the coronal orientation in the bottom row. (a) The MNI template colin 27, overlapped with the Johns Hopkins University White Matter Atlas (i.e., Anterior thalamic radiation, corpus callosum, corticospinal tract, inferior fronto occipital, inferior longitudinal fasciculus, superior longitudinal fasciculus, right uncinate fasciculus etc. (b) A single subject 3d SPGR image, overlapped with the transformed ROIs. (c) The same single subject FLAIR image, overlapped with the transformed ROIs.
The localized WMH volumes were quantified by multiplying voxel size by the number of WMH voxels inside the ROIs including anterior thalamic radiations, corticospinal tracts etc, as listed in Table 2. The WMH volume estimates from WMH localization describe the spatial distribution of the WMH burden, which can facilitate further research on the role of WMH in pathogenesis of neuropsychiatric disorders. In Table 2, for each region of interest, the WMH volumes of the LLD patient group were statistically compared to the WMH volumes of the control group using two-tailed two-sample unequal variance t-test. We found a significant difference in whole brain WMH volume between the LLD patient group and the control group; however, the results from the WMH localization method provide more anatomical specificity. As shown in Table 2, there was significant difference in WMH spatial distribution between LLD patient group and control group in regions including right anterior thalamic radiation, corpus callusum (CC), inferior fronto occipital (IFO), inferior longitudinal fasciculus (ILF), and right uncinate fasciculus (UNC), while no significant difference was found in cingulum (CgLL, CgLR, CgUL, CgUR) and superior longitudinal fasciculus (SLFBL, SLFBR, SLFTL, SLFTR).
The current study is limited by the low-resolution FLAIR image, as well as the limited number of subjects (11 patients and 8 control subjects). The analyzed FLAIR images were acquired with a slice thickness of 5mm and a 1mm gap, which may be an inadequate resolution for accurate volumetric quantification of the WMHs, which accordingly may affect the reliability of the group comparison results. A higher image resolution, such as a slice thickness of 2mm and with no gap, could improve the WMH quantification, and improve the registration accuracy, which would lead to more accurate WMH localization. Also a larger group of well-characterized LLD subjects with a matched elderly non-depressed control group would add confidence to the WMH localization findings in Table 2 that are specific for LLD.
The WMH segmentation and localization method we described provides more specific and more accurate information about WMH volume and spatial distribution than visual WMH grades. Also the fully automated method is objective and it does not require any manual interventions. Unlike different visual grading systems, it is very easy to compare the WMH findings from this method across different centers. The method relies on the properties of subject’s own FLAIR image such as the intensity distribution of WMHs, the connectivity and the diffusivity of the WMHs for the WMH segmentation, which does not rely on any training dataset as do some of the reviewed methods (Kikinis, et al. 1992; Swartz, et al. 2002; Anbeek, et al. 2004b; Anbeek, et al. 2004a).
CONCLUSION
In this report we presented and validated a new method for fully automated segmentation and localization of WMHs on MR images. The method adapts the fuzzy connected algorithm for WMH segmentation and uses a demons-based fully deformable registration for WMH localization. The automated WMH segmentation method was evaluated by comparing the resulting WMH quantifications (non-normalized or normalized by total WM volumes) of the 19 elderly subjects subjects (11 late-life depressed subjects and 8 elderly controls) with the standard visual grading approach for estimating WMH burden. In the comparisons we found a high correlation of the WMH ratings between our new semi-automated approach and the manual ratings. Specifically, the two methods correlate with R-squared = 0.909, P <0.0001. Further localization of WMH follows the expected patterns of LLD, i.e., high WMH burden in the subcortical, and frontal regions.
Quantification and localization of WMH volumes is critical for research into the risk factors and pathogenesis of neuropsychiatric disorders. Most previous methods were labor intensive, subjective, and provided little if any anatomic localization. The current method solves many of the previous limitations: it does not require any manual intervention, provides WMH volume estimates, and localizes the WMH burden to a number of anatomic ROIs. Methods such as described here are particularly relevant given the emergence of large MRI databases, such as that provided by the Alzheimer’s Disease Neuroimaging Initiative (http://www.loni.ucla.edu/ADNI/).
The development and implementation of an automated method for quantifying and localizing WMH will facilitate further, fine-grained understanding of: 1) short- AND long-term treatment response; 2) evolution of cognitive functioning in late life depression; 3) evolution of leukoarisosis in LLD; 4) impact of medical and pschiatric treatment on WMHs in LLD; and 5) modeling of cognitive impairment in LLD: e.g., is diminution in speed of information processing driven primarily by WMH, beta amyloid deposition, or both?
Acknowledgments
This work is supported in part by NIH grants MH64678, MH37869, MH043832, MH067710, P30MH52247, and P30MH71944.
References
- Aizenstein HJ, Butters MA, Figurski JL, Stenger VA, Reynolds CFI, Carter CS. Prefrontal and striatal activation during sequence learning in geriatric depression. Biological Psychiatry. doi: 10.1016/j.biopsych.2005.04.023. In Press. [DOI] [PubMed] [Google Scholar]
- Anbeek P, Vincken KL, van Osch MJ, Bisschops RH, van der Grond J. Automatic segmentation of different-sized white matter lesions by voxel probability estimation. Medical Image Analysis. 2004a;8(3):205–215. doi: 10.1016/j.media.2004.06.019. [DOI] [PubMed] [Google Scholar]
- Anbeek P, Vincken KL, van Osch MJ, Bisschops RH, van der Grond J. Probabilistic segmentation of white matter lesions in MR imaging. Neuroimage. 2004b;21(3):1037–1044. doi: 10.1016/j.neuroimage.2003.10.012. [DOI] [PubMed] [Google Scholar]
- American Psychiatric Association 2000. Diagnostic and Statistical Manual of Mental Disorders DSM-IV-TR. American Psychiatric Association; [Google Scholar]
- Beekman AT, de Beurs E, van Balkom AJ, Deeg DJ, van Dyck R, van Tilburg W. Anxiety and depression in later life: co-occurrence and communality of risk factors. American Journal of Psychiatry. 2000;157(1):89–95. doi: 10.1176/ajp.157.1.89. [DOI] [PubMed] [Google Scholar]
- Benson RR, Guttmann CRG, Wei X, Warfield SK, Hall C, Schmidt JA, Kikinis RIWL. Older people with impaired mobility have specific loci of periventricular abnormality on MRI. Neurology. 2002;58:48–55. doi: 10.1212/wnl.58.1.48. [DOI] [PubMed] [Google Scholar]
- Bryan R, Manolio T, Schertz L, Jungreis C, Poirier V, Elster A, Kronmal H. A method for using MR to evaluate the effects of cardiovascular disease on the brain: the Cardiovascular Health Study. American Journal of Neuroradiology. 1994;15:1625–1633. [PMC free article] [PubMed] [Google Scholar]
- Capizzano AA, Ación L, Bekinschtein T, Furman M, Gomila H, Martínez A, Mizrahi R, Starkstein SE. White matter hyperintensities are significantly associated with cortical atrophy in Alzheimer’s disease. Journal of Neurology Neurosurgery and Psychiatry. 2004;75:822–827. doi: 10.1136/jnnp.2003.019273. [DOI] [PMC free article] [PubMed] [Google Scholar]
- Chen M. 3-D deformable registration using a statistical atlas with applications in medicine. Carnegie Mellon University.; 1999. [Google Scholar]
- Davis PC, Gray L, Albert MS, Wilkinson W, Hughes J, Heyman A, Gado M, Kumar AJ, Destian S, Lee C. The consortium to establish a registry for Alzheimer’s disease (CERAD). Part III. reliability ofa standardized MRI evaluation of Alzheimer’s disease. Neurology. 1992;42(9):1676–1680. doi: 10.1212/wnl.42.9.1676. [DOI] [PubMed] [Google Scholar]
- DeCarli C, Fletcher E, Ramey V, Harvey D, Jagust WJ. Anatomical mapping of white matter hyperintensities (WMH): exploring the relationships between periventricular WMH, Deep WMH, and total WMH burden. Stroke. 2005;36:50–55. doi: 10.1161/01.STR.0000150668.58689.f2. [DOI] [PMC free article] [PubMed] [Google Scholar]
- Fazekas F, Chawluk J, Alavi A, Hurtig H, Zimmerman R. MR signal abnormalities at 1.5 T in Alzheimer’s dementia and normal aging. American Journal of Roentgenology. 1987;149(2):351–6. doi: 10.2214/ajr.149.2.351. [DOI] [PubMed] [Google Scholar]
- Hickie I, Scott E. Late-onset depressive disorders: a preventable variant of cerebrovascular disease? Psychological Medicine. 1998;28(5):1007–1013. doi: 10.1017/s0033291797006090. [DOI] [PubMed] [Google Scholar]
- Hirono N, Hajime K, Kazui H, Hashimoto M, Mori E. Impact of white matter changes on clinical manifestation of Alzheimer’s disease a quantitative study. Stroke. 2000;31:2182 – 2188. doi: 10.1161/01.str.31.9.2182. [DOI] [PubMed] [Google Scholar]
- Jack CR, Jr, O’Brien PC, Rettman DW, Shiung MM, Xu Y, Muthupillai R, Manduca A, Avula R, Erickson BJ. FLAIR histogram segmentation for measurement of leukoaraiosis volume. Journal of Magnetic Resonance Imaging. 2001;14(6):668–676. doi: 10.1002/jmri.10011. [DOI] [PMC free article] [PubMed] [Google Scholar]
- Kikinis R, Shenton ME, Gerig G, Martin J, Anderson M, Metcalf M, Guttman CR, McCarley RW, Lorenson W, Cline H, et al. Routine quantitative analysis of brain and cerebrospinal fluid spaces with MR imaging. Journal of Magnetic Resonance Imaging. 1992;2:619–629. doi: 10.1002/jmri.1880020603. [DOI] [PubMed] [Google Scholar]
- Miki Y, Grossman RI, Udupa JK, Samarasekera S, van Buchem MA, Cooney BS, Pollack SN, Kolson DL, Constantinescu C, Polansky M, et al. Computer-assisted quantitation of enhancing lesions in multiple sclerosis: correlation with clinical classification. American Journal of Neuroradiology. 1997;18(4):705–710. [PMC free article] [PubMed] [Google Scholar]
- Mirsen T, Lee D, Wong C, Diaz J, Fox A, Hachinski V, Merskey H. Clinical correlates of white-matter changes on magnetic resonance imaging scans of the brain. Archives of Neurology. 1991;48:1015–1021. doi: 10.1001/archneur.1991.00530220031015. [DOI] [PubMed] [Google Scholar]
- O’Brien J, Ames D, Schwietzer I. White matter changes in depression and Alzheimer’s disease: a review of magnetic resonance imaging studies. International Journal of Geriatric Psychiatry. 1996;11:681–694. [Google Scholar]
- Pachai C, Zhu YM, Grimaud J, Hermier M, Dromigny-Badin A, Boudraa A, Gimenez G, Confavreux C, Froment JC. A pyramidal approach for automatic segmentation of multiple sclerosis lesions in brain MRI. Computerized Medical Imaging and Graphics. 1998;22:399–408. doi: 10.1016/s0895-6111(98)00049-4. [DOI] [PubMed] [Google Scholar]
- Rosano C, Becker J, Lopez O, Lopez-Garcia P, Carter C, Newman A, Kullere L, Aizenstein H. Morphometric analysis of gray matter volume in demented older adults: exploratory analysis of the Cardiovascular Health Study brain MRI database. Neuroepidemiology. 2005;24(4):221–229. doi: 10.1159/000085140. [DOI] [PubMed] [Google Scholar]
- Schmidt R, Ropele S, Enzinger C, Petrovic K, Smith S, Schmidt H, Matthews PM, Fazekas F. White matter lesion progression, brain atrophy, and cognitive decline: the Austrian stroke prevention study. Annals of Neurology. 2005;58(4):610–616. doi: 10.1002/ana.20630. [DOI] [PubMed] [Google Scholar]
- Smith SM. Fast robust automated brain extraction. Human Brain Mapping. 2002;17(3):143–55. doi: 10.1002/hbm.10062. [DOI] [PMC free article] [PubMed] [Google Scholar]
- Stamatakis EA, Tyler LK. Identifying lesions on structural brain images-Validation of the method and application to neuropsychological patients. Brain and Language. 2005;94:167–177. doi: 10.1016/j.bandl.2004.12.010. [DOI] [PubMed] [Google Scholar]
- Swartz RH, Black SE, Feinstein A, Rockel C, Sela G, Gao FQ, Caldwell CB, Bronskill MJ. Utility of simultaneous brain, CSF and hyperintensity quantification in dementia. Psychiatry Research Neuroimaging. 2002;116:83–93. doi: 10.1016/s0925-4927(02)00068-9. [DOI] [PubMed] [Google Scholar]
- Taylor WD, MacFall JR, Steffens DC, Payne ME, Provenzale JM, Krishnan KR. Localization of age-associated white matter hyperintensities in late-life depression. Progress in Neuro-Psychopharmacology & Biological Psychiatry. 2003;27(3):539–544. doi: 10.1016/S0278-5846(02)00358-5. [DOI] [PubMed] [Google Scholar]
- Thomas AJ, Kalaria RN, O’Brien JT. Depression and vascular disease: what is the relationship? Journal of Affective Disorders. 2004;79(1–3):81–95. doi: 10.1016/S0165-0327(02)00349-X. [DOI] [PubMed] [Google Scholar]
- Udupa JK, Samarasekera S. Fuzzy connectedness and object definition: theory, algorithms, and applications in image segmentation. Graphical Models and Image Processing. 1996;58(3):246–261. [Google Scholar]
- Udupa JK, Wei L, Samarasekera S, Miki Y, Van Buchem M, Grossman R. Multiple sclerosis lesion quantification using fuzzy-connectedness principles. IEEE Transactions on Medical Imaging. 1997;16(5):598–609. doi: 10.1109/42.640750. [DOI] [PubMed] [Google Scholar]
- van Gijn J. Leukoaraiosis and vascular dementia. Neurology. 1998;51(3 Suppl 3):S3–8. doi: 10.1212/wnl.51.3_suppl_3.s3. [DOI] [PubMed] [Google Scholar]
- Wakana S, Jiang H, Nagae-Poetscher LM, van Zijl PCM, Mori S. Fiber tract–based atlas of human white matter anatomy. Radiology. 2004;230:77–87. doi: 10.1148/radiol.2301021640. [DOI] [PubMed] [Google Scholar]
- Wen W, Sachdev P. The topography of white matter hyperintensities on brain MRI in healthy 60- to 64-year-old individuals. Neuroimage. 2004;22(1):144–154. doi: 10.1016/j.neuroimage.2003.12.027. [DOI] [PubMed] [Google Scholar]
- Wu M, Carmichael O, Carter CS, Figurski JL, Lopez-Garcia P, Aizenstein HJ. Quantitative comparison of neuroimage registration by AIR, SPM, and a fully deformable model. Human Brain Mapping. In Press doi: 10.1002/hbm.20216. [DOI] [PMC free article] [PubMed] [Google Scholar]
- Wu M, Rosano C, Aizenstein HJ. A morphological method to improve skull stripping of MR brain images. Toronto, Canada: 2005. [Google Scholar]
- Yoo T. Insight into Images: Principles and Practice for Segmentation, Registration, and Image Analysis. Wellesey, MA: AK Peters Ltd; 2004. [Google Scholar]
- Yue N, Arnold A, Longstreth W, Elster A, Jungreis C, O’Leary D, Poirier V, Bryan R. Sulcal, ventricular, and white matter changes at MR imaging in the aging brain: data from the Cardiovascular Health Study. Radiology. 1997;202:33–39. doi: 10.1148/radiology.202.1.8988189. [DOI] [PubMed] [Google Scholar]