Abstract
AtSUC9 (At5g06170), a sucrose (Suc) transporter from Arabidopsis (Arabidopsis thaliana) L. Heynh., was expressed in Xenopus (Xenopus laevis) oocytes, and transport activity was analyzed. Compared to all other Suc transporters, AtSUC9 had an ultrahigh affinity for Suc (K0.5 = 0.066 ± 0.025 mm). AtSUC9 showed low substrate specificity, similar to AtSUC2 (At1g22710), and transported a wide range of glucosides, including helicin, salicin, arbutin, maltose, fraxin, esculin, turanose, and α-methyl-d-glucose. The ability of AtSUC9 to transport 10 glucosides was compared directly with that of AtSUC2, HvSUT1 (from barley [Hordeum vulgare]), and ShSUT1 (from sugarcane [Saccharum hybrid]), and results indicate that type I and type II Suc transporters have different substrate specificities. AtSUC9 protein was localized to the plasma membrane by transient expression in onion (Allium cepa) epidermis. Using a whole-gene translational fusion to β-glucuronidase, AtSUC9 expression was found in sink tissues throughout the shoots and in flowers. AtSUC9 expression in Arabidopsis was dependent on intragenic sequence, and this was found to also be true for AtSUC1 (At1g71880) but not AtSUC2. Plants containing mutations in Suc transporter gene AtSUC9 were found to have an early flowering phenotype under short-day conditions. The transport properties of AtSUC9 indicate that it is uniquely suited to provide cellular uptake of Suc at very low extracellular Suc concentrations. The mutant phenotype of atsuc9 alleles indicates that AtSUC9 activity leads to a delay in floral transition.
Suc transporters (called SUTs or SUCs) function in cellular proton-coupled Suc uptake and are thought to have two main functions in plants: loading Suc into the phloem in source leaves and uptake of Suc into cells of sink tissues such as roots, fruit, and developing leaves (for review, see Ward et al., 1998; Williams et al., 2000). Suc is the main form of fixed carbon that is transported in the phloem, and Suc also serves as a specific signaling molecule in plants (Teng et al., 2005; Solfanelli et al., 2006). An increase in carbohydrate export from leaves is associated with floral induction in Arabidopsis (Arabidopsis thaliana; Corbesier et al., 1998). Consistent with this, in tobacco (Nicotiana tabacum) decreasing phloem loading of Suc by antisense repression of NtSUT1 causes delayed flowering (Burkle et al., 1998).
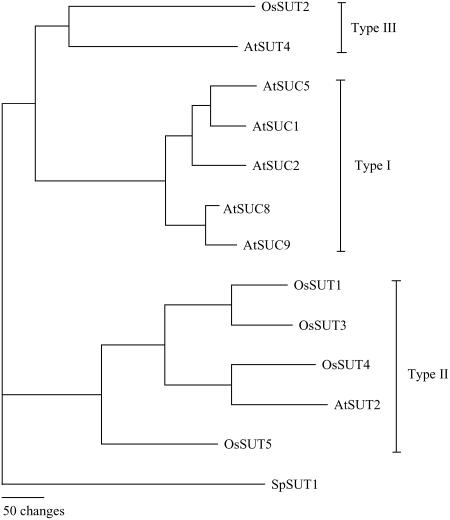
Plant Suc transporters are integral membrane proteins with 12 transmembrane-spanning regions and members of the major facilitator superfamily (Chang et al., 2004). Arabidopsis has nine SUT genes, and phylogenetic analysis revealed three distinct subfamilies called type I, II, and III (Fig. 1) after Aoki et al. (2003). AtSUC1 (At1g71880) and AtSUC2 (At1g22710) were the first Arabidopsis genes demonstrated to encode Suc transporters (Sauer and Stolz, 1994). AtSUC2 is required for phloem loading of Suc (Gottwald et al., 2000), and a detailed analysis of AtSUC2 transport activity has been reported (Chandran et al., 2003). AtSUC2 is the only Arabidopsis type I Suc transporter with a known function in phloem loading; other type I SUTs have been reported to be expressed in sink tissue: AtSUC1 in pollen (Stadler et al., 1999), AtSUC5 (At1g71890) in seeds (Baud et al., 2005), and AtSUC8 (At2g14670) in flowers. To date, the only phenotype associated with mutations in a sink-expressed Suc transporter gene is the decreased fatty acid content in AtSUC5 mutant seeds (Baud et al., 2005). Arabidopsis also encodes one type II Suc transporter, AtSUT2/SUC3 (At2g02860), and one type III Suc transporter, AtSUT4 (At1g09960). Both AtSUT2 and AtSUT4 are expressed in companion cells (Schulze et al., 2003) and therefore are thought to contribute, along with AtSUC2, to phloem loading. Both AtSUT2 and AtSUT4 have lower affinity for Suc than type I SUTs (Schulze et al., 2000; Weise et al., 2000). No expression was detected for AtSUC9 (At5g06170) by promoter β-glucuronidase (GUS) analysis (Sauer et al., 2004); however, microarray analysis indicates highest expression in flowers (Schmid et al., 2005).
Figure 1.
Suc transporter phylogenetic tree. Suc transporter protein sequences of Arabidopsis (AtSUC1 [At1g71880], AtSUC2 [At1g22710], AtSUT2/AtSUC3 [At2g02860], AtSUT4 [At1g09960], AtSUC5 [At1g71890], AtSUC6 [At5g43610], AtSUC7 [At1g66570], AtSUC8 [At2g14670], and AtSUC9 [At5g06170]), rice (OsSUT1 [Os03g07480], OsSUT2 [Os12g44380], OsSUT3 [Os10g26740], OsSUT4 [Os02g58080], and OsSUT5 [Os02g36700]), sugarcane (ShSUT1 [AAV41028]), and barley (HvSUT1 [CAJ20123]) were aligned using ClustalX followed by neighbor-joining analysis in PAUP 4.0 to create the tree. The phylogram was rooted using SpSUT1 (Reinders and Ward, 2001) from Schizosaccharomyces pombe as the outgroup. The assignment of type I, II, and III follows the nomenclature in Aoki et al. (2003).
Considering that plants contain multiple SUT genes that have distinct expression patterns, it is important to determine whether the encoded SUT proteins have different transport activities. Current sequence data indicate that monocots lack type I SUTs (Fig. 1). This suggests that type II and/or III SUTs function in phloem loading in monocot species. Large differences in substrate specificity between AtSUC2 (Chandran et al., 2003) and HvSUT1, a type II SUT from barley (Hordeum vulgare; Sivitz et al., 2005), have been demonstrated. However, it is unknown whether the current data on substrate specificity represent differences between all type I and II SUTs or whether the data reflect strong differences in substrate specificity between monocot and dicot SUTs.
Here we present the detailed analysis of the activity and expression of the Arabidopsis type I Suc transporter AtSUC9. Interestingly, AtSUC9 showed an apparent affinity for Suc that is an order of magnitude higher than any other plant Suc transporter characterized to date. We also demonstrate that expression of AtSUC9 is controlled by intragenic sequences and that promoter-GUS analysis of AtSUC9 is not accurate. We show that this is also true for Suc transporter AtSUC1 that has been previously reported to be pollen specific (Stadler et al., 1999). We extend the analysis of substrate specificity for three previously characterized SUTs (AtSUC2, HvSUT1, and ShSUT1, from sugarcane [Saccharum hybrid]) and AtSUC9. The results indicate that type I SUTs have similar substrate specificity, and, in comparison, monocot type II SUTs are more specific for Suc and other α-glucosides over β-glucosides. Based on the transport properties of AtSUC9 and the early flowering phenotype of AtSUC9 mutant plants, we propose that AtSUC9 functions to delay floral transition by regulating the uptake of Suc and possibly other glucosides at extracellular concentrations in the micromolar range.
RESULTS
AtSUC9 Suc/Proton Symporter Activity
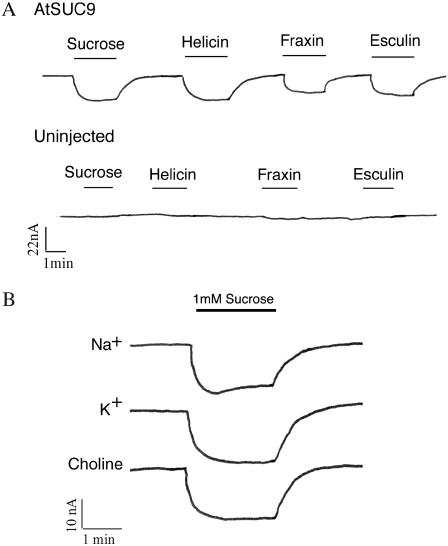
AtSUC9 was expressed in Xenopus (Xenopus laevis) oocytes, and two-electrode voltage clamping was used to analyze transport activity. An inward current was observed in response to perfusion with 1 mm Suc (Fig. 2A), consistent with a proton-coupled mechanism for Suc transport that has been observed for other members of the SUT family. The glucosides fraxin (7,8-dihydroxy-6-methoxy-coumarin-8-β-d-glucoside), helicin (salicylaldehyde β-d-glucoside), and esculin (6,7-dihydroxycoumarin β-d-glucoside) also induced inward currents in AtSUC9-injected oocytes. None of the glucosides used in this study induced currents in uninjected control oocytes (Fig. 2A, bottom trace). Suc induced similar currents in AtSUC9-expressing oocytes when the Na+ in the bath solution was replaced with either K+ or choline (Fig. 2B). This indicates that Na+ was not required as the coupling ion and is consistent with H+ as the coupling ion.
Figure 2.
Sugars induce an inward current in AtSUC9-expressing oocytes. Xenopus oocytes were voltage clamped at −40 mV in sodium Ringer solution at pH 5.6 and currents were recorded. A, Uninjected oocytes (bottom trace) or oocytes injected with AtSUC9 cRNA (top trace) were perfused with substrates at 1 mm concentrations at times indicated by the bars. Downward deflections indicate inward current carried by the coupling ion. B, The Suc-induced current, as seen in A, is Na+ and K+ independent. Each trace represents currents induced by 1 mm Suc in a modified Ringer solution where the major ion was Na+, or where Na+ was replaced with either K+ or choline, as indicated.
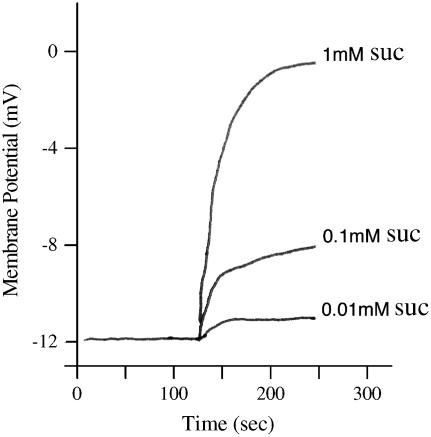
When membrane potential is measured, rather than clamped, proton-coupled Suc symport is expected to cause a membrane depolarization, and this was observed in AtSUC9-expressing oocytes (Fig. 3). Increasing concentrations of Suc applied externally to AtSUC9-expressing oocytes resulted in increasing depolarization from the resting potential. Note that the resting potential depends on the composition of the bath media. At pH 5.6 in modified sodium Ringer solution, the resting potential was −12 mV and is within the observed range (Hagiwara and Jaffe, 1979). The results are consistent with Suc inducing an electrogenic transport of protons.
Figure 3.
Suc induces membrane depolarization in AtSUC9-expressing oocytes. Membrane potential was recorded using an oocyte impaled with a single electrode, referenced against the bath electrodes. Membrane depolarization was observed when the oocyte was perfused with sodium Ringer solution at pH 5.6 containing Suc at the indicated concentrations.
AtSUC9 Encodes an Ultrahigh Affinity Suc Transporter
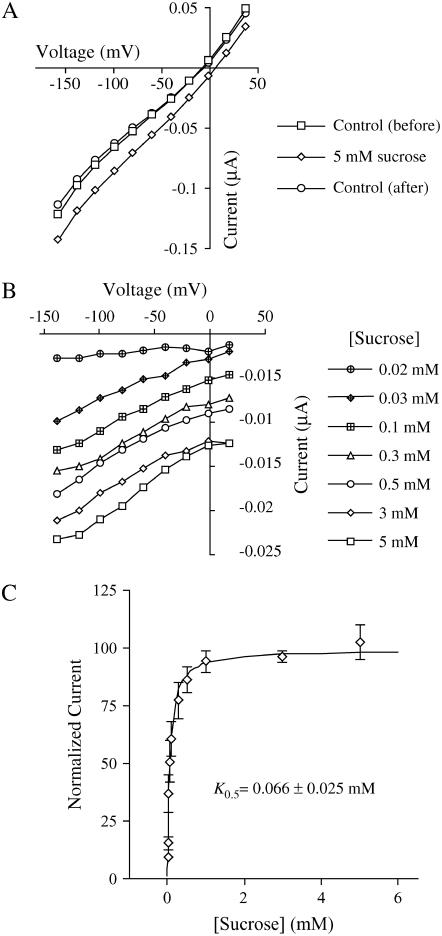
Kinetic analysis of AtSUC9 was performed using two-electrode voltage clamping. Transmembrane currents in AtSUC9-expressing oocytes were measured across a range of membrane potentials before, during, and after application of 5 mm Suc at pH 5.0 (Fig. 4A). The Suc-induced current mediated by AtSUC9 was calculated by subtracting the average current before and after Suc application from the currents recorded during Suc application. Suc-induced currents were plotted to show the current-voltage relationship across a range of Suc concentrations from 0.02 to 5 mm (Fig. 4B; data for 5 mm Suc concentrations is the same as in Fig. 4A). Like other previously studied type I Suc transporters, StSUT1 (Boorer et al., 1996), AtSUC1 (Zhou et al., 1997), and AtSUC2 (Chandran et al., 2003), AtSUC9 has a linear current-voltage relation and does not show any reversal under the conditions measured. The type II transporter from barley, HvSUT1 (Sivitz et al., 2005), showed greater voltage dependence of Suc transport than type I SUTs. By fitting the Michaelis-Menten equation to this data, the K0.5 value for Suc transport by AtSUC9 was found to be 0.066 ± 0.025 mm Suc at a membrane potential of −137 mV and pH of 5.0 (Fig. 4C). This K0.5 value is the lowest reported for any plant Suc transporter to date, making AtSUC9 the highest affinity plant Suc transporter known.
Figure 4.
Kinetic analysis of AtSUC9-mediated Suc transport in Xenopus oocytes. Currents were recorded at pH 5.0. A, Currents recorded before, during, and after application of 5 mm Suc. B, Suc-dependent currents recorded at different Suc concentrations. Background currents before and after Suc application (as in A) were averaged and subtracted from currents recorded during Suc application. C, Suc-dependent currents at a membrane potential of −137 mV (as in B) are plotted against Suc concentration. Line indicates a fit of the Michaelis-Menten equation to the data; error bars are se (n = 3 oocytes).
AtSUC9-Dependent Suc Transport Is Largely pH Independent
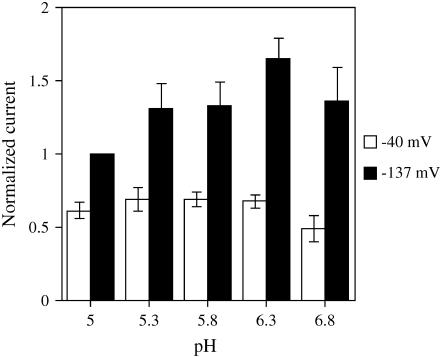
In comparison to other SUTs, the pH independence of AtSUC9 is striking (Fig. 5). Previously characterized transporters, StSUT1 (Boorer et al., 1996), AtSUC1 (Zhou et al., 1997), and HvSUT1 (Sivitz et al., 2005), from both type I and type II subgroups have been shown to be very pH dependent, with higher Suc-induced currents at low pH (around 5.0) that decrease sharply as pH rises above 5.5. A similarly strong pH dependence for Suc transport was observed in plasma membrane vesicles from sugar beet (Beta vulgaris; Bush, 1990; Buckhout, 1994). In contrast, Suc-induced currents through AtSUC9 were independent of pH in the range of 5.0 to 6.3 at a membrane potential of −40 mV (a slight drop in current is observed at pH 6.8; Fig. 5). At more negative membrane potentials, there was a slight pH dependence of Suc-induced currents, opposite from the pH dependence of other SUTs. Whereas previously studied SUTs have all shown highest currents at the lowest pH values, AtSUC9 showed higher currents at pH 6.3 than at pH 5.0 with a membrane potential of −137 mV (Fig. 5).
Figure 5.
pH dependence of Suc-induced current. Currents induced by 1 mm Suc were measured at different membrane potentials and across a range of pH values. Currents were normalized to the current induced by 1 mm Suc at pH 5.0 and a membrane potential of −137 mV for each oocyte. The average current for two potentials (−137 mV in black and −40 mV in white) is shown with se bars (n = 6 oocytes).
AtSUC9 Transports a Wide Range of Glucosides
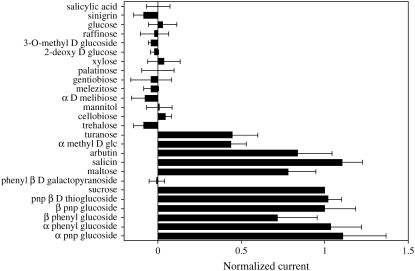
Previously, substrate specificity of three Suc transporters has been examined. AtSUC2, a type I high-affinity transporter, was shown to transport a wide range of substrates (Chandran et al., 2003), while HvSUT1 and ShSUT1, type II moderate-affinity transporters, were shown to be more selective and did not transport most β-linked glucosides (Sivitz et al., 2005; Reinders et al., 2006). The ability of substrates used in these previous studies (Chandran et al., 2003; Sivitz et al., 2005; Reinders et al., 2006) to induce currents in AtSUC9-expressing oocytes was tested (Fig. 6). Similar to AtSUC2, AtSUC9 was found to transport a wide range of substrates, including both α- and β-linked sugars (Fig. 6). The following glucosides were transported at a similar rate as Suc: arbutin (hydroquinone β-d glucoside), salicin [2-(hydroxymethyl) phenyl β-d-glucoside], maltose, paranitrophenyl β-d-thioglucoside, paranitrophenyl β-d-glucoside, β-phenylglucoside, α-phenylglucoside, and paranitrophenyl α-d-glucoside (Fig. 6). Turanose and α-methyl Glc were transported but at rates lower than Suc. All of the transported substrates were also substrates for AtSUC2 (Chandran et al., 2003), indicating that AtSUC9 and AtSUC2 have very similar substrate specificities and both transport a wide range of glucosides.
Figure 6.
Substrate specificity of AtSUC9. Substrate-dependent currents were recorded from Xenopus oocytes expressing AtSUC9 under voltage-clamp conditions. Substrates were applied at 2.5-mm concentrations in sodium Ringer solution, pH 5.0. Currents were recorded at a membrane potential of −137 mV. Substrate-dependent currents were normalized for each oocyte to currents recorded with 2.5 mm Suc to control for differences in AtSUC9 expression between oocytes. The average Suc-induced current under these conditions was 55 nA. Mean currents for three oocytes ± se are presented. pnp, Paranitrophenyl.
AtSUC9 Is Also a High-Affinity Transporter for Salicin and Arbutin
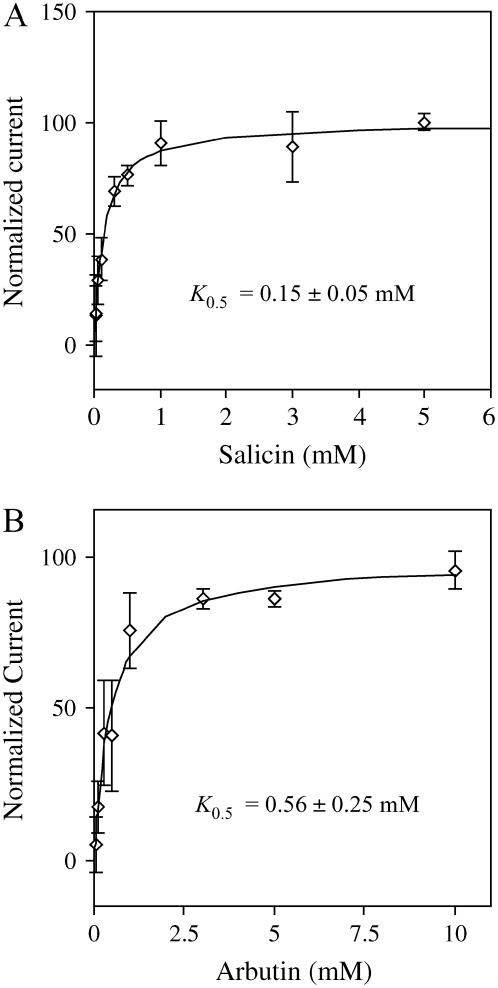
Consistent with the ability to transport a wide range of substrates at rates similar to Suc, kinetic analysis of the transport affinity of AtSUC9 for salicin and arbutin showed that AtSUC9 transports these two substrates at high affinity (Fig. 7). The K0.5 values for both salicin and arbutin (0.15 ± 0.05 mm and 0.56 ± 0.25 mm, respectively) at pH 5.0 and membrane potential −98 mV were found to be higher than the K0.5 for Suc, which was 0.07 ± 0.02 mm under these conditions. AtSUC9 had a higher affinity for salicin and arbutin than either AtSUC2 or HvSUT1. The K0.5 values for AtSUC2 at pH 5.5 for salicin and arbutin were 1.15 ± 0.43 mm and 1.55 ± 0.38 mm, respectively (Chandran et al., 2003). The K0.5 value of HvSUT1 for salicin at pH 5.0 and −98 mV was 10.8 ± 1.5 mm (A.B. Sivitz and J.M. Ward, unpublished data).
Figure 7.
Kinetic analysis of salicin- and arbutin-induced currents. Substrate-dependent currents were normalized to Vmax and plotted against substrate concentration. Currents were measured at pH 5.0, and a membrane potential of −98 mV. The line indicates a fit of the Michaelis-Menten equation to the data, error bars are se (n = 3 oocytes). K0.5 values for salicin (A) and arbutin (B) are presented as in Figure 4C, and under these conditions, the K0.5 for Suc was 0.07 ± 0.02 mm.
Comparative Analysis of Substrate Specificity of Four SUTs
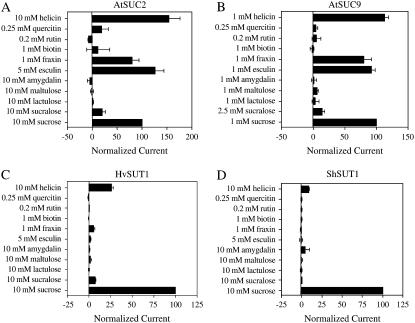
The ability to transport 11 additional potential substrates was examined for four SUTs. The concentration of the applied substrates was chosen based on substrate solubility or concentrations where Suc transport would be saturated. The data is presented as a percent of the Suc-induced current under those conditions to permit comparisons between transporters with very different apparent affinities for transport. As shown in Figure 8, both type I SUTs from dicots (AtSUC9 and AtSUC2) showed similar substrate specificity that was different from that of the type II SUTs from monocots (HvSUT1 and ShSUT1). The type I SUTs transported a wider range of substrates than type II SUTs; in particular, the β-glucosides fraxin and esculin were transported well by type I SUTs and not transported by type II SUTs. Fraxin and esculin are both plant coumarin glucosides. The results indicate that AtSUC2 and AtSUC9 are able to transport this class of compounds into cells, and, furthermore, that AtSUC2 could load coumarin glucosides into the phloem. All of the Suc transporters tested were able to transport helicin (a β-linked phenylglucoside). In agreement with Hitz et al. (1986), the Glc moiety of Suc was essential for transport by all of the SUTs. Only glucosides were transported, while galactosides (e.g. lactulose) were not transported. Biotin induced no current in oocytes expressing any of the four SUTs, and sucralose (4,1′,6′-trichloro-4,1′,6′-trideoxy-galacto-Suc) induced a small current in all but ShSUT1-expressing oocytes.
Figure 8.
Comparative analysis of substrate specificity for four Suc transporters. Substrate-dependent currents were recorded from Xenopus oocytes expressing either A, AtSUC2; B, AtSUC9; C, HvSUT1; or D, ShSUT1 under voltage-clamp conditions. Substrates were applied at concentrations indicated (dictated either by substrate solubility or the Vmax of the transporter) in sodium Ringer solution, pH 5.6. Currents were recorded at a membrane potential of −98 mV. Substrate-dependent currents were normalized to Suc-induced currents for each oocyte. Mean currents for three to six oocytes ± se are presented.
AtSUC9 Localized to the Plasma Membrane
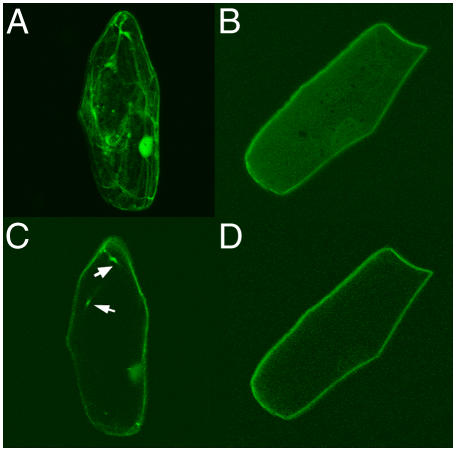
To determine the subcellular localization of AtSUC9, 35S∷AtSUC9cDNA∷green fluorescent protein (GFP) was transiently expressed in onion (Allium cepa) epidermal cells. Figure 9 shows that AtSUC9∷GFP fluorescence was restricted to the outer edges of the onion cells (Fig. 9, B and D). To confirm that this localization was not cytoplasmic (caused by cleavage of the GFP from AtSUC9 protein), fluorescence was compared with free GFP. Free GFP showed intense fluorescence in the nucleus and in cytoplasmic strands that invaginate into the vacuole (Fig. 9, A and C), both of which were not found using the AtSUC9-GFP fusion. This indicates that AtSUC9 is localized to the plasma membrane.
Figure 9.
Subcellular localization of AtSUC9 in onion epidermal cells. 35S∷GFP (A and C) and 35S∷AtSUC9cDNA∷GFP (B and D) were transiently expressed in onion epidermal cells and visualized using confocal microscopy. A and B are Z-projections of optical sections. C and D are individual optical sections from the middle of cells in A and B, respectively. AtSUC9 localizes to the plasma membrane and does not show cytoplasmic strands as seen with free GFP (arrows indicate cytoplasmic strands in C).
Analysis of AtSUC9 Expression and Intragenic Regulatory Elements
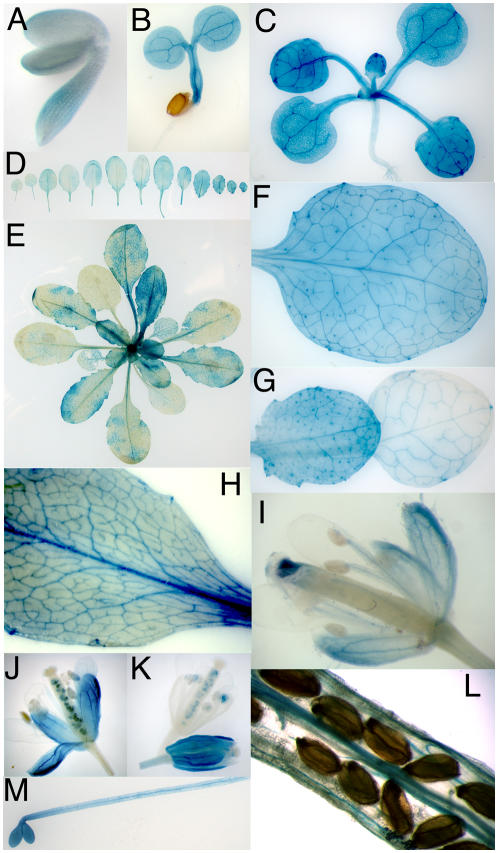
In a previous report, Arabidopsis plants transformed with an AtSUC9-promoter∷GUS fusion construct showed no GUS activity (Sauer et al., 2004). However, when GUS was translationally fused in a construct containing the entire AtSUC9 gene (including 1.7-kb 5′ region, all exons and introns), GUS activity was found throughout the shoot at all stages of development (Fig. 10). GUS activity was found in the embryo (Fig. 10A), the seedling (Fig. 10, B and C), in mature plants (Fig. 10, D and E), and in the vasculature of all aerial tissues. Expression was higher in young versus older leaves (Fig. 10, D, E, and G), and in older leaves expression was more limited to vascular tissue (Fig. 10H). Several SUTs are expressed specifically in vascular tissue; however, AtSUC9 GUS expression was also found in many other cell types, including the mesophyll cells of sink leaves (Fig. 10F) and in nonvascular cells of the stem. Expression in older leaves was often patchy (Fig. 10E). In the flowers, expression was highest in sepals, especially in young flowers (Fig. 10, I and J). Expression was also found in the style and the filament vasculature (Fig. 10I) and in the vascular tissue of siliques (Fig. 10L). GUS activity was found in the hypocotyl and immature cotyledons of etiolated seedlings as well (Fig. 10M). Variable expression was detected in vascular tissue in roots, petals, and siliques (e.g. Fig. 10K). This variability was observed in multiple independent transgenic lines, individual transgenic lines, and individual plants.
Figure 10.
AtSUC9 whole-gene GUS fusion reveals that AtSUC9 is expressed in most tissues. A, Embryo. B, Seedling. C, Four-leaf stage plant. D, Series of rosette leaves from one plant, oldest leaves are on the left proceeding to youngest on right. E, Typical staining of mature rosette. F, Close up of leaf from mature plant. G, Close up of younger (left) and older (right) rosette leaves. H, Leaf. I to K, Flowers. L, Vascular staining in mature silique. M, Etiolated seedling.
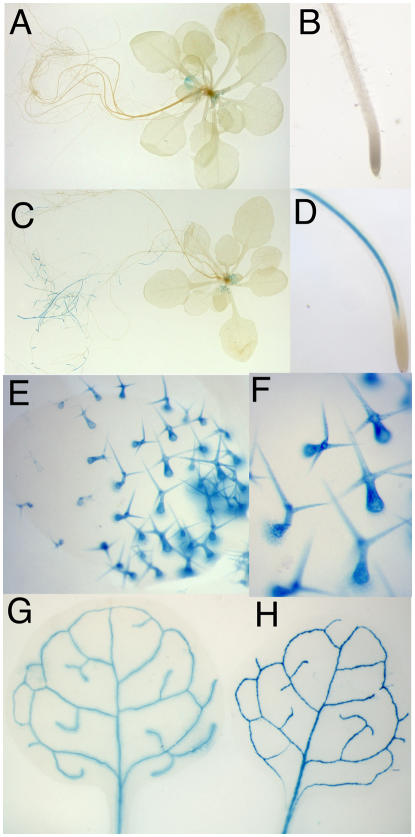
The lack of GUS expression from AtSUC9 promoter∷GUS constructs (Sauer et al., 2004) compared with the expression found for the AtSUC9 whole- gene∷GUS transgenics (Fig. 10) indicates that it is likely that intragenic (exon or intron) sequences control expression of AtSUC9. To test if expression of other Suc transporters is controlled by intragenic sequences, pairs of promoter∷GUS and whole-gene∷GUS constructs were generated for AtSUC1 and AtSUC2. There is some discrepancy in the literature regarding AtSUC1 expression. RNA-blot analysis showed AtSUC1 expression in leaves and roots (Sauer and Stolz, 1994), while RNase protection assays showed flower-specific expression (Stadler et al., 1999). Promoter∷GUS analysis showed AtSUC1 expression only in pollen (Stadler et al., 1999), while microarray data showed AtSUC1 expression in roots and leaves as well as flowers (Schmid et al., 2005). Therefore, we produced transgenic Arabidopsis expressing GUS under control of a 2-kb AtSUC1 promoter. GUS expression was found in developing trichomes (Fig. 11, A, E, and F) and in pollen (data not shown). It should be noted that Stadler et al. (1999) used a glabrous strain (C24) and therefore did not observe expression in trichomes. Otherwise, SUC1 promoter∷GUS results reported here and previously (Stadler et al., 1999) are similar. GUS expression from an AtSUC1 whole-gene translational fusion was found in pollen (data not shown), trichomes, and the vasculature of the root (Fig. 11, C and D) with expression concentrated in newly developed roots and absent in mature regions. Expression of AtSUC1 in root vasculature was only found with the whole-gene∷GUS construct and can be attributed to control of expression by intragenic regulatory sequences. In contrast, AtSUC2 showed an identical expression pattern when GUS was expressed from a promoter∷GUS or a whole-gene∷GUS construct (Fig. 11, G and H). The results indicate that control of expression by intragenic sequences is a common feature of some SUT genes.
Figure 11.
AtSUC1, but not AtSUC2, has regulatory elements outside the 5′ region. A, B, E, and F, AtSUC1-promoter∷GUS. C and D, AtSUC1-whole-gene∷GUS. G, AtSUC2-promoter∷GUS. H, AtSUC2-whole-gene∷GUS. A and C are whole plants, B and D are close ups of the root tip, E is a leaf showing trichome staining, F is a close up of trichomes, and G and H are rosette leaves.
Analysis of AtSUC9 Mutants
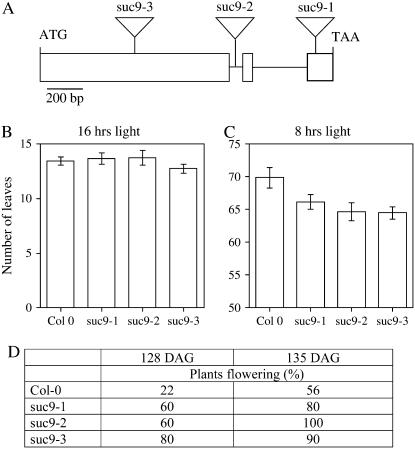
Three independent homozygous T-DNA insertions in AtSUC9 were identified from the Salk collection. As indicated in Figure 12A, insertions were identified in the first exon (suc9-3), first intron (suc9-2), and third exon (suc9-1). Under long-day conditions (16 h light/day), both wild-type and the three suc9 mutants had a similar number of leaves (mean = 13) at flowering (Fig. 12B). However, under short days (8 h light), the suc9 mutants flowered earlier (Fig. 12D) and accumulated an average of four to five fewer leaves at flowering (Fig. 12C). Aside from early flowering when grown under short-day conditions, no differences in growth or development were observed compared to wild type (ecotype Columbia [Col-0]). No differences in starch content or growth on media containing Suc, Glc, or abscisic acid were observed for the atsuc9 mutants compared to Col-0.
Figure 12.
Mutations in AtSUC9 cause early flowering under short-day conditions. A, Diagram showing locations of T-DNA insertions in suc9-1 (third exon), suc9-2 (first intron), and suc9-3 (first exon). B and C, Number of leaves at flowering for wild type (Col-0) and three suc9 alleles (mean ± se, n = 8–10 plants). B, Plants grown under long days (16 h light, 8 h dark). C, Plants grown under short days (8 h light, 16 h dark). D, Percent of plants flowering at either 128 or 135 d after germination (DAG) under short-day conditions (8 h light, 16 h dark; n = 9 or 10).
DISCUSSION
The Suc concentration in the apoplast surrounding most cells in leaves is low, in the range of 0.5 mm (Outlaw and Vlieghere-He, 2001). Suc concentration in the apoplast surrounding the phloem in source leaves is thought to be higher (for review, see Giaquinta, 1983). And, depending on transpiration rate, the Suc concentration surrounding guard cells is in the range of 150 mm (Outlaw and Vlieghere-He, 2001). Therefore, it is not surprising that Suc transporters display a wide range of K0.5 values for Suc. We have analyzed the transport activity and expression pattern of AtSUC9; the apparent affinity for Suc was very high (K0.5 = 0.066 ± 0.025 mm at −137mV and pH 5.0). In comparison, AtSUC2, which is responsible for phloem loading, had a 20-fold lower apparent affinity with a K0.5 of 1.44 mm for Suc when recorded under identical conditions (Chandran et al., 2003), and type II SUTs studied to date have even lower affinity for Suc (Carpaneto et al., 2005; Sivitz et al., 2005; Reinders et al., 2006).
AtSUC9 transport activity is uniquely pH independent in the range of external pH from 5 to 6.8. This indicates that, unlike other Suc transporters studied to date, AtSUC9 activity is not stimulated by cell wall acidification. As a proton-coupled transporter, AtSUC9 activity is driven by the transmembrane pH gradient (and membrane potential); the pH independence of AtSUC9 activity could indicate that the binding site for extracellular protons has a much higher affinity than that of other Suc transporters. Another possibility for the observed pH independence might be that other regulatory sites are present on the transporter that down-regulate activity at low pH.
The substrate specificity of AtSUC9 is similar to that of AtSUC2 (Chandran et al., 2003), the only other type I SUT for which comparable data is available. Both α- and β-glucosides were transported; of the natural sugars tested, Suc, maltose, salicin, arbutin, and turanose were transported by both AtSUC2 (Chandran et al., 2003) and AtSUC9 (Fig. 6). To extend the available comparative substrate specificity data, the ability of AtSUC2, AtSUC9, HvSUT1, and ShSUT1 to transport a range of additional natural glucosides and the Suc analog sucralose was tested (Fig. 8). ShSUT1 from sugarcane was the most selective transporter tested; it only accepted Suc as a substrate. HvSUT1 was almost as selective but transported helicin, and to a lesser extent fraxin and sucralose, in addition to Suc. AtSUC9 and AtSUC2 showed very similar specificities, and both transported helicin, fraxin, esculin, and sucralose in addition to Suc. These data further support the hypothesis of Chandran et al. (2003) that Suc transporters function in the transport of glucosides in addition to Suc. Coumarins, such as esculin, have recently been found in small quantities in Arabidopsis (Kai et al., 2006), and they have been shown to function in plant defense against herbivorous insects (Silva et al., 2006). Because AtSUC9 transports salicin and arbutin with very high affinities (Fig. 7), AtSUC9 could play a significant role in transporting various glucosides, such as esculin, which are found in very low quantities.
Type I transporters were similar to each other in substrate specificity but distinct from type II (HvSUT1 and ShSUT1). The type II transporters were more selective in their ability to transport β-linked sugars. The only β-linked substrates that HvSUT1 transports are helicin (this study) and salicin (Sivitz et al., 2005), while ShSUT1 has been found to transport only salicin (Reinders et al., 2006). Salicin and helicin are very similar, differing only at the ortho position of the phenyl group: −CH2OH (salicin) or −CHO (helicin). Arbutin is also very similar, containing a hydroxyl group at the para position but is not transported by the type II SUTs. Nonmodified β-phenyl glucoside is not transported well by ShSUT1 (Reinders et al., 2006) or HvSUT1 (Sivitz et al., 2005); the results indicate that modification of the phenyl group at the ortho position allows recognition of the substrate by type II SUTs. ShSUT1 furthermore discriminates between −CH2OH versus −CHO at this position. Analysis of the three-dimensional structure of these phenylglucosides indicates that position of the phenyl ring is similar for salicin, helicin, and arbutin (Lostao et al., 1994). Therefore, the differences in transport of the compounds can be attributed to differences in modification of the phenyl group.
The size of the aglucone may also be important in determining whether β-glucosides serve as substrates. AtSUC2 and AtSUC9 can transport the larger coumarin glucosides esculin and fraxin, while the type II SUTs do not. Also, sucralose is not a substrate for the type II SUTs, but Reinders et al. (2006) showed that sucralose is recognized by the ShSUT1 molecule and not transported. Thus, the ability of the substrates discussed above to be recognized by the binding site still needs to be studied, because nontransported substrates may in fact bind to the transporter. Biotin, which was previously reported to be transported by AtSUC5 and PmSUC2 in yeast (Saccharomyces cerevisiae; Ludwig et al., 2000), did not induce a current in any SUT-expressing oocytes. This does not rule out the possibility that it is transported, because at the pH used here, biotin would carry a charge of −1 and cotransport with a H+ would be expected to be electroneutral (and not detectable using electrophysiology).
AtSUC9 had previously been shown by reverse transcription-PCR to be expressed in flowers and siliques (Sauer et al., 2004). However, using a promoter∷GUS construct, the same authors were unable to detect any AtSUC9 expression, indicating that there may be additional regulatory elements outside the promoter region used. To test this, we made a whole-gene∷GUS construct. The results confirm AtSUC9 expression in flowers and siliques, suggesting that there are additional regulatory elements outside the 5′ region. Regulatory elements outside the 5′ region are well documented (Taylor, 1997); for example, AGAMOUS (Deyholos and Sieburth, 2000), rice (Oryza sativa) α-amylase (Chan and Yu, 1998), and α-fetoprotein (Scohy et al., 2000) are plant genes with intragenic regulatory elements. Additionally, AtSUC1 also shows differential expression patterns when comparing whole-gene∷GUS to promoter∷GUS. For AtSUC1, promoter∷GUS studies suggested that AtSUC1 was solely expressed in pollen (Sauer and Stolz, 1994). However, publicly available microarray data indicate that AtSUC1 is expressed in a variety of tissues (Schmid et al., 2005), including leaves and roots. Whole-gene∷GUS fusions are more consistent with AtSUC1 microarray data, revealing that AtSUC1 has intragenic elements controlling expression. According to whole-gene∷GUS analysis, AtSUC1 is expressed in actively growing areas of the root, anthers, and trichomes (trichome expression accounts for leaf expression detected by microarrays). Finally, AtSUC2 showed no differences in expression patterns for promoter∷GUS and whole-gene∷GUS fusions.
Three independent mutant alleles of AtSUC9 showed an early flowering phenotype when grown under short-day conditions. An increase in the export of carbohydrates from leaves has been implicated in floral induction (Corbesier et al., 1998). AtSUC9 expression was found throughout leaves, and its activity may decrease phloem loading and delay floral transition. The effects of atsuc9 mutations are opposite of the effects of antisense inhibition of Suc transporter activity in the phloem in tobacco (Burkle et al., 1998), which delays flowering. Based on the high affinity of AtSUC9 for Suc, the general expression pattern, and the phenotype of atsuc9 mutants, our results indicate that AtSUC9 may prevent premature flowering by maintaining a low concentration of extracellular Suc.
MATERIALS AND METHODS
Cloning
The AtSUC9 (At5g06170) cDNA was amplified from Arabidopsis (Arabidopsis thaliana; Col-0) floral RNA (isolated with Qiagen RNeasy Plant Mini kit using the following primers: NSsuc9F, 5′-gatcgtgcggccgccttttcatctcctctatcacgattcac; NSsuc9R, 5′-gatcgtgcggccgcttaaggtaaaacggtaagtgccacaacactg). The 1.57-kb PCR fragment was cloned into pCR2.1 (Invitrogen), and sequencing showed a 1-bp change that did not affect the amino acid sequence. The AtSUC9 coding region was excised from pCR2.1 with SpeI and XhoI and directionally subcloned into the oocyte expression vector pOO2 (Ludewig et al., 2002). This construct was linearized with PmaCI (PanVera), and 1 μg was used as template for cRNA synthesis with the mMessage mMachine kit (Ambion).
An AtSUC9 genomic clone, including 1.7 kb upstream of the ATG, all exons and introns, and ending just before the stop codon, was amplified from Col-0 genomic DNA using the following primers: suc9Fgw, 5′-agcgagagaggaccttaattccag; suc9R-stop, 5′-aggtaaaacggtaagtgccac. The PCR fragment was cloned into pCR8/GW/TOPO (Invitrogen). The clone was sequenced, and two single base pair changes in the promoter region were found at 290 bp and 548 bp that resulted in an A and C base substitution, respectively. The genomic clone was subcloned into the binary vector pMDC163 (Curtis and Grossniklaus, 2003) using LR clonase (Invitrogen).
The 2-kb AtSUC1 promoter was cloned using the following primers: forward, 5′-ccagctggccaaatcggcccagttaagttttcggttcac; promoter, 5′-cgtgtcggcccttatggccttttctgtttcataggctcc. The genomic AtSUC1 clone, including all introns and exons, was cloned using the forward primer for the promoter and the following reverse primer: 5′-gactcggcccttatggcctggtggaatcctcccatggtcg. The promoter and genomic fragments were cloned into pCR2.1 then subcloned into pUNI100 (Shigaki et al., 2005) using SfiI. Univector clones were recombined with pHP-GUS (Shigaki et al., 2005) for expression in Arabidopsis. AtSUC2 2-kb promoter and full genomic clones were made in the same way as AtSUC1, with the following primers: forward, 5′-ccagctggccaaatcggcctaccagatttcggtaaattgg; promoterR, 5′-gagccaggcccttatggccagaggcctatgaaatcccatagtagctttg; and wholegeneR, 5′-gcacttggcccttatggcctggctgaccatatttgacaaac.
For the 35s∷AtSUC9cDNA∷GFP construct, PCR was performed on the pCR2.1-AtSUC9 cDNA construct using the following primers: SUT9F, cacaacctcttaagataacgtg; SUC9R-stop, AGGTAAAACGGTAAGTGCCAC. This PCR product was cloned into pCR8/GW/TOPO (Invitrogen). The cDNA clone was subcloned into the binary vector pMDC83 (Curtis and Grossniklaus, 2003) using LR clonase (Invitrogen).
AtSUC9 Insertional Mutants
Insertional mutants were obtained from the Arabidopsis Biological Resource Center. The lines Salk_049523 (suc9-1), Salk_010801 (suc9-2), and Salk_050102 (suc9-3) were screened for homozygous mutants using PCR. The following primers were used: At5g06170F (5′-ttcttcgtcggttgtggttcctgatgag), At5g06170R (5′-tgctaccacactcatccatgtgtctact), and LB2 (5′-tagtgggccatcgccctgatagacggtt). To determine flowering time, Arabidopsis insertional mutants and Col-0 were grown in Sunshine mix, LG3 (Sungro), under either 8- or 16-h-light conditions at 20°C and scored for flowering time by counting the number of leaves at flowering and by recording the number of days after germination that plants flowered.
Arabidopsis Transformation
Agrobacterium strain C58C1 was transformed with binary vectors by electroporation. Transformants were selected on Luria-Bertani media containing kanamycin (50 μg/mL) and gentamycin (25 μg/mL). Ampicillin (50 μg/mL) was added for selection with the univector system. Arabidopsis (Col-0) plants were transformed using Agrobacterium and the floral dip method (Clough and Bent, 1998), and T1 transformants were selected by seedling resistance to hygromycin (30 mg/L) or Basta (Finale, Farnam Companies).
Heterologous Expression
Stage V and VI Xenopus oocytes were incubated in Barth's medium [88 mm NaCl, 1 mm KCl, 0.33 mm Ca(NO3)2, 0.41 mm CaCl2, 0.82 mm MgSO4, 2.4 mm NaHCO3, 10 mm HEPES, pH 7.6, 100 μg/mL penicillin, and 100 μg/mL streptomycin] containing 10 mg/mL collagenase A (Roche Applied Science) for 2 to 3 h until completely separated. Oocytes were then washed five times in 1 mg/mL bovine serum albumin in Barth's medium. Oocytes were injected with 50 nL (1.1 ng nL−1) of AtSUC9 cRNA and incubated at 15°C in Barth's medium supplemented with 10 μg mL−1 gentamycin. Electrophysiological experiments were performed 4 to 5 d following RNA injection.
Electrophysiological Methods
Oocytes were bathed in modified sodium Ringer solution (115 mm NaCl, 2 mm KCl, 1.8 mm CaCl2, 5 mm MES, 1 mm MgCl2, pH adjusted with Tris) with continuous perfusion at 1 mL/min. Recording solution pH was 5.0 unless otherwise indicated in figure legends. Recording pipettes, filled with 1 m KCl, with resistances between 1 and 5 megaohms were used. Currents were measured using the two-electrode voltage clamp technique with a Dagan TEV 200A amplifier. Currents were filtered online at 200 Hz and digitized at 2,000 Hz using pClamp 5.5.1 (Axon Instruments). Holding potential was −40 mV, and voltage pulses from −157 mV to 57 mV were applied for 203 ms. Steady-state currents are presented as the mean current between 150 and 200 ms following the onset of voltage pulses. Substrate-dependent currents were obtained by subtracting an average of background currents recorded before and after substrate application.
Transient Expression in Onion Epidermal Cells
Onion (Allium cepa) epidermal layers were placed (inside up) on a petri plate containing Murashige and Skoog media (per liter: 4.2 g Murashige and Skoog salts [Gibco-BRL], 30 g Suc, 2% [w/v] Phytablend [Caisson Laboratories], 50 mg ampicillin, pH 5.7). Plasmid DNA was prepared using column purification (Qiagen). The plasmids (5–10 μg) were precipitated onto 1.1-μm tungsten particles (M-17, Bio-Rad) as described by the manufacturer (Du-Pont). DNA-coated particles were washed with 140 μL of 70% (v/v) ethanol and then resuspended in 36 μL of 100% ethanol. Particles were divided between three macrocarriers. The onion epidermal cells were transformed via the helium biolistic gene transformation system, using 1,100 p.s.i. rupture discs. Transformed cells were incubated at 22°C in the dark overnight. Onion epidermal cells were viewed with a Bio-Rad MRC 1024 laser confocal microscope (Nikon Diaphot Inverted) with a 15-mW krypton/argon laser source. Optical sections and Z-stacks were processed using Image J software.
GUS Staining
GUS activity in transgenic Arabidopsis plants was detected by vacuum infiltration with 1 mm 5-bromo-4-chloro-3-indoyl-β-d-GlcUA in 50 mm sodium phosphate, pH 7.2, containing 0.5% Triton X-100. Samples were incubated overnight at 37°C and cleared in 70% ethanol at 65°C.
Acknowledgments
Sucralose was a generous gift from Tate & Lyle. Katherine Paulus, Hui Tian, and the University of Minnesota Imaging Center are gratefully acknowledged for their help with transient expression experiments.
This work was supported by the U.S. Department of Energy (grant no. DE–FG02–03ER15414 to J.M.W.), by the Bernard and Jean Phinney Graduate Fellowship in Plant Molecular Biology (to A.B.S.), and by the Australian Academy of Science through the International Science and Technology Collaboration Programme (the visit of C.P.L.G. to the Ward laboratory).
The author responsible for distribution of materials integral to the findings presented in this article in accordance with the policy described in the Instructions for Authors (www.plantphysiol.org) is: John M. Ward (jward@tc.umn.edu).
Open Access articles can be viewed online without a subscription.
References
- Aoki N, Hirose T, Scofield GN, Whitfeld PR, Furbank RT (2003) The sucrose transporter gene family in rice. Plant Cell Physiol 44 223–232 [DOI] [PubMed] [Google Scholar]
- Baud S, Wuilleme S, Lemoine R, Kronenberger J, Caboche M, Lepiniec L, Rochat C (2005) The AtSUC5 sucrose transporter specifically expressed in the endosperm is involved in early seed development in Arabidopsis. Plant J 43 824–836 [DOI] [PubMed] [Google Scholar]
- Boorer KJ, Loo DDF, Frommer WB, Wright EM (1996) Transport mechanism of the cloned potato H+/sucrose cotransporter StSUT1. J Biol Chem 271 25139–25144 [DOI] [PubMed] [Google Scholar]
- Buckhout TJ (1994) Kinetics analysis of the plasma membrane sucrose-H+ symporter from sugar beet (Beta vulgaris L.) leaves. Plant Physiol 106 991–998 [DOI] [PMC free article] [PubMed] [Google Scholar]
- Burkle L, Hibberd JM, Quick WP, Kuhn C, Hirner B, Frommer WB (1998) The H+-sucrose cotransporter NtSUT1 is essential for sugar export from tobacco leaves. Plant Physiol 118 59–68 [DOI] [PMC free article] [PubMed] [Google Scholar]
- Bush DR (1990) Electrogenicity, pH-dependence, and stoichiometry of the proton-sucrose symport. Plant Physiol 93 1590–1596 [DOI] [PMC free article] [PubMed] [Google Scholar]
- Carpaneto A, Geiger D, Bamberg E, Sauer N, Fromm J, Hedrich R (2005) Phloem-localized, proton-coupled sucrose carrier ZmSUT1 mediates sucrose efflux under the control of the sucrose gradient and the proton motive force. J Biol Chem 280 21437–21443 [DOI] [PubMed] [Google Scholar]
- Chan MT, Yu SM (1998) The 3′ untranslated region of a rice alpha-amylase gene functions as a sugar-dependent mRNA stability determinant. Proc Natl Acad Sci USA 95 6543–6547 [DOI] [PMC free article] [PubMed] [Google Scholar]
- Chandran D, Reinders A, Ward JM (2003) Substrate specificity of the Arabidopsis thaliana sucrose transporter AtSUC2. J Biol Chem 278 44320–44325 [DOI] [PubMed] [Google Scholar]
- Chang AB, Lin R, Studley WK, Tran CV, Saier MH (2004) Phylogeny as a guide to structure and function of membrane transport proteins. Mol Membr Biol 21 171–181 [DOI] [PubMed] [Google Scholar]
- Clough SJ, Bent AF (1998) Floral dip: a simplified method for Agrobacterium-mediated transformation of Arabidopsis thaliana. Plant J 16 735–743 [DOI] [PubMed] [Google Scholar]
- Corbesier L, Lejeune P, Bernier G (1998) The role of carbohydrates in the induction of flowering in Arabidopsis thaliana: comparison between the wild type and a starchless mutant. Planta 206 131–137 [DOI] [PubMed] [Google Scholar]
- Curtis MD, Grossniklaus U (2003) A gateway cloning vector set for high-throughput functional analysis of genes in planta. Plant Physiol 133 462–469 [DOI] [PMC free article] [PubMed] [Google Scholar]
- Deyholos MK, Sieburth LE (2000) Separable whorl-specific expression and negative regulation by enhancer elements within the AGAMOUS second intron. Plant Cell 12 1799–1810 [DOI] [PMC free article] [PubMed] [Google Scholar]
- Giaquinta RT (1983) Phloem loading of sucrose. Annu Rev Plant Physiol 34 347–387 [Google Scholar]
- Gottwald JR, Krysan PJ, Young JC, Evert RF, Sussman MR (2000) Genetic evidence for the in planta role of phloem-specific plasma membrane sucrose transporters. Proc Natl Acad Sci USA 97 13979–13984 [DOI] [PMC free article] [PubMed] [Google Scholar]
- Hagiwara S, Jaffe LA (1979) Electrical properties of egg cell membranes. Annu Rev Biophys Bioeng 8 385–416 [DOI] [PubMed] [Google Scholar]
- Hitz WD, Card PJ, Ripp KG (1986) Substrate recognition by a sucrose transporting protein. J Biol Chem 261 11986–11991 [PubMed] [Google Scholar]
- Lostao MP, Hirayama BA, Loo DDF, Wright EM (1994) Phenylglucosides and the Na+/glucose cotransporter (SGLT1): analysis of interactions. J Membr Biol 142 161–170 [DOI] [PubMed] [Google Scholar]
-
Ludewig U, von Wiren N, Frommer WB (2002) Uniport of
 by the root hair plasma membrane ammonium transporter LeAMT1;1. J Biol Chem 277 13548–13555 [DOI] [PubMed] [Google Scholar]
 - Ludwig A, Stolz J, Sauer N (2000) Plant sucrose-H+ symporters mediate the transport of vitamin H. Plant J 24 503–509 [DOI] [PubMed] [Google Scholar]
- Kai K, Shimizu B, Mizutani M, Watanabe K, Sakata K (2006) Accumulation of coumarins in Arabidopsis thaliana. Phytochemistry 67 379–386 [DOI] [PubMed] [Google Scholar]
- Outlaw WH, Vlieghere-He XD (2001) Transpiration rate: an important factor controlling the sucrose content of the guard cell apoplast of broad bean. Plant Physiol 126 1716–1724 [DOI] [PMC free article] [PubMed] [Google Scholar]
- Reinders A, Sivitz AB, Hsi A, Grof CPL, Perroux JM, Ward JM (2006) Sugarcane ShSUT1: analysis of sucrose transport activity and inhibition by sucralose. Plant Cell Environ 29 1871–1880 [DOI] [PubMed] [Google Scholar]
- Reinders A, Ward JM (2001) Functional characterization of the alpha-glucoside transporter Sut1p from Schizosaccharomyces pombe, the first fungal homologue of plant sucrose transporters. Mol Microbiol 39 445–454 [DOI] [PubMed] [Google Scholar]
- Sauer N, Ludwig A, Knoblauch A, Rothe P, Gahrtz M, Klebl F (2004) AtSUC8 and AtSUC9 encode functional sucrose transporters, but the closely related AtSUC6 and AtSUC7 genes encode aberrant proteins in different Arabidopsis ecotypes. Plant J 40 120–130 [DOI] [PubMed] [Google Scholar]
- Sauer N, Stolz J (1994) SUC1 and SUC2: two sucrose transporters from Arabidopsis thaliana; expression and characterization in baker's yeast and identification of the histidine-tagged protein. Plant J 6 67–77 [DOI] [PubMed] [Google Scholar]
- Schmid M, Davison TS, Henz SR, Pape UJ, Demar M, Vingron M, Scholkopf B, Weigel D, Lohmann JU (2005) A gene expression map of Arabidopsis thaliana development. Nat Genet 37 501–506 [DOI] [PubMed] [Google Scholar]
- Schulze W, Weise A, Frommer WB, Ward JM (2000) Function of the cytosolic N-terminus of sucrose transporter AtSUT2 in substrate affinity. FEBS Lett 485 189–194 [DOI] [PubMed] [Google Scholar]
- Schulze WX, Reinders A, Ward JM, Lalonde S, Frommer WB (2003) Interactions between co-expressed Arabidopsis sucrose transporters in the split-ubiquitin system. BMC Biochem 4 3. [DOI] [PMC free article] [PubMed] [Google Scholar]
- Scohy S, Gabant P, Szpirer C, Szpirer J (2000) Identification of an enhancer and an alternative promoter in the first intron of the alpha-fetoprotein gene. Nucleic Acids Res 28 3743–3751 [DOI] [PMC free article] [PubMed] [Google Scholar]
- Shigaki T, Vyzasatya RR, Sivitz AB, Ward JM, Sze H, Hirschi KD (2005) The Cre-loxP recombination-based reporter system for plant transcriptional expression studies. Plant Mol Biol 58 65–73 [DOI] [PubMed] [Google Scholar]
- Silva MC, Terra WR, Ferreira C (2006) Absorption of toxic beta-glucosides produced by plants and their effect on tissue trehalases from insects. Comp Biochem Physiol B Biochem Mol Biol 143 367–373 [DOI] [PubMed] [Google Scholar]
- Sivitz AB, Reinders A, Ward JM (2005) Analysis of the transport activity of barley sucrose transporter HvSUT1. Plant Cell Physiol 46 1666–1673 [DOI] [PubMed] [Google Scholar]
- Solfanelli C, Poggi A, Loreti E, Alpi A, Perata P (2006) Sucrose-specific induction of the anthocyanin biosynthetic pathway in Arabidopsis. Plant Physiol 140 637–646 [DOI] [PMC free article] [PubMed] [Google Scholar]
- Stadler R, Truernit E, Gahrtz M, Sauer N (1999) The AtSUC1 sucrose carrier may represent the osmotic driving force for anther dehiscence and pollen tube growth in Arabidopsis. Plant J 19 269–278 [DOI] [PubMed] [Google Scholar]
- Taylor CB (1997) Promoter fusion analysis: an insufficient measure of gene expression. Plant Cell 9 273–275 [Google Scholar]
- Teng S, Keurentjes J, Bentsink L, Koornneef M, Smeekens S (2005) Sucrose-specific induction of anthocyanin biosynthesis in Arabidopsis requires the MYB75/PAP1 gene. Plant Physiol 139 1840–1852 [DOI] [PMC free article] [PubMed] [Google Scholar]
- Ward JM, Kühn C, Tegeder M, Frommer WB (1998) Sucrose transport in higher plants. Int Rev Cytol 178 41–71 [DOI] [PubMed] [Google Scholar]
- Weise A, Barker L, Kühn C, Lalonde S, Buschmann H, Frommer WB, Ward JM (2000) A new subfamily of sucrose transporters, SUT4, with low-affinity/high-capacity localized in enucleate sieve elements of plants. Plant Cell 12 1345–1355 [DOI] [PMC free article] [PubMed] [Google Scholar]
- Williams LE, Lemoine R, Sauer N (2000) Sugar transporters in higher plants: a diversity of roles and complex regulation. Trends Plant Sci 5 283–290 [DOI] [PubMed] [Google Scholar]
- Zhou JJ, Theodoulou F, Sauer N, Sanders D, Miller AJ (1997) A kinetic model with ordered cytoplasmic dissociation for SUC1, an Arabidopsis H+/sucrose cotransporter expressed in Xenopus oocytes. J Membr Biol 159 113–125 [DOI] [PubMed] [Google Scholar]


