

Abstract
Information processing using biochemical circuits is essential for survival and reproduction of natural organisms. As stripped-down analogs of genetic regulatory networks in cells, we engineered artificial transcriptional networks consisting of synthetic DNA switches, regulated by RNA signals acting as transcription repressors, and two enzymes, bacteriophage T7 RNA polymerase and Escherichia coli ribonuclease H. The synthetic switch design is modular with programmable connectivity and allows dynamic control of RNA signals through enzyme-mediated production and degradation. The switches support sharp and adjustable thresholds using a competitive hybridization mechanism, allowing arbitrary analog or digital circuits to be created in principle. As an example, we constructed an in vitro bistable memory by wiring together two synthetic switches and performed a systematic quantitative characterization. Good agreement between experimental data and a simple mathematical model was obtained for switch input/output functions, phase plane trajectories, and the bifurcation diagram for bistability. Construction of larger synthetic circuits provides a unique opportunity for evaluating model inference, prediction, and design of complex biochemical systems and could be used to control nanoscale devices and artificial cells.
Keywords: bistability, ultrasensitivity, design principles, dynamical systems, transcription
Introduction
Cells process information for survival and reproduction using functional circuits made up of many species of interacting molecules (Hartwell et al, 1999). The reductionist approach attempts to explain the behavior of such circuits in terms of the behavior of the components. Despite many molecular components of biological organisms being identified and characterized using genetic and biochemical techniques, it is still not possible to predict system behavior except in the simplest systems. Synthetic biology provides an alternative to the study of naturally occurring systems. By constructing increasingly complex analogs of natural circuits, synthetic biology attempts to test sufficiency of mechanistic models and gain insights that observation and analysis alone do not provide (Benner and Sismour, 2005). Several synthetic networks constructed by rearranging regulatory components in a cell have been characterized (Elowitz and Leibler, 2000; Gardner et al, 2000; Becskei et al, 2001; Atkinson et al, 2003). For this type of network design to lead to an improved understanding of naturally occurring networks, detailed studies of the synthetic systems are needed (Benner and Sismour, 2005), for example, through a systematic examination of the effects of parameter variations with quantitative modeling and analysis (Ozbudak et al, 2004). However, this approach can be difficult because there are unknown and uncontrollable parameters in synthetic circuits within cells.
An in vitro reconstruction with known components offers a unique opportunity to investigate how system behavior derives from reaction mechanisms. The first nontrivial system behavior created by an in vitro chemical system was the Belousov-Zhabotinsky oscillator (Zaikin and Zhabotinsky, 1970), but it is difficult to see how these reaction mechanisms could support a wide variety of chemical logic, as is found in biochemistry. An excellent example of in vitro reconstruction using biochemical components is the cyanobacterial circadian clock, the operation of which has been shown to be independent of transcription and translation (Nakajima et al, 2005). However, operating and characterizing biochemical circuits outside the cell remains a challenge. A reconstituted cell-free transcription-translation system requires almost one hundred purified components (Shimizu et al, 2001) or poorly characterized cell extracts (Noireaux et al, 2003). A variety of interesting circuits can be constructed within cell-free transcription–translation systems (Noireaux et al, 2003; Isalan et al, 2005), but they have not yet resulted in quantitative models. Feedback circuits modeled after predator–prey dynamics have also been constructed as a much simpler in vitro system containing only three enzymes, T7 RNA polymerase, M-MLV reverse transcriptase, and Escherichia coli RNase H (Wlotzka and McCaskill, 1997; Ackermann et al, 1998), but quantitative agreement of models and experiments was not achieved, and it is unclear how to construct more complex circuits using this approach.
In order to investigate a wide range of possible circuits using a small selection of known components, we developed an experimental analog of genetic regulatory circuits that makes use of only T7 RNA polymerase (RNAP) and E. coli ribonuclease H (RNase H) in addition to synthetic DNA templates regulated by RNA transcripts. This system meets our goal of dramatically reducing the chemical complexity by removing the irrelevant genes and regulatory processes of the whole organism, which includes removing protein production and degradation machinery. Moreover, nucleic acid regulatory molecules have the advantage that the structures are well defined and that interactions governed by Watson–Crick base-pairing rules can be easily programmed, allowing for modular designs. Despite the simplicity of our system compared to previous systems (Noireaux et al, 2003; Isalan et al, 2005) that use protein signals, we have shown theoretically that arbitrary logic circuits and abstract neural network computations can be implemented (Kim et al, 2004). The weights and thresholds of corresponding neural networks are represented by continuously adjustable concentrations of DNA molecules in the in vitro circuits (Kim et al, 2004). In previous formal models that treat genetic regulatory circuits as neural networks (Mjolsness et al, 1991; Buchler et al, 2003), thresholds are encoded as binding constants of regulatory proteins and therefore tuning the circuit requires modifying protein structure through natural or directed evolution (Yokobayashi et al, 2002). There is, in fact, a growing appreciation of the diversity of roles that nucleic acids can play in regulating cell function; for instance, diverse cis and trans gene regulation by noncoding RNA molecules such as microRNAs (Carrington and Ambros, 2003) and antisense RNAs (Kramer et al, 2003) have been characterized in natural organisms and engineered RNA regulatory molecules have been used for control of translation (Isaacs et al, 2004; Bayer and Smolke, 2005).
In this study, we address the following questions using an in vitro transcriptional network. First, we ask whether crisp regulation of transcription can be achieved with nucleic acid regulatory molecules. We demonstrate a design for switches and feedforward circuits that exhibit sigmoidal transfer curves with sharp and adjustable thresholds. The threshold is established by a competitive hybridization mechanism analogous to the ‘inhibitor ultrasensitivity' mechanism (Ferrell, 1996). Second, we demonstrate that our synthetic switches are modular and programmable. To this end, we construct a mutually inhibitory feedback circuit by linking two previously characterized switches. The mutually inhibitory circuit shows bistability, as expected based on the transfer curves of the feedforward circuits. Third, we achieve dynamic behavior and steady-states in our in vitro circuit by balancing enzyme-controlled production and degradation mechanisms. This contrasts with many previous studies (Atkinson et al, 2003; Rosenfeld et al, 2005) that treat degradation and dilution of signal molecules (as occurs in exponentially growing cells and in chemostats) as a first-order process. We find that without dilution, degradation by RNase H helps establish steady-state switch activities in feedforward circuits and allows reactivation of switches in feedback circuits. However, circuits often accumulate RNA transcripts and non-degradable intermediates. Achieving steady-state RNA signal levels, with complete clean-up of RNA signals to single nucleotides, would require additional RNases with different substrate specificities. Surprisingly, the saturation of RNase degradation capacity is an important determinant of multistability in our mutually inhibitory circuit. Finally, as a test of our understanding of reaction mechanisms, we present a simple mathematical model to explain various aspects of the circuit behavior (Box 1). This model reproduces the transfer curves for individual switches, the bifurcation diagram for the bistable circuit, and the phase plane dynamics for the bistable circuit with a single parameter set.
Results
The synthetic DNA template design is modular with easily programmable connectivity dictated by Watson–Crick base-pairing rules. The regulatory domain is upstream of the promoter region; the output domain is downstream of the promoter region. This separation of domains allows us to design DNA templates that have any desired connectivity. Regulated DNA templates are called switches (‘Sw'), whereas unregulated DNA templates are called sources (‘So'). A switch can assume two different conformations with different transcription efficiency: ON or OFF (Figure 1A). The OFF state of the switch consists of a double-stranded DNA template (‘T') with a partially single-stranded (ss) and thus incomplete promoter region. Similar templates are known to transcribe poorly (Martin and Coleman, 1987). The switch is turned on by the addition of an ssDNA activator (‘A') that completes the promoter region. Templates with nicked promoters (‘T·A') have been found to transcribe well, approximately half as efficiently as fully double-stranded sources (data not shown, also cf. Jiang et al, 2001). The activator contains a ‘toehold', a single-stranded overhang beyond the helical domain it forms with the DNA template, where an inhibitor can bind to initiate a toehold-mediated strand displacement reaction (Yurke and Mills, 2003). Thus, the switch can be turned off upon addition of an inhibitor strand (either ssRNA, ‘I', or ssDNA, ‘dI'). An ON state source template has a complete promoter sequence with a nick and an OFF-state source template is missing five bases of the promoter sequence on the template side. Source templates do not interact with activators, due to the hairpin stem permanently covering the branch migration sequence, and therefore maintain their transcription efficiency in the presence of inhibitors. Due to the identical structures in the promoter region (17 bases colored blue in Figure 1A), an ON or OFF source has the same transcription speed as an ON or OFF switch with less than 10% deviation (data not shown). In a typical reaction network, the RNA inhibitor strands will be produced by RNAP from upstream templates using NTP as fuel and will be degraded by RNase H.
Figure 1.

Design of synthetic switches and circuits. (A) Design of DNA sequences and reaction mechanisms. Each sequence subdomain is color-coded with its length in nucleotides written above it. For example, 62 base long inhibitor I2 consists of five parts: the spacer sequence including the 6 base transcription initiation sequence (11 bases, green), the toehold-binding sequence (8 bases, light blue), the branch migration sequence (22 bases, red), the 5′ end of the promoter sequence (5 bases, blue) and the 3′ end hairpin structure (16 bases, brown). Switch templates have two distinct states, ON or OFF, with different transcription speed. The ON-state switch template (T·A complex) has a complete promoter sequence (17 bases, blue) with a nick, while the OFF-state switch template (T) is missing 5 bases of the promoter sequence on the template side. The two single strands that form the switch templates are the longer nontemplate side strand, T-nt, and the shorter template side strand, T-t (Materials and methods). The T-nt strands are labeled with fluorophores (pink circle, Texas Red; yellow circle, TAMRA) and A strands are labeled with quenchers (black circles). Thus, the state of each switch can be monitored by measuring the fluorescence quenching efficiency (Marras et al, 2002). The ON-state source template has a complete promoter sequence with a nick (like the ON-state switch) and the OFF-state source template is missing five bases of the promoter sequence on the template side (like the OFF-state switch). Unlike the switch templates, source templates do not interact with activators, due to the hairpin stem permanently covering the branch migration sequence, and therefore maintain their transcription efficiency in the presence of inhibitors. The source activity can be controlled by preparing a mixture of ON and OFF source templates. The two single strands that form the source templates are the longer nontemplate side strand, So-nt (ON or OFF), and the shorter template side strand, T-t; the template side strands are the same for the switch and source templates that encode the same outputs (Materials and methods). For any given transcriptional circuit, we use either source template Soj (with some desired mixture of ON and OFF templates) or switch template Swji to produce RNA inhibitor Ij. RNAP produces RNA inhibitors from DNA templates, while RNase H degrades RNA inhibitors bound to DNA activators. Detailed reaction mechanisms are listed in Box 1. (B) Two feedforward circuits where a source Soj controls a switch Swij by supplying inhibitor Ij and a bistable system where two switches, Sw12 and Sw21, inhibit each other.
An important goal for our circuits is to obtain switches with an ultrasensitive response, that is, a sharp threshold. Several alternative mechanisms can give rise to the ultrasensitive response in biological circuits, for example, cooperative binding of regulatory proteins and multistep phosphorylation of target protein by kinases (Ferrell, 1996). We use competitive binding of nucleic acid species rather than cooperative binding to achieve ultrasensitivity. Our approach is closely related to ‘inhibitor ultrasensitivity', where a stoichiometric inhibitor to the activating enzyme is used. Similar mechanisms have been suggested for regulation of mitosis (Thron, 1994) and sporulation (Voigt et al, 2005). The threshold in our transcriptional circuit derives from three types of strong DNA and RNA hybridization reactions (Box 1), which we call activation, annihilation, and inhibition. An activator binds to an OFF switch template to turn the switch on (activation); an activator binds to an inhibitor and is not available for the switch template (annihilation); an inhibitor displaces an activator from an ON switch template, the T·A complex, to turn the switch off (inhibition). The key requirements for the inhibition mechanism are that the activator-inhibitor binding is thermodynamically more favorable than the template-activator binding, and that there is a fast kinetic pathway to the lowest energy state (in our case, toehold-mediated strand displacement by branch migration; Yurke and Mills, 2003). Since the activator and inhibitor annihilate each other, the difference of total activator and inhibitor concentrations is the most important determinant of the state of switch: an excess of inhibitor will turn the switch off while an excess of activator will turn the switch on. All three mechanisms are needed for fast switch response.
Sequences of the synthetic DNA templates were chosen to minimize alternative folding (Flamm et al, 2000) and spurious interactions (Seeman, 1982). Various domain lengths have been experimentally tested for functionality (Figure 1A); for example, the binding domains of an OFF switch template to an activator (27 bases) and of an activator to an inhibitor (35 bases) are long enough to ensure the activation and annihilation mechanisms, while the toehold of an activator (8 bases) is long enough to facilitate the inhibition mechanism without being so long as to reduce ON-state transcription efficiency (see Supplementary information). The 3′-end hairpin structure (16 bases) increases copy number and also decreases self-coded extension of RNA transcripts by RNAP (Triana-Alonso et al, 1995). An OFF switch template has only five bases missing in the promoter region, which permits leaky expression. However, increasing the extent of activator binding to the promoter domain can cause a spurious binding between non-matching activator and template pairs (see Supplementary information). The specific, strong, and repeatable hybridization of template–activator pairs and activator–inhibitor pairs has been confirmed (Supplementary Figures S1 and S2).
To determine whether the proposed hybridization mechanism leads to a sharp threshold, the transfer curves of individual switches were measured with the total concentration of DNA inhibitors as inputs (Figure 2B and C). For the total concentration of certain species, we consider both isolated species and complexes containing that species. Thus, for the DNA inhibitor, [dItot]=[dI]+[dI·A]. The DNA inhibitor is a permanent input signal because it is not degraded by RNase H. The switch activity, defined as the concentration of ON switch template, [T·A], can be measured in real-time using fluorescence: the OFF switch template T is labeled with a fluorophore and the activator A is labeled with a quencher such that the fluorescence of the OFF switch T is high but the fluorescence of the ON switch T·A is low due to fluorescence quenching (Marras et al, 2002). The time course of Sw21 inhibited by DNA inhibitor dI1 with 1 μM activator A1 is shown (Figure 2A). The fluorescence signal is stable in the presence of enzymes. When the DNA inhibitor dI1 input is less than 0.9 μM, the fluorescence signal remains low. On the other hand, the fluorescence signal quickly reaches its maximal value upon addition of more than 1 μM dI1 input. The transfer curves were constructed by normalizing the fluorescence signal to obtain the proportion of switches in the OFF state. We have shown that the correspondence of normalized fluorescence to the switch state is quantitative, as discussed below. The role of the activator as an adjustable threshold can be seen in the transfer curves of switch Sw21: the switching thresholds depend on the total concentration of activator A1 (Figure 2B). To test programmability of our synthetic switch design, we swapped the input and output domains of switch Sw21 to create the switch Sw12. The response of switch Sw12 is similar to that of switch Sw21, flat at low and high levels of DNA inhibitor dI2, yet sensitive when the total concentration of DNA inhibitor dI2 is close to the total concentration of activator A2, 1 μM (Figure 2C).
Figure 2.

Characterization of switches and feedforward circuits. The total concentration of the source So1 or the switch template T12 is 100 nM, and the total concentration of the source So2 or the switch template T21 is 75 nM. Downstream activator concentration is 1 μM. The ratio of maximum to minimum fluorescence signals before normalization is greater than 10 for both TAMRA and Texas Red dyes. (A) Normalized fluorescence time courses for the DNA inhibitor dI1 inhibiting switch Sw21 with the total concentration of activator A1 at 1 μM. The enzymes are added at 10 min and different amounts of DNA inhibitor dI1 inputs are added at 35 min. Additional DNA inhibitor dI1 is added at 4 h to generate maximal fluorescence levels. The concentrations of DNA inhibitor dI1 inputs are marked on the time courses. (B, C) The normalized fluorescence signals immediately prior to the addition of excess dI as shown in (A) are used for the construction of transfer curves. Experimental data points are plotted as circles and the model fits (see Box 1 for model and parameters) are plotted as lines. (B) The transfer curves of switch Sw21 with the total concentration of DNA inhibitor dI1 as inputs. (C) The transfer curve of switch Sw12 with the total concentration of DNA inhibitor dI2 as inputs. (D) Normalized fluorescence time courses for the feedforward circuit of source So1 inhibiting switch Sw21 with the total concentration of activator A1 at 1 μM. The enzymes are added at 20 min and excess DNA inhibitor dI1 is added at 210 min to generate maximal fluorescence levels. The concentrations of ON state source So1 are marked on the time courses. (E, F) The normalized fluorescence signals immediately prior to the addition of excess dI as shown in (D) are used for the construction of transfer curves. Experimental data points are plotted as circles and the model fits are plotted as lines. (E) The transfer curves of switch Sw21 with the source So1 activity as inputs. (F) The transfer curve of switch Sw12 with the source So2 activity as inputs.
This tunable sigmoidal curve has the piecewise-linear shape predicted by the model (Box 1), which uses a single parameter set for all model fitting results shown in this paper. To compare the sharpness of the transition achieved by our competitive inhibition mechanism with that of other biological mechanisms such as binding cooperativity, the transfer curves were also fit to the following Hill equation:
![]()
where ymin is the minimum switch activity, ymax is the maximum switch activity, x is the total concentration of DNA inhibitor, n is the Hill coefficient, and K is the total concentration of DNA inhibitor required for half repression. The Hill coefficient for the switch Sw12 transfer curve is 14.1, and those for the switch Sw21 transfer curves are 18.6, 30.0, and 32.9, respectively. The transfer curve of the switch Sw12 is not as sharp as the transfer curve of the switch Sw21, possibly due to an unexpected secondary structure in activator A2 or in the single-stranded region of switch template T12, which could interfere with the binding of A2 to T12. Nonetheless, the Hill coefficients are much higher than most biological repressors and are adjustable by changing the total concentration of activators. We can understand the change of Hill coefficients as follows: increasing total activator concentration increases the threshold, that is, K, yet the switching width (in terms of DNA inhibitor concentration change) remains constant because it depends on the total concentration of switch template (Box 1). Consequently, the switching width becomes narrower relative to the threshold as we increase the threshold, resulting in a higher Hill coefficient, n. The change of sharpness is clear when the inputs are scaled by the half-repression points (Supplementary Figure S3A).
Next, to determine whether the switches also have a sharp threshold with actively maintained RNA input signals, the transfer curves of switch Swij driven by an RNA inhibitor Ij were measured (Figure 2E and F). Unlike DNA inhibitors that serve as permanent input signals, the RNA inhibitors are continuously being produced and degraded by the enzymes. This dynamic control of regulatory signals is necessary to achieve dynamic behavior within circuits where individual switches change their states in response to inputs and states of other switches. In our experiments, an upstream source Soj is used to achieve a steady-state RNA inhibitor Ij level and the source Soj activity is controlled by preparing a mixture of ON and OFF source templates. We keep the total concentration of ON and OFF source templates the same, while tuning the source activity, to simulate the continuous tuning of an upstream switch activity. Note that when source template concentrations are sufficiently high, RNA inhibitor production by RNAP will exceed RNase H's capacity for degradation, and RNA inhibitor levels will increase without bound rather than achieve a steady state. In such cases, however, switch activity nonetheless approaches an asymptotic ‘steady-state' value. An additional complicating factor is that over the course of several hours, both RNAP and RNase H activities decrease due to depletion of NTPs, change of buffer composition, and other effects, thus altering the instantaneous ‘steady-state' level. In this paper, we use the term in this loose sense, acknowledging such effects.
The time course of Sw21 inhibited by So1 with 1 μM activator A1 is shown (Figure 2D). Unlike the dI-triggered switch state changes, here the fluorescence signal changes do not occur immediately after enzyme addition because the production of RNA inhibitor I1 takes time and inhibitor I1 is mostly consumed by the free activator A1 initially. For low source activities, no detectable fluorescence change ensued. As the source So1 activity increases, the steady-state concentration of inhibitor I1 increases and turns the switch Sw21 off. As with the DNA input, thresholds are determined by the total concentration of activator; three thresholds were demonstrated for switch Sw21 (Figure 2E). The transitions are not as sharp as with DNA inhibitors due to the constant turnover of RNA inhibitors by RNase H. This breakdown pathway of the activator–inhibitor complex partially reverses the annihilation and inhibition mechanisms necessary to establish a sharp transition (Box 1). The transfer curves were fit to the Hill equation (equation (1)) where x is the upstream source activity, and K is the upstream source activity required for half repression. The Hill coefficient for the switch Sw12 transfer curve is 5.17, and those for the switch Sw21 transfer curves are 3.09, 5.40, and 5.96, respectively. Although lower than for DNA inhibitors, the Hill coefficients are comparable to that of a two-stage synthetic biological repressor cascade (Hooshangi et al, 2005). The change of sharpness is clear when the inputs are scaled by the half-repression points (Supplementary Figure S3B).
To confirm that the fluorescence read-out reflects the actual molecular state of the system, gel-based experiments were performed for switch Sw21 regulated by source So1 with the total concentration of activator A1 at 1 μM. In this experiment only, fluorophore-(rather than quencher-) labeled activators were used to allow identification in the gel. In the denaturing gel (Figure 3C), all DNA and RNA species migrate as single strands such that major bands can be identified based on length. We measured the total concentration of inhibitors (the sum of the concentration of isolated inhibitor, [I], and the concentration of activator-inhibitor complex, [A·I]), as a function of source So1 activity (Figure 3B). In the nondenaturing gel (Figure 3D), the concentrations of activator–inhibitor complexes (Figure 3B) and the concentration of OFF switch template, [T21], are measured as a function of source So1 activity. For the total concentration of RNA inhibitor Ij less than the total concentration of Aj, [AjIj] is the same as [Ijtot] because of the strong binding interactions of activator-inhibitor pairs. The switch states measured in the nondenaturing gel agree with the switch states measured by fluorescence quenching in the fluorometer (Figure 3A). Interestingly, we observed activator bands that migrate slower than free activators but faster than the activator–inhibitor complexes in control lanes (bracket in Figure 3D). We interpret this as activators binding to a mixture of incomplete inhibitors (abortive transcripts or incomplete degradation products; Supplementary Figure S5) shown as smearing less than 40 nucleotide long in the denaturing gel. We counted these bands as free activators and excluded incomplete inhibitor bands for our simple model. In the nondenaturing gel, we did not observe spurious binding complexes containing switch template T21, but a short-lived interaction might occur among the switch template, activators and incomplete inhibitors. From the gel data analysis, we could account for the concentrations of all the major species present in the system: [T], [T·A], [A], [A·I], and [I]. The gel data are consistent with switching behavior observed by fluorescence read-out and with the model fits (Figure 3A and B).
Figure 3.

Characterization of a feedforward circuit with gel. The feedforward circuit of source So1 inhibiting switch Sw21 is characterized with both denaturing and non-denaturing gels. The total concentration of the source is 100 nM, and the total concentration of the switch template T21 is 75 nM. The total concentrations of activator A1 and A2 are 1 μM. (A) The nondenaturing gel data (red circles) and fluorometer data (blue circles) for the switch Sw21 states are compared. The gel data are quantitated by measuring the fluorescence of the OFF switch T21 band: [T21A1]=[T21tot]−[T21]. The fluorometer data and the model fit (black line) are the same as that of blue transfer curve in Figure 2E. (B) The total concentrations of inhibitors are measured from the denaturing gel and the concentrations of activator–inhibitor complexes are measured from the nondenaturing gel. Experimental data are plotted as circles and model fits are plotted as lines. (C) Denaturing gel stained with SYBR gold. Lane 1 contains a 10-base ladder, lanes 2 through 12 contain samples from the feedforward circuit with the concentration of ON source So1 template increasing from left to right. Lane 13 contains purified inhibitors, I1 and I2. Two DNA strands, So1-nt (either ON or OFF) and T12-t, form the source So1 template (either ON or OFF), while two DNA strands, T21-nt and T21-t, form the switch template, T21. (D) For the nondenaturing gel, three distinct excitation and emission scan results are overlayed (Texas Red-labeled T21: gray; Cy5-labeled A1: cyan; and FAM-labeled A2: magenta). Individual scan results are shown in Supplementary Figure S4. Lanes 1 through 11 contain samples from the feedforward circuit with the concentration of ON source So1 template increasing from left to right. Lane 12 contains the ON switch template T21A1 and the activator A1, lane 13 contains the OFF switch template T21 and the activator–inhibitor complex A1I1, and lane 14 contains the activator–inhibitor complex A2I2 and the activator A2. The ON switch template T21A1 has low fluorescence and is not clearly identified in lanes 1 through 3 and 12, presumably due to fluorescence resonance energy transfer (Marras et al, 2002) from Texas Red on T21 to Cy5 on A1.
We further constructed a mutually inhibitory circuit (Figure 1B, bottom) where the switch Sw12 and the switch Sw21 inhibit each other. The behavior of the mutually inhibitory circuit can be understood in terms of the characterized feedforward circuits (Figure 1B, top). For the moment, consider that the mutually inhibitory circuit is essentially a two-dimensional dynamical system where the two switch activities give a complete description of the state of system because other variables, the concentrations of activators, inhibitors, and the enzyme–substrate complexes in Michaelis–Menten enzyme reactions, relax to their steady-states much more rapidly. Then, the mutually inhibitory circuit behavior can be described as (d/dt)[T12A2]=f([T21A1]) and (d/dt)[T21A1]=g([T12A2]). We replace the input source Soi activities in the transfer curves of Figure 2E and F with equivalent switch Swij activities and interpret them as the nullclines of the mutually inhibitory circuit given by f([T21A1])=0 and g([T12A2])=0 (Figure 4). The sigmoidal shape of transfer curves results in three fixed points, two stable and one unstable, to the extent that the approximations are valid. Thus, we expect that the two mutually inhibiting switches will show bistability with two stable attractors.
Figure 4.

Nullclines of the mutually inhibitory circuit as inferred from the transfer curves of feedforward circuits. It is assumed that the source Soi and the switch Swij activities are equivalent and that the steady-state behavior is achieved instantaneously. With these assumptions, the nullclines of mutually inhibitory circuit are the same as the empirical transfer curves of feedforward circuits in Figure 2E and F. Here, two blue curves of Figure 2E and F are used for the case of both activators at 1 μM. The experimental data points are plotted as squares with dotted lines drawn to guide the eye. The nullclines (d/dt [T12A2]=0 and d/dt [T21A1]=0) intersect at three points because of the sigmoidal shape. Possible vector flow directions are shown as arrows. Open circle: unstable fixed point, dark circles: stable fixed points.
Because activator concentrations set the switching thresholds, we systematically varied activator concentrations to probe the conditions for multistability and to test the robustness of our system to parameter variation. A convenient experimental way to probe for multistability is to subject the network to different initial conditions and explore whether the network gets locked in different stable expression states. We therefore started the reaction either in the presence of excess RNA inhibitor I1 (switch Sw21 OFF, switch Sw12 ON) or in the presence of excess RNA inhibitor I2 (switch Sw21 ON, switch Sw12 OFF), the expected stable attractors from Figure 4. If the mutually inhibitory circuit is bistable, the steady-state switch activities are locked in different states depending on the initial RNA inputs (Figure 5A, right), while the switch activities converge irrespective of initial RNA inputs in the monostable parameter regime (Figure 5A, left). A large region of activator parameter space displays persistent memory, bordered by monostable regions (Figure 5B and Supplementary Figure S6). In the latter cases, the switch Sw21 activity (M2), switch Sw12 activity (M1), or both switch activities (M0) were completely inhibited independent of the history. The activator concentrations can be shifted from the bistable regime to one of the monostable regimes (by way of adding DNA inhibitor dIj to eliminate activator Aj) and back to the bistable regime (by way of adding activator Aj). The circuit maintained the state acquired in the monostable parameter regime when returned to the bistable parameter regime (Supplementary Figure S7).
Figure 5.

Characterization of bistable circuit. (A) Switch activity time courses with high initial concentration of RNA inhibitor I1 (circles) or high initial concentration of RNA inhibitor I2 (lines). In the monostable case (left), the switch activities converge irrespective of the initial RNA inhibitor concentrations, while they stay apart in the bistable case (right). (B) Bifurcation diagram. Both the experiments and simulations are initiated with two switch states that are expected stable attractors if the circuit is bistable: (switch Sw21 ON, switch Sw12 OFF) and (switch Sw21 OFF, switch Sw12 ON). The model generates the following four domains. M0: both initial conditions are unstable, M1: only (switch Sw21 ON, switch Sw12 OFF) is stable, M2: only (switch Sw21 OFF, switch Sw12 ON) is stable, and B: both initial conditions are stable. Color-coded diamonds are experimentally determined stability results (Supplementary Figure S6), two of which are shown as time courses in (A). (C) Switch activity phase plane with both activators at 1 μM. Initial points are marked by rectangles and their attractors are marked by circles of the same color with black crosses inside. The black arrows indicate the direction of trajectories and diamonds are experimental data points measured at 1 min intervals with lines drawn to guide the eye. Two trajectories with the following initial conditions are highlighted: the initial concentration of RNA inhibitor I1 is 0.91 μM for both, and the initial concentration of RNA inhibitor I2 is 0.89 μM (purple), or 0.93 μM (green). Despite small difference in initial RNA inputs, the two trajectories are attracted to the opposite corners of the phase plane. (D) Model fits of the switch activity phase plane. Diamonds are simulation results of 1 min intervals as in the experiments with lines drawn to guide the eye. The black arrows indicate the direction of trajectories. The separatrix for initial conditions is generated from the model (blue line).
We singled out the case with both activators at 1 μM to probe detailed dynamics in the phase plane. By initiating the reaction with various amounts of externally supplied RNA inhibitors, we can reset the system to various locations in the phase plane. The amounts of RNA inhibitors determine the initial conditions yet do not determine multistability as shown in Figure 5A. We chose a 15% variation of RNA inhibitor concentrations spanning the high-gain region of switch. The dynamic responses of both switches are simultaneously shown as trajectories in the switch activity phase plane with arrows to indicate directions (Figure 5C) and as time courses (Supplementary Figure S8A). Both switches start by inhibiting each other and the trajectories move towards the corner where both switches are OFF. In all 12 cases, one of the switches recovers its activity and stabilizes. Two initial conditions are highlighted, where a 5% difference of RNA inhibitor I2 concentrations leads trajectories to different stable attractors on opposite corners: (switch Sw21 activity, switch Sw12 activity)=(64 nM, 3 nM) and (4 nM, 63 nM). The experimental trajectories agree with the simulation results shown as trajectories in the switch activity phase plane (Figure 5D) and as time courses (Supplementary Figure S8B). The location of two attractors (circles with crosses inside; Figure 5C), although not perfect, agrees with the location of attractors determined by the nullcline analysis (black circles; Figure 4). Some experimental trajectories cross themselves and each other, and both experimental and simulation trajectories cross the separatrix for initial switch activity constructed from the model (blue line; Figure 5D). This indicates that the state of dynamical system cannot be completely described by the switch activities alone and is influenced by unmeasured variables and possibly by unmodeled effects such as ‘bursting' enzyme kinetics (Jia and Patel, 1997; Kuzmine and Martin, 2001). Furthermore, the model does not accurately reproduce the kinetics of the system (Supplementary Figure S8B) although it gives the correct qualitative behavior. The recovery process is especially slow and incomplete for the switch Sw12, which also showed less ideal behavior in the feedforward circuit. The system could maintain its memory for up to 11 h, after which loss of NTP or loss of RNAP activity lead to decrease in inhibitor levels, turning both switches on.
Discussion
Surprisingly, controlling the degradation pathway turned out to be more difficult than controlling the production pathway. RNase H can only degrade the signal part of the transcript where hybridization to DNA activator occurs (Lima and Crooke, 1997 and Supplementary Figure S5). Thus, unlike the full-length transcripts (active signal) that turn over continuously, the shorter degradation products (inactive signal) accumulate during the circuit operation. This may help explain the slowness when switching multiple times between ON and OFF states. We have implemented the transcriptional circuit in combination with other ribonucleases to clean up inactive signals. Commercially available ribonucleases, of which we tested RNase I, A, III, and V, are endoribonucleases. Their activities quickly saturate because more RNA substrates are generated as a result of RNA substrates being cut internally. Also, they degrade long RNA substrates faster than short RNA substrates, accelerating the build-up of inactive signal. Following the observation that the degradation of RNA in E. coli is completed by the concerted action of an endoribonuclease, a processive exoribonuclease and a helicase in the degradosome (Grunberg-Manago, 1999), we tested two 3′ processive exoribonucleases. RNase R (gift of Dr Deutscher) (Cheng and Deutscher, 2002) proved to be an excellent cleaner, but it also degrades full-length transcripts, consequently lowering the switch gain. Bistability was lost when a significant amount of RNase R was used, because inhibitor I2 was a better substrate for RNase R than inhibitor I1 in competing situations. OligoRNase (gift of Dr Malhotra) (Fiedler et al, 2004) specifically degrades short single-stranded species, thus it would attack only incomplete RNA products. Unfortunately, the high NTP concentration in our transcriptional circuit inhibits the activity of oligoRNase (Datta and Niyogi, 1975). Apparently, ‘all-or-none' degradation of RNA signals would require simultaneous activity of multiple ribonucleases with different substrate specificities, a challenge for our in vitro experiments.
Reproducing the bifurcation diagram (Figure 5B) with our model is a stringent test on the validity of the model over a wide range of parameters, and demonstrates that Michaelis–Menten saturation is essential to the circuit behavior. When the circuit is modeled with first-order enzyme reactions, it is bistable at low levels of activators and monostable above a certain level of activators, quite contrary to experimental observation. Because in a first-order model the degradation rates of inhibitors in activator–inhibitor complexes increase linearly with the total concentration of activators, at high activator levels, the degradation rates exceed the production rates of inhibitors and repression of the target switch is lost. However, with Michaelis–Menten enzyme reaction equations, the degradation capacity of RNase H is shared by two activator–inhibitor substrates. This means that the relative abundance of an activator–inhibitor complex determines the probability of the activator–inhibitor complex being associated with RNase H, which in turn determines the degradation rate of inhibitor within that complex. Consequently, the bistability is maintained if the degradation rates of both inhibitors are relatively balanced despite high activator concentrations.
For engineering purposes, switches are most suitable when they contribute independently to the whole circuit. However, global coupling of rate equations through enzyme saturation can lead to global feedback regulation in the Michaelis–Menten enzyme reactions (Ackermann et al, 1998; Noireaux et al, 2003; Kim et al, 2004). First-order enzyme reactions are justified in the following cases. First, when the substrate concentrations are well below the Michaelis constants of enzymes: the enzyme reactions are limited by substrate, and consequently become first-order. However, both RNAP and RNase H have low Michaelis constants such that slow operation limited by DNA and RNA hybridization speed is inevitable in this parameter regime. Second, when there are many competing and compensatory species: the enzyme is at a similar saturation level even if a few substrate concentrations fluctuate, thus free enzyme concentration would be roughly a constant. This might be true for genetic regulatory circuits in a cell (McClure, 1985), but not for our bistable circuit with only four substrates for RNAP and two for RNase H. The concentration change in one substrate has a significant impact on the effective enzyme rate on another substrate.
Our circuit construction is much simpler than other approaches using protein signals (Noireaux et al, 2003; Isalan et al, 2005), yet general in computational power (Kim et al, 2004) and quantitatively explained better than other nucleic-acid based feedback circuits (Wlotzka and McCaskill, 1997; Ackermann et al, 1998), although accurately predicting kinetics rather than steady-states still remains a challenge. We did not model known enzyme activities such as ‘bursting' (Jia and Patel, 1997; Kuzmine and Martin, 2001) or side reactions (Cazenave and Uhlenbeck, 1994; Zaher and Unrau, 2004). Nonetheless, the characterization of feedforward circuits was sufficient to predict bistability in our feedback circuit, attesting modularity and programmability of the components. Thus, the synthetic switches in principle can be assembled to implement different logical networks with increasing complexity, offering a testbed for probing the design space of biochemical networks. For example, systematic exploration of parameter space in small feedback circuits and feedforward circuits, such as alternative implementations of oscillators and cascades, could elucidate principles for biochemical circuit design. A theoretical correspondence to neural network architecture would allow implementing networks of arbitrary complexity (Hopfield, 1984). In vitro transcriptional circuits are suitable both for studying continuous mass action dynamics and, in principle, stochastic dynamics in small volumes (McAdams and Arkin, 1997). Because of its simplicity, the characterization of noise source and propagation in small biochemical circuits should be facilitated. As discussed in Ackermann et al (1998), dead-end side reactions can be important in in vitro systems that lack sophisticated control mechanisms found in the cell. Some of the known side reactions can be suppressed by experimental design, as in this work, and other constraints such as the exhaust of fuel (Klungsøyr et al, 1968) and build-up of degradation products could be relaxed in a chemostat (Atkinson et al, 2003), a dialysis bag (Madin et al, 2000), or vesicles (Noireaux and Libchaber, 2004). The in vitro transcriptional circuit could be generalized to utilize active RNA signals (such as aptamers, ribozymes, and riboswitches (Mandal and Breaker, 2004)) and could provide logical control of nano-scale devices (Dittmer and Simmel, 2004) and artificial cells (Noireaux and Libchaber, 2004). Although the current synthetic switch design is not suitable for in vivo implementation, the in vitro transcriptional circuit can serve as a tool for characterizing various biochemical circuit designs and studying generic problems such as composability, performance, robustness, and efficiency.
Materials and methods
DNA oligonucleotides and enzymes
The sequences of all DNA molecules and expected RNA transcripts were chosen to minimize the occurrence of alternative secondary structures, checked by the Vienna group's DNA and RNA folding program (Flamm et al, 2000). All DNA oligonucleotides were purchased (Integrated DNA Technologies, Coralville, IA). T21-nt is labeled with Texas Red at the 5′ end, T12-nt is labeled with TAMRA at the 5′ end, A1 is labeled with Cy5 or Blackhole Quencher-2 at the 3′ end, and A2 is labeled with FAM or Blackhole Quencher-2 at the 3′ end. The T7 RNA polymerase (enzyme mix), transcription buffer, and NTP were purchased as part of the T7 Megashortscript kit (Ambion, Austin, TX; #1354). DNase I, RNase H, A, I, and V (Ambion; #1906, #2293, #2270, #2294, and #2275) and RNase III (Epicenter, Madison, WI; #RN02950) were purchased. RNase R was a gift from Dr Deutscher and OligoRNase was a gift from Dr Malhotra, both at the University of Miami School of Medicine.
Transcription
Switch templates (T-nt and T-t strands) or source templates (So-ON/OFF-nt and T-t strands) were annealed with 10% (v/v) 10 × transcription buffer from 90 to 37°C over 1 h at five times the final concentration used. To the annealed templates, activators and DNA or RNA inhibitors from a high concentration stock (∼50 μM), 7.5 mM each NTP, 8% (v/v) 10 × transcription buffer, 3% (v/v) T7 RNA polymerase, and 0.35% (v/v) E. coli RNase H were added. Transcription reactions for spectrofluorometer experiments were prepared as a total volume of 70 μl. Transcription reactions for gel studies were prepared as a total volume of 50 μl and were stopped by phenol–chloroform extraction. For the purification of RNA inhibitors, I1 and I2, the full-length template side strands (the complement of T-nt rather than T-t) were used to prepare fully duplex DNA templates. The transcription reaction was prepared as a total volume of 60 μL with 0.2 μM fully duplex DNA templates. The transcription condition was the same as above except that 20% (v/v) T7 RNA polymerase was used and RNase H was omitted. After 6-h incubation at 37°C, the reaction mixture was treated with 2.5 μl DNase I for 30 min to remove DNA templates and stopped by phenol–chloroform extraction. The reaction mixture was run on 8% denaturing gel, RNA inhibitor bands were excised and eluted from gel by the crush-and-soak method and ethanol precipitated.
Data acquisition
For spectrofluorometer experiments, excitation and emission for TAMRA-labeled T12 were at 559 and 580 nm, while excitation and emission for Texas Red-labeled T21 were at 597 and 615 nm. The fluorescence was recorded every minute using a SPEX Fluorolog-3 (Jobin Yvon, Edison, NJ) and converted to switch activity by normalizing against minimum fluorescence (measured before the addition of enzymes with excess quencher-labeled activators) and maximum fluorescence (measured at the end of reaction with excess DNA inhibitors to displace activators). Denaturing polyacrylamide gels (8% 19:1 acrylamide:bis and 7 M urea in TBE buffer) were allowed to run for 50 min with 10 V/cm at 65°C in TBE buffer (100 mM Tris, 90 mM boric acid, 1 mM EDTA). The 10-base DNA ladder (Invitrogen, Carlsbad, CA; #10821–015) was used in the control lane and the denaturing gel was stained with SYBR gold (Molecular Probes, Eugene, OR; #S-11494) for quantitation. The nondenaturing gels (10% 19:1 acrylamide:bis in TAE buffer) were allowed to run for 100 min with 13 V/cm at 35°C in TAE buffer containing 12.5 mM Mg2+ (40 mM Tris–Acetate, 1 mM EDTA, 12.5 mM Mg-Acetate, pH 8.3). The gel data was quantitated using the Molecular imager FX (Biorad, Hercules, CA). The total concentrations of inhibitors in the denaturing gel were measured with respect to 1 μM purified RNA inhibitors run in a control lane. The concentrations of labeled species in the nondenaturing gel were measured with respect to the maximum fluorescence of the corresponding bands.
Hill coefficients
The transfer curves of single switches and feedforward circuits were fit to the Hill equation (equation (1)). The best parameter for the Hill equation was determined by a linear regression of log–log plots using MATLAB (The MathWorks).
Model simulation
The kinetic simulations and parameter fittings were implemented in MATLAB. Differential equations were solved using the ode23s routine, while mean squared deviation of model fits to experimental data was minimized using the fmincon routine. During the optimization fit, each parameter was constrained within a plausible range spanning about two orders of magnitude. Other constraints were that KM,ON must be smaller than KM,OFF and that kTAI must not be faster than kAI, since the inhibition mechanism involves a branch migration step in addition to simple hybridization. Two parameters were at the limit of range after fitting: KM,ON,12 and KM,H,2. The transfer curves and the time courses of the phase plane and bifurcation diagram experiments were used for parameter fitting. Three additional parameters were required to fit the whole data set simultaneously: Rv, Rhv, and Dv. Separate data sets of transfer curves, phase plane trajectories, or bifurcation diagram trajectories fit well without these additional parameters. Rv and Rhv indicate the relative activities of RNAP and RNase H (respectively) for two batches of enzymes; one batch was used for the switch and feedforward circuit characterization, while the other batch was used for the bistable circuit experiments. For the bistable circuit, we used [RNAPtot]=30 nM and [RNase Htot]=4.4 nM, while for the feedforward circuits, we used [RNAPtot]=Rv*30 nM and [RNase Htot]=Rhv*4.4 nM. To account for sample loss due to additional manipulations during sample preparation for the bifurcation diagram measurements, we included a parameter Dv that indicates the remaining fraction of DNA template for switch Sw21. Thus, for the bifurcation diagram, we used [T21tot]=Dv*75 nM in the simulation.
DNA sequences
So2ON-nt (122-mer), 5′-TATTAGTGTGTAGTAGTAGTTCAAAAGAACTA CTACTACACACTAATACGACTCACTATAGGGAGAA GGAGAGGCGAAGATTGAGGTAAGAAAGGTAAGGAT AATACTGACAAAGTCAGAAA-3′.
So2OFF-nt (117-mer), 5′-GTGTGTAGTAGTAGTTCAAAAGAACTACTACTA CACACTAATACGACTCACTATAGGGAGAAGGAGAG GCGAAGATTGAGGTAAGAAAGGTAAGGATAATACT GACAAAGTCAGAAA-3′.
T21-nt (101-mer), 5′-CTAATGAACTACTACTACACACTAATACGACT CACTATAGGGAGAAGGAGAGGCGAAGATTGAGGTA AGAAAGGTAAGGATAATACTGACAAAGTCAGAAA- 3′.
T21-t (74-mer), 5′-TTTCTGACTTTGTCAGTATTATCCTTACCTTT CTTACCTCAATCTTCGCCTCTCCTTCTCCCTATAG TGAGTCG-3′.
A1 (35-mer), 5′-TATTAGTGTGTAGTAGTAGTTCATTAGTGTCGTTC3′. So1ON-nt (127-mer), 5′-TATTATCCTTACCTTTCTTACCAAAAGGTAAGA AAGGTAAGGATAATACGACTCACTATAGGGAGAAA CAAAGAACGAACGACACTAATGAACTACTACTACA CACTAATACTGACAAAGTCAGAAA-3′.
So1OFF-nt (122-mer), 5′-TCCTTACCTTTCTTACCAAAAGGTAAGAAAGG TAAGGATAATACGACTCACTATAGGGAGAAACAAA GAACGAACGACACTAATGAACTACTACTACACACT AATACTGACAAAGTCAGAAA-3′.
T12-nt (106-mer), 5′-ATTGAGGTAAGAAAGGTAAGGATAATACGACTCAC TATAGGGAGAAACAAAGAACGAACGACACTAATGA ACTACTACTACAC-ACTAATACTGACAAAGTCAGA AA-3′.
T12-t (79-mer), 5′-TTTCTGACTTTGTCAGTATTAGTGTGTAGTAGT AGTTCATTAGTGTCGTTCGTTCTTTGTTTCTCCCT ATAGTGAGTCG-3′.
A2 (35-mer), 5′-TATTATCCTTACCTTTCTTACCTCAATCTTCG CCT-3′.
Model equations.
We present a simple model for DNA and RNA hybridization reactions, branch migration reactions, and Michaelis–Menten enzyme reactions in the transcriptional circuit: (i,j)∈{(1,2),(2,1)}.
DNA/RNA hybridization and branch migration reactions

The superscript tot indicates that all complexes containing that species are considered, for example, [Tijtot]=[Tij]+[TijAj] and [Ajtot]=[Aj]+[TijAj]+[AjIj]. The DNA/RNA hybridization reactions lead to the above transfer curve with the total concentration of Ij as an input and the concentration of active switch TijAj as an output. (1) [Ijtot]<[Ajtot]−[Tijtot], the inhibitor is consumed upon binding to free activator and does not inhibit the switch. (2) [Ajtot]−[Tijtot]<[Ijtot]<[Ajtot], the inhibitor is enough to consume all free activator and strips off activator bound to the switch stoichiometrically. (3) [Ijtot]>[Ajtot], the inhibitor consumes all activator, free or bound to the switch, and the switch is completely OFF.
Michaelis–Menten enzyme reactions
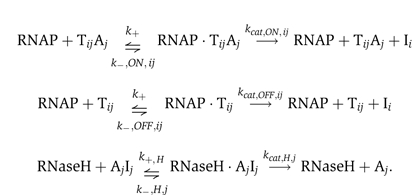
We do not consider side reactions or incomplete production and degradation products. The Michaelis–Menten enzyme reactions are further simplified by the steady-state assumption for the enzyme–substrate complexes. Since k+'s are presumed to be fast, we express the available enzyme concentrations using the standard steady-state derivation:
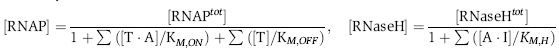
where the Michaelis constants are calculated as KM=(k−+kcat)/(k+) to determine the affinity of substrates to the enzymes. From mass balance, [Tijtot] and [Ajtot] are preserved such that [TijAj] and [AjIj] can be calculated from [Tij] and [Aj], under the assumption that the enzyme bound complexes are negligible, which is approximately valid because enzyme concentrations are low compared to substrate concentrations. Thus, the dynamics of each switch is described by the following three ordinary differential equations:

In addition to the 18 rate parameters mentioned above, three additional parameters were required to fit the whole data set simultaneously: Rv, Rhv, and Dv (Materials and methods). These parameters are not unique; similar fits can be achieved with some parameters changing by more than a factor of 10 when appropriate trade-offs are made. However, our choice of parameters shows that the model we present here is quantitatively plausible. For comparison, the parameter values and enzyme constants from other biochemical studies are listed below. The T7 RNA polymerase parameters were measured on synthetic DNA templates that have a complete promoter sequence (different from our ON state template by a nick at −12) or a promoter sequence with five bases missing on the template side (identical to our OFF state template) (Martin and Coleman, 1987). Higher KM for our ON state template may be attributed to the presence of nick. Because the transcript was very short (5 bases) in Martin and Coleman (1987), only the initiation rate constant was measured as kcat. The initiation rate was 30 times faster than the steady-state transcription rate (‘bursting') in another study (Jia and Patel, 1997), which may explain our small kcat values. The RNase H parameters were measured on RNA–DNA hybrid stems of molecular beacons (Rizzo et al, 2002). Since our substrates (activator–inhibitor complexes) are longer than those of Rizzo et al (2002), slower kcat's are plausible. Thus, our enzyme parameters are reasonable compared to other biochemical studies. Hybridization rate constants (kTA, kAI, kTAI) are expected to be on the order of 105/M/s in the absence of enzymes; in our fits, kTA is consistently slow, suggesting that enzyme binding or interaction with degradation products is interfering in the reaction.

Supplementary Material
Supplementary Text
Acknowledgments
We thank Y Zuo, ZF Cheng, A Malhotra, and MP Deutscher for their kind gift of RNases; KL Ho, C Wierzynski, D Stick, RM Murray, and CDS 273 students for helpful discussion on modeling; DY Zhang, S Mohanty, PWK Rothemund, G Seelig, JJ Hopfield, S Leibler, and B Yurke for discussion. Supported by ONR YIP Award No. N000140110813 and NSF ITR Award No. 0113443 to E Winfree and NSF NIRT Award No. 0103002 to N Seeman.
References
- Ackermann J, Wlotzka B, McCaskill JS (1998) In vitro DNA-based predator–prey system with oscillatory kinetics. Bull Math Biol 60: 329–353 [Google Scholar]
- Atkinson MR, Savageau MA, Myers JT, Ninfa AJ (2003) Development of genetic circuitry exhibiting toggle switch or oscillatory behavior in Escherichia coli. Cell 113: 597–607 [DOI] [PubMed] [Google Scholar]
- Bayer TS, Smolke CD (2005) Programmable ligand-controlled riboregulators of eukaryotic gene expression. Nat Biotech 23: 337–343 [DOI] [PubMed] [Google Scholar]
- Becskei A, Seraphin B, Serrano L (2001) Positive feedback in eukaryotic gene networks: cell differentiation by graded to binary response conversion. EMBO J 20: 2528–2535 [DOI] [PMC free article] [PubMed] [Google Scholar]
- Benner SA, Sismour AM (2005) Synthetic biology. Nat Rev Genet 6: 533–543 [DOI] [PMC free article] [PubMed] [Google Scholar]
- Buchler NE, Gerland U, Hwa T (2003) On schemes of combinatorial transcription logic. Proc Natl Acad Sci USA 100: 5136–5141 [DOI] [PMC free article] [PubMed] [Google Scholar]
- Carrington JC, Ambros V (2003) Role of microRNAs in plant and animal development. Science 301: 336–338 [DOI] [PubMed] [Google Scholar]
- Cazenave C, Uhlenbeck OC (1994) RNA template-directed RNA synthesis by T7 RNA polymerase. Proc Natl Acad Sci 91: 6972–6976 [DOI] [PMC free article] [PubMed] [Google Scholar]
- Cheng Z-F, Deutscher MP (2002) Purification and characterization of the Escherichia coli exoribonuclease RNase R. J Biol Chem 277: 21624–21629 [DOI] [PubMed] [Google Scholar]
- Datta AK, Niyogi SK (1975) A novel oligoribonuclease of Escherichia coli. J Biol Chem 250: 7313–7319 [PubMed] [Google Scholar]
- Dittmer WU, Simmel FC (2004) Transcriptional control of DNA-based nanomachines. Nano Lett 4: 689–691 [Google Scholar]
- Elowitz MB, Leibler S (2000) A synthetic oscillatory network of transcriptional regulators. Nature 403: 335–338 [DOI] [PubMed] [Google Scholar]
- Ferrell JE Jr (1996) Tripping the switch fantastic: how a protein kinase cascade can convert graded inputs into switch-like outputs. Trends Biochem Sci 21: 460–466 [DOI] [PubMed] [Google Scholar]
- Fiedler TJ, Vincent HA, Zuo Y, Gavrialov O, Malhotra A (2004) Purification and crystallization of Escherichia coli oligoribonuclease. Acta Crystallogr D 60: 736–739 [DOI] [PubMed] [Google Scholar]
- Flamm C, Fontana W, Hofacker I, Schuster P (2000) RNA folding at elementary step resolution. RNA 6: 325–338 [DOI] [PMC free article] [PubMed] [Google Scholar]
- Gardner TS, Cantor CR, Collins JJ (2000) Construction of a genetic toggle switch in Escherichia coli. Nature 403: 339–342 [DOI] [PubMed] [Google Scholar]
- Grunberg-Manago M (1999) Messenger RNA stability and its role in control of gene expression in bacteria and phages. Annu Rev Genet 33: 193–227 [DOI] [PubMed] [Google Scholar]
- Hartwell LH, Hopfield JJ, Leibler S, Murray AW (1999) From molecular to modular cell biology. Nature 402: C47–C52 [DOI] [PubMed] [Google Scholar]
- Hooshangi S, Thiberge S, Weiss R (2005) Ultrasensitivity and noise propagation in a synthetic transcriptional cascade. Proc Natl Acad Sci USA 102: 3581–3586 [DOI] [PMC free article] [PubMed] [Google Scholar]
- Hopfield JJ (1984) Neurons with graded response have collective computational properties like those of two-state neurons. Proc Natl Acad Sci USA 81: 3088–3092 [DOI] [PMC free article] [PubMed] [Google Scholar]
- Isaacs FJ, Dwyer DJ, Ding C, Pervouchine DD, Cantor CR, Collins JJ (2004) Engineered riboregulators enable post-transcriptional control of gene expression. Nat Biotech 22: 841–847 [DOI] [PubMed] [Google Scholar]
- Isalan M, Lemerle C, Serrano L (2005) Engineering gene networks to emulate Drosophila embryonic pattern formation. PLoS Biol 3: e64. [DOI] [PMC free article] [PubMed] [Google Scholar]
- Jia Y, Patel SS (1997) Kinetic mechanism of transcription initiaion by bacteriophage T7 RNA polymerase. Biochemistry 36: 4223–4232 [DOI] [PubMed] [Google Scholar]
- Jiang M, Rong M, Martin C, McAllister WT (2001) Interrupting the template strand of the T7 promoter facilitates translocation of the DNA during initiation, reducing transcript slippage and the release of abortive products. J Mol Biol 310: 509–522 [DOI] [PubMed] [Google Scholar]
- Kim J, Hopfield JJ, Winfree E (2004) Neural network computation by in vitro transcriptional circuits. In Advances in Neural Information Processing Systems (NIPS), Vol. 17, pp 681–688 [Google Scholar]
- Klungsøyr L, Hagemen JH, Fall L, Atkinson DE (1968) Interaction between energy charge and product feedback in the regulation of biosynthetic enzymes. Aspartokinase, phosphoribosyladenosine triphosphate synthetase, and phosphoribosyl pyrophosphate synthetase. Biochemistry 7: 4035–4040 [DOI] [PubMed] [Google Scholar]
- Kramer C, Loros JJ, Dunlap JC, Crosthwaite SK (2003) Role for antisense RNA in regulating circadian clock function in Neurospora crassa. Nature 421: 948–952 [DOI] [PubMed] [Google Scholar]
- Kuzmine I, Martin CT (2001) Pre-steady-state kinetics of initiation of transcription by T7 RNA polymerase: a new kinetic model. J Mol Biol 305: 559–566 [DOI] [PubMed] [Google Scholar]
- Lima WF, Crooke ST (1997) Cleavage of single strand RNA adjacent to RNA-DNA duplex regions by Escherichia coli RNase H1. J Biol Chem 272: 27513–27516 [DOI] [PubMed] [Google Scholar]
- Madin K, Sawasaki T, Ogasawara T, Endo Y (2000) A highly efficient and robust cell-free protein synthesis system prepared from wheat germ embryos: Plants apparently contain a suicide system directed at ribosomes. Proc Natl Acad Sci USA 97: 559–564 [DOI] [PMC free article] [PubMed] [Google Scholar]
- Mandal M, Breaker RR (2004) Gene regulation by riboswitches. Nat Rev Mol Cell Biol 5: 451–463 [DOI] [PubMed] [Google Scholar]
- Marras SAE, Kramer FR, Tyagi S (2002) Efficiencies of fluorescence resonance energy transfer and contact-mediated quenching in oligonucleotide probes. Nucleic Acids Res 30: e122. [DOI] [PMC free article] [PubMed] [Google Scholar]
- Martin CT, Coleman JE (1987) Kinetic analysis of T7 RNA polymerase–promoter interactions with small synthetic promoters. Biochemistry 26: 2690–2696 [DOI] [PubMed] [Google Scholar]
- McAdams HH, Arkin A (1997) Stochastic mechanisms in gene expression. Proc Natl Acad Sci USA 94: 814–819 [DOI] [PMC free article] [PubMed] [Google Scholar]
- McClure WR (1985) Mechanism and control of transcription initiation in prokaryotes. Annu Rev Biochem 54: 171–204 [DOI] [PubMed] [Google Scholar]
- Mjolsness E, Sharp DH, Reinitz J (1991) A connectionist model of development. J Theor Biol 152: 429–453 [DOI] [PubMed] [Google Scholar]
- Nakajima M, Imai K, Ito H, Nishiwaki T, Murayama Y, Iwasaki H, Oyama T, Kondo T (2005) Reconstitution of circadian oscillation of cyanobacterial KaiC phosphorylation in vitro. Science 308: 414–415 [DOI] [PubMed] [Google Scholar]
- Noireaux V, Bar-Ziv R, Libchaber A (2003) Principles of cell-free genetic circuit assembly. Proc Natl Acad Sci USA 100: 12672–12677 [DOI] [PMC free article] [PubMed] [Google Scholar]
- Noireaux V, Libchaber A (2004) A vesicle bioreactor as a step toward an artificial cell assembly. Proc Natl Acad Sci USA 101: 17669–17674 [DOI] [PMC free article] [PubMed] [Google Scholar]
- Ozbudak EM, Thattai M, Lim HN, Shraiman BI, van Oudenaarden A (2004) Multistability in the lactose utilization network of Escherichia coli. Nature 427: 737–740 [DOI] [PubMed] [Google Scholar]
- Rizzo J, Gifford LK, Zhang X, Gewirtz AM, Lu P (2002) Chimeric RNA–DNA molecular beacon assay for ribonuclease H activity. Mol Cell Probes 16: 277–283 [DOI] [PubMed] [Google Scholar]
- Rosenfeld N, Young JW, Alon U, Swain PS, Elowitz MB (2005) Gene regulation at the single-cell level. Science 307: 1962–1965 [DOI] [PubMed] [Google Scholar]
- Seeman NC (1982) Nucleic-acid junctions and lattices. J Theor Biol 99: 237–247 [DOI] [PubMed] [Google Scholar]
- Shimizu Y, Inoue A, Tomari Y, Suzuki T, Yokogawa T, Nishikawa K, Ueda T (2001) Cell-free translation reconstituted with purified components. Nat Biotech 19: 751–755 [DOI] [PubMed] [Google Scholar]
- Thron CD (1994) Theoretical dynamics of the cyclin B-MPF system: a possible role for p13suc1. Biosystems 32: 97–109 [DOI] [PubMed] [Google Scholar]
- Triana-Alonso FJ, Dabrowski M, Wadzack J, Nier-haus KH (1995) Self-coded 3′-extension of run-off transcripts produces aberrant products during in vitro transcription with T7 RNA polymerase. J Biol Chem 270: 6298–6307 [DOI] [PubMed] [Google Scholar]
- Voigt CA, Wolf DM, Arkin AP (2005) The Bacillus subtilis sin operon: an evolvable network motif. Genetics 169: 1187–1202 [DOI] [PMC free article] [PubMed] [Google Scholar]
- Wlotzka B, McCaskill JS (1997) A molecular predatory and its prey: coupled isothermal amplification of nucleic acids. Chem Biol 4: 25–33 [DOI] [PubMed] [Google Scholar]
- Yokobayashi Y, Weiss R, Arnold FH (2002) Directed evolution of a genetic circuit. Proc Natl Acad Sci USA 99: 16587–16591 [DOI] [PMC free article] [PubMed] [Google Scholar]
- Yurke B, Mills AP Jr (2003) Using DNA to power nanostructures. Genet Program Evolvable Mach 4: 111–122 [Google Scholar]
- Zaher HS, Unrau PJ (2004) T7 RNA polymerase mediates fast promoter-independent extension of unstable nucleic acid complexes. Biochemistry 43: 7873–7880 [DOI] [PubMed] [Google Scholar]
- Zaikin AN, Zhabotinsky AM (1970) Concentration wave propagation in 2-dimensional liquid-phase self-oscillating system. Nature 225: 535–537 [DOI] [PubMed] [Google Scholar]
Associated Data
This section collects any data citations, data availability statements, or supplementary materials included in this article.
Supplementary Materials
Supplementary Text