

Abstract
Biomolecular networks have to perform their functions robustly. A robust function may have preferences in the topological structures of the underlying network. We carried out an exhaustive computational analysis on network topologies in relation to a patterning function in Drosophila embryogenesis. We found that whereas the vast majority of topologies can either not perform the required function or only do so very fragilely, a small fraction of topologies emerges as particularly robust for the function. The topology adopted by Drosophila, that of the segment polarity network, is a top ranking one among all topologies with no direct autoregulation. Furthermore, we found that all robust topologies are modular—each being a combination of three kinds of modules. These modules can be traced back to three subfunctions of the patterning function, and their combinations provide a combinatorial variability for the robust topologies. Our results suggest that the requirement of functional robustness drastically reduces the choices of viable topology to a limited set of modular combinations among which nature optimizes its choice under evolutionary and other biological constraints.
Keywords: Drosophila, evolution, function and topology, modularity, robustness
Introduction
Biological systems are evolved to function robustly under complex and changing environments (Waddington, 1957). At the cellular level, the interactions of genes and proteins define biomolecular networks that reliably execute various functions despite fluctuations and perturbations. Functional robustness as a systems property may have preferences in and constraints on the wiring diagram of the underlying networks (Barkai and Leibler, 1997; Li et al, 2004; El-Samad et al, 2005; Wagner, 2005). It has been demonstrated in a computational study that a robust oscillator has a strong preference on certain type of the network topology (Wagner, 2005). Preferred network motifs in biological networks were identified (Milo et al, 2002) and were attributed to their robust dynamical properties (Prill et al, 2005). It was argued through a comparative study of a few networks that a bacteria signaling network is optimally designed for its function (Kollmann et al, 2005). To clearly lay out the relationship between the functional robustness and the topological constraints, we carried out an exhaustive computational analysis on the network topologies that perform the same patterning function as the segmentation polarity gene network in Drosophila (Martizez Arias, 1993; DiNardo et al, 1994; Perrimon, 1994). We found that only a small fraction of topologies can perform this patterning function robustly. This information can be used in combination with mutant phenotypes to discriminate biological models. We show that the topology of the Drosophila network is among this small group of robust topologies and is optimized within certain biological constraints. We further found that all robust topologies can be classified into families of core topologies. Each family is a particular combination of three kinds of network modules, which originate from the three subfunctions of the patterning function. We argue that the modular combinations also facilitate flexibility and evolvability in this case.
The segmentation process in the embryogenesis of the fruitfly Drosophila is characterized by a sequential cascade of gene expression, with the protein levels of one stage acting as the positional cues for the next (Wolpert et al, 2002). The successive transient expression of the maternal, the gap and the pair-rule genes divide the embryo into an ever finer pattern. After cellularization, the segment polarity genes stabilize the pattern, setting up the boundaries between the parasegments and providing positional ‘readouts' for further development (Martizez Arias, 1993; DiNardo et al, 1994; Perrimon, 1994). We are concerned here only with the network that is in action during the extended and the segmented germband stage, which is characterized by the interdependency of the expression of en and wg (DiNardo et al, 1994; Perrimon, 1994), and we focus on its function of stabilizing a periodic pattern of sharp boundaries defined by the en- and the wg-expressing cells (Vincent and O'Farrell, 1992). As depicted in Figure 1, the core network in Drosophila consists of the hedgehog (Hh) (Lum and Beachy, 2004) and the wingless (Wg) (Klingensmith and Nusse, 1994) signal transduction pathways. Previous studies demonstrated that this network is a very robust patterning module. Differential equation models of the network can stabilize and maintain the required patterns of en and wg expression with a remarkable tolerance to parameter changes (von Dassow et al, 2000; von Dassow and Odell, 2002; Ingolia, 2004). A simple Boolean model was shown to capture the main feature of the network's dynamics (Albert and Othmer, 2003). These findings have led to the hypothesis that the segment polarity gene network is a very robust developmental module that is adopted in a wide range of developmental programs (von Dassow et al, 2000). Indeed, the striped expression patterns of the segment polarity genes in the segmented germband stage are remarkably conserved among all insects, perhaps among all arthropods (Peel et al, 2005). On the other hand, it was argued that the conservation of this gene network is not due to robustness but rather to pleiotropy (high connectivity with other modules/networks) (Sander, 1983; Raff, 1996; Galis et al, 2002). Pleiotropic effects may constrain the network's evolution, ‘freezing' its topology early on during evolution and making it conserved among developmental programs that later diverged. In this study, we investigate the relationship between the functional robustness and the network's topology. Specifically, we ask the following questions: (1) How many network topologies can perform the given patterning function and how many can do so robustly? (2) Can a robust topology also satisfy certain topological constraints imposed by, for example, pleiotropic effects, and if so how is this achieved? (3) Where does the Drosophila network stand in this analysis? (4) Are there any organization principles emerging from the robust topologies for the given function?
Figure 1.

Segment polarity network and expression pattern of wg and en. (A) The segment polarity gene network model of Ingolia (2004). Ellipses represent mRNAs and rectangles proteins. Lines ending with an arrow and a dot denote activation and repression, respectively. Dashed lines indicate intercellular regulations. The gray line means no direct biological evidence. Nodes are colored into three groups, each of which is represented by one node in (B). (B) The simplified topology of (A). Each node here represents a group of nodes in (A) of the same color. (C) Our model of the segment polarity gene network (see also von Dassow and Odell, 2002). Slp regulates wg positively through the mid gene and its product, which is represented by an arrow from ‘S' to ‘W' in (D). (D) The simplified topology of (C). (E) The initial condition of the patterning function. In three-node networks, ‘S' expresses in the posterior four cells of the parasegment. The pattern is periodic. (F) The final stable pattern. In three-node networks, ‘S' is not fixed to be any specific pattern in the final state. (G) zw3 mutant phenotype. (H) ptc mutant phenotype. Note that (E), (F), (G) and (H) are a simple representation of the actual embryo surface, which is extended in both directions and includes 14 segments.
Results
Coarse-graining the biological network
Instead of analyzing the full biological network, we focus on its core topology. The core topology is derived from the full network and is the minimal set of nodes and links that represent the underlying topology of the full network. This reduction in degrees of freedom enables us to perform a much more comprehensive computational and theoretical analysis and at the same time to preserve key functional properties. The topology of the Drosophila segment polarity network can be represented by a network of three nodes. The network represented in Figure 1A can be simplified into the topology of Figure 1B. As we are mainly concerned with the steady-state behavior, certain ‘intermediate steps' in the network can be combined. First, we combine the mRNA node with its corresponding protein node if there is no post-transcriptional regulation for the mRNA, because the time delay between the mRNA and the protein production does not play any role in our steady-state analysis. We then combine the node hh/Hh with en/En, because the expression of hh depends solely on En. The expression patterns of these two genes, hh and en, are highly correlated at this stage of the development (Tabata et al, 1992). We thus use a single node ‘E' in Figure 1B representing the four nodes en, En, hh and Hh in Figure 1A. Extracellular Hh signaling activates wg by regulating the amount of Ci and Cn, which are parts of the Hh signal transduction pathway. Both Ci and Cn are the products of the gene ci. In the absence of Hh signaling, Ci goes through a process of proteolysis and the remaining fragment functions as a repressor, Cn. The Hh signaling blocks the proteolysis of Ci, resulting in the accumulation of Ci in the nucleus, which acts as a transcriptional activator for wg (Alexandre et al, 1996; Lum and Beachy, 2004). Thus, Ci and Cn function like a transcriptional switch in response to the Hh signaling. This regulation is simplified as a direct (intercellular) link from ‘E' to ‘W' in the coarse grained topology (Figure 1B). The repression of ci by En in Figure 1A is represented in Figure 1B as ‘E' repressing ‘W', as the function of ci is to control the expression of wg. The simplified model Figure 1B has similar dynamic properties with the more detailed model Figure 1A; in particular, they can both stabilize the wild-type pattern and sharpen the parasegment boundary.
In coarse-graining the network of Figure 1C to that of Figure 1D, the two negative regulations, from Slp to mid and from Mid to wg, are replaced with a direct positive regulation from ‘S' to ‘W'. Again, the simplified model Figure 1D has similar dynamic properties and patterning function with the full model Figure 1C.
Enumerating three-node networks
We then proceed to enumerate topologies of three-node networks with intra- and intercellular interactions. Every node may regulate itself and the other two nodes, both intracellularly and intercellularly, resulting in 3 × 3 × 2=18 directed links. Each link has three possibilities: the regulation can be positive, negative or absent. So the total number of possible topologies for the three-node network is 318=387 420 489. Enumerating all of them is beyond our computational power. Thus, we make the following restrictions on the topology: only two out of the three nodes can possibly go outside of the cell to signal. This restriction reduces the total number of topologies to 315=14 348 907, all of which we enumerate. For each topology, we use a model of ordinary differential equations (ODEs) to quantitatively assess its ability to perform the required function, which is to stabilize the pattern of Figure 1F given the initial condition of Figure 1E (Materials and methods). The functional robustness of a topology is measured by the quantity Q (=the fraction of the parameter space that can perform the function) (von Dassow et al, 2000; Ingolia, 2004). We estimate Q by randomly sampling the parameter space: Q≈m/n, where n is the number of random parameter sets used in the sampling and m the number of those sets that can perform the function. We first sampled each and every topology with n=100 random parameter sets. We found that about 1% of the topologies can perform the function with at least one of the 100 parameter sets (m>0). However, their Q values differ drastically. As shown in Figure 2, the distribution of the Q values is much skewed among the 1% population of the topologies—although the majorities have very small Q values, there is a long tail in the distribution.
Figure 2.

The histogram of Q values for three-node networks. Each of the 14 348 907 networks is sampled with 100 random parameter sets (black bars). Each of the resulting 156 016 networks with Q>0 is resampled with 1000 random parameter sets (only data with Q>0.1 are shown; red bars). Inset: the same data plotted in log–log scale and in terms of the probability density. The straight line has a slope of −1.37.
Biological network
The topology (Figure 1B) of the network constructed in previous studies (von Dassow and Odell, 2002; Ingolia, 2004) (Figure 1A) scored very high but is not the top ranking one. However, there may be some biological constraints on the selection of topologies. Indeed, a group of topologies consisting of only two nodes (with the ‘S' node left unlinked) come close to the top (see Figure 3A), suggesting that if Drosophila were only presented with the function defined in our study, the best design would be to just use two mutually activating signaling pathways (‘E' and ‘W') and nothing else. But both the Hh and the Wg signaling pathways are utilized in at least several other functions besides stabilizing the parasegment boundaries (Galis et al, 2002), which may impose pleiotropic constraints on the topology of the networks that utilize these pathways. In general, these constraints may be hard to decipher. Here, we simply note that there is no sound biological evidence for any direct positive autoregulation loops on the two signaling pathways and on the slp genes. If we exclude topologies with any direct positive autoregulation on the ‘E' and the ‘S' nodes, Figure 1B stands up as the most robust topology (Q=0.47). In this topology, there is still a direct autoregulation loop on ‘W', which originates from the Wg → wg autoregulation in Figure 1A. This autoregulation has no basis in biological evidence, but was added by previous authors to ensure the correct patterning of the model—without this added link, their models cannot reproduce the correct biological pattern (von Dassow et al, 2000; von Dassow and Odell, 2002; Ingolia, 2004). We ask that if we do not add this autoregulation, whether we can identify a robust topology that has biological evidence for every link. There are eight topologies with Q>0.1 that have no direct autoregulation on any of the three nodes. A top ranking one (Q=0.36) is shown in Figure 1D. Instead of a direct autoregulation on ‘W', this topology accomplishes the positive feedback indirectly through the node ‘S'. This would suggest that the Wg signaling pathway regulates the slp gene whose product in turn regulates wg. Indeed, there is ample biological evidence for these regulations (Lee and Frasch, 2000; Buescher et al, 2004), suggesting a biological network of Figure 1C. The role of slp in regulating wg was also discussed in previous computation models (Meir et al, 2002; Albert and Othmer, 2003).
Figure 3.

Skeletons and functional modules. (A) The four skeletons in robust two-node topologies (black lines). The green, orange and red links are neutral, bad and very bad links, respectively. The numbers below the skeletons are its Q value and the size of its family. (B) The three kinds of modules correspond to the three subfunctions in three-node networks. The bold modules are also those of the two-node networks. Many of these modules can be identified as significant network motifs among all networks with Q>0.1 (see details in Supplementary information). The combination of these modules leads to 44 robust core topologies or skeletons. The number under each module is its Q value, the frequency the module is being used in the 44 skeletons.
To further determine which of the two topologies, Figure 1B or D, is closer to the true biological one, we subject both to the mutant test. We model two kinds of mutants corresponding to perturbations in the two signaling pathways and compare the computed phenotypes with the experimental observations. The first is the zw3 (a protein kinase in Wg signaling pathway) mutant—the mutation results in a ubiquitous Wg signaling with a phenotype of an expanded en-expressing region ended by an ectopic wg-expressing stripe (Figure 1G) (Siegfried et al, 1994). The second is the mutation of the Hh receptor patched (ptc), which results in a ubiquitous Hh signaling and has a phenotype of an expanded wg-expressing region ended by an ectopic en-expressing stripe (Figure 1H) (DiNardo et al, 1988). We found that although both topologies, Figure 1B and D, can produce the wild-type patterning robustly, only the network of Figure 1D can also produce the two mutant phenotypes. Specifically, for Figure 1D, about 1/3 of the parameter sets that produced the wild-type pattern can also produce the two mutant patterns. For Figure 1B, none of the parameter sets that produced the wild-type pattern can also produce either of the two mutant patterns. We also used the more detailed models Figure 1A and C to carry out the mutant test and obtained similar results (see details in Supplementary information). This suggests that the network of Figure 1C (and its corresponding topology of Figure 1D) is a better model for the Drosophila network than that of Figure 1A (and Figure 1B).
Two-node topologies
In our enumeration study of the three-node topologies, some two-node topologies (with the ‘S' node unlinked) scored very high. This indicates that the simplest ‘irreducible' topology for the required patterning function consists of only two nodes and that it would be instructive to study two-node topologies. There are 45 two-node topologies with Q>0.1. A close examination of these topologies revealed that all of them come from four core topologies, which we call skeletons (Figure 3A). In other words, the 45 topologies can be classified into four families. In each family, all the members come from a skeleton by adding extra links to the skeleton. These links are either ‘neutral' (have no effect on the Q value) or ‘bad' (will reduce the Q value). The number of neutral links a skeleton can accommodate and the number of bad links it can tolerate (so that the reduced Q value is still larger than 0.1) depend on the structure and the robustness of the skeleton. As shown in Figure 3A, the first skeleton can accommodate and tolerate combinations of two neutral links and four bad links, whereas the fourth skeleton can accommodate or tolerate none. Furthermore, the four skeletons all contain the following three topological features: positive feedback on ‘E' (either intra- or intercellularly), positive feedback on ‘W' (either intra- or intercellularly) and intercellular mutual activation between ‘E' and ‘W'. These three topological features can be traced back to three subfunctions, which the required patterning function can be decomposed into. Note that cells adjacent to an ‘E'-expressing cell can have two different fates: expressing ‘W' or none (Figure 1F). So the network should be bistable in ‘W'. Similarly, cells adjacent to ‘W' can express either ‘E' or none, implying bistability in ‘E'. Thus, the positive feedback loops on ‘E' and ‘W' follow the functional requirement of bistability on ‘E' and ‘W' (Ingolia, 2004). The mutual intercellular activation between ‘E' and ‘W' arises from the functional requirement of maintaining a sharp patterning boundary. In order to sharpen a wide boundary (Figure 1E), it is necessary to have ‘E' expressed only right next to a ‘W' cell, and vice versa, leading to the interdependency of ‘E' and ‘W' in the network topology. Therefore, the three functional requirements lead to the three kinds of topological features, or modules. The combination of the three kinds of modules, with one from each kind, results in the four skeletons of the robust topologies (Figure 3A). Note that for the second, third and fourth skeletons in Figure 3A, there are necessary repressive links (which are neutral in the first skeleton) in addition to the three modules. When the positive feedback module is intercellular, it is necessary to have an intracellular repression on the node to prevent the ‘E' and ‘W' being expressed in the same cell causing further blurring of the boundary (see details in Supplementary information). Also note that some bad links are just redundant modules, for example, the intercellular autoactivation of E or W in the first skeleton.
Families of three-node topologies
Having identified the three essential kinds of modules for the patterning function and the rules of their combination in two-node topologies, we turn our attention to the robust three-node topologies and ask if similar organization principles exist there. With one extra node ‘S', there are multiple new ways to form each kind of module (Figure 3B). (Note that for the E and W modules, the positive feedback does not have to act on E/W directly. If E/W is dependent on S, positive feedback on S is also a viable choice. Also note that as we have excluded from our enumeration the intercellular regulation from S, there are no modules with this regulation.) We then checked all three-node topologies with Q>0.1 to see if they contained these modules. Intriguingly, every topology in this pool (37 580 of them) contains at least one module of each kind. Therefore, it is a necessary condition for a robust topology to include at least one module of each kind. On the other hand, the reverse is not true. From the modules in Figure 3B, one can form 108 combinations that include one and only one module of each kind and that have no conflicting regulations (see details in Supplementary information). Only 44 of them are robust enough to be the skeletons of networks with Q>0.1. In other words, we found that all topologies with Q>0.1 can be classified into 44 distinct families corresponding to 44 modular combinations (skeletons). In most families, the Q value of the skeleton is either the highest or close to the highest in the family, implying that other members in the family have extra non-beneficial (neutral and bad) links compared to the skeleton. There are a few cases where the skeleton's Q value is not close to the top within the family, implying that some extra links in addition to the modular combination are beneficial.
As shown in Figure 4A, the family size roughly scales exponentially with the skeleton's Q value. This means that the larger the skeleton's Q value, the more non-beneficial links it can accommodate and tolerate. The exponential dependence of the family size on the Q value suggests family members as some kind of combinatorial additions to the core topology, although in general the effects of additions of links to the core may be correlated. Although the non-beneficial links do not improve the Q values, they may facilitate variability and plasticity that can be useful in adapting to new environments and functional tasks (Schuster et al, 1994). We found that certain neutral links and redundant modules are beneficial when the system is faced with noisy initial conditions (see details in Supplementary information). The modular organization of the skeletons suggests that their Q values might be related to the Q values of the modules. Indeed, we found that for the 44 skeletons, the Q value of a skeleton is well correlated with the product of the Q values of the three modules that make up the skeleton (Figure 4B).
Figure 4.

The number of networks in a family (A) and the skeleton's estimated Q value (the product of the modules' Q values) (B) versus the Q value of the skeleton.
Discussion
In summary, our study of the relationship between function and topology revealed certain design principles that may be applicable to a broader class of biological systems. We found that the requirement of functional robustness drastically reduces the choices of viable topology. Similar findings were reported in models of circadian oscillators (Wagner, 2005) and, in a broader sense, protein folding (Li et al, 1996), suggesting that the constraint may be general. The approach and method developed here may be applicable in analyzing other networks and in designing novel functional networks.
Modularity
In our case, the robust topologies are a set of modular combinations. Here, modularity arises from the decomposability of the function into relatively independent subfunctions. Combinations of modules provide a combinatorial variability—each subfunction has a multiple choice of modules. Although only a subset of these combinations is robust, this flexibility may be crucial for the network to evolve and adapt in a wide range of situations (Kirschner and Gerhart, 2005). On the other hand, the fact that each module in the network can be traced back to a simpler subfunction suggests that new and more complex functions can be built from the bottom up via combinations of simpler functional modules. Similar principles have been seen in other biological systems, for example, the transcriptional control (Carroll, 2005) and protein interactions (Bhattacharyya et al, 2006), suggesting a hierarchical modular design toward an increasing complexity.
Optimality and pleiotropy
Another insight gained from our study is that the topology adopted by nature may not necessarily be the most robust per se, but may nonetheless be optimized within certain biological constraints. Here, the constraint seems to be that no direct positive loops can be used on the three nodes: ‘E', ‘S' and ‘W'. Direct positive autoregulation may result in a less flexible system, which may impair the other functional abilities of the Hh and Wg pathways. Given the multiple tasks carried out by the two major signaling pathways (Galis et al, 2002), it is plausible that when a positive loop is needed for a specific function, it is best done with another mediator (here ‘S') that is only involved in that function. Intriguingly, in the segment polarity gene network, the ‘S' node is part of the positive loops of both ‘E' and ‘W' (Figure 1C and D). The ‘S' loops with ‘E' through mutual repression and with ‘W' through mutual activation. This design ensures that ‘E' and ‘W' cannot be switched on in the same cell. Our study suggests that modular design not only provides robustness but can also facilitate variability to accommodate a variety of pleiotropic constraints.
Evolution
The distribution of Q values (Figure 2) may have quantitative implications in the early history of evolution. One may ask whether nature picked a robust topology in the first place or a fragile one and then improved upon it. The argument for the former is that a robust topology has a very large working parameter space and thus is easy to be ‘hit' by random parameter sets. The argument for the latter is that although each particular fragile topology has a tiny working parameter space and is hard to be ‘hit', there are so many of them that the chance of hitting any is high. This question can be phrased quantitatively by asking what is the most probable Q value for the quantity Q × P(Q), where P(Q) is the probability density of the Q distribution (inset of Figure 2). We found that P(Q)≈c/Qα, with α=1.37, which implies that Q × P(Q)≈c/Q0.37 has larger weights in smaller Q's, favoring the fragile topologies as nature's first pick.
Functional versus robustness constraint
We have sampled each of the 14 348 907 three-node topologies with N=100 random sets of parameters. We found that there are M=156 016 (about 1%) networks that are ‘functional' with at least one parameter set. Among these ‘functional networks', 96% of them contain at least one module of each kind. Thus, it appears that the function alone (without robustness) is a primary constraint on topology. However, note that the number of ‘functional networks' M can increase with the sampling number N. We have sampled all two-node networks with N=100, 1000 and 10 000 (Supplementary information) and found that M=75, 100 and 120, respectively. Furthermore, we found that the percentage of ‘functional networks' that are modular (containing at least one skeleton) decreases with N: it is 92% for N=100, 74% for N=1000 and 63% for N=10 000. Thus, ‘functional network' cannot be defined unambiguously without a minimal robustness (Q) requirement. There would be more and more non-modular ‘functional networks' if we sample the parameter space more and more thoroughly. These networks ‘function' with some special arrangements of parameters. On the other hand, if we focus on robust functional networks (the ones with Q larger than a minimal value), all the statistical properties converge with the sampling number and the conclusions are robust.
Materials and methods
The ODE model
For a fixed topology, every cell has the same set of nodes and links. Each node A has a half-life time τA. Each link is modeled with a Hill function. ‘A link from A' has either the form An/(An+kn) (positive regulation) or kn/(An+kn) (negative regulation). After proper normalization, each node has one parameter (half-life time) and each link has two parameters (n and k). Multiple regulations to the same node are modeled as the product of the regulations. For example, for the topology of Figure 5, the equations in each cell are
Figure 5.

An example of a two-node topology. Intracellular regulations (solid lines) act on nodes within the cell; intercellular regulations (dashed lines) act on target nodes in nearby cells.
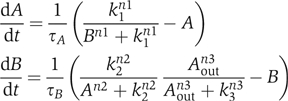
where Aout is the average concentration of A in the neighboring cells. We use the multiplication rule to model multiple regulations because in the full biological network (Figure 1A and C) the negative links are dominant, implying an ‘AND'-like logic when a negative link appears together with other regulations. In the simplified model, a positive link can be a result of two negative links (e.g., the link S → W in Figure 1D is from two negatives: Slp—∣Mid—∣Wg in Figure 1C). In this case, the positive link should also have the ‘AND'-like logic. For simplicity, we implement the multiplication rule uniformly whenever there are multiple regulations. In our case, we have tested that the simplified models (Figure 1B and D) have the same steady-state pattern as the full models (Figure 1A and C).
Simulation
We use the GNU Scientific Library for ODE simulation (Galassi et al, 2002). The function used for the integration is rkf45. Calculation time is set to 800 min (virtual simulation time). In most calculations, we randomly sample 100–10 000 parameter sets using the LHS method (McKay et al, 1979), which minimizes the correlation between different parameter dimensions. The ranges of the parameters used in the sampling are as follows: k=(0.001–1), n=(2–10) and τ=(5–100 min). They are similar to the ranges used in previous studies (von Dassow et al, 2000; Ingolia, 2004). k is evenly sampled on the log scale and both τ and n are evenly sampled on the linear scale. The ODEs are simulated on an eight-cell segment (one row of the parasegment in Figure 1F). Periodic boundary condition is used in both directions (x and y).
Patterning function and judgment of pattern
We judge whether or not a network with a given parameter set can perform the required patterning function in the following way. Let x(I;n) be the value of node I in cell n. I can be E, S or W and x is a real number between 0 and 1. The patterning function is defined as follows: given the initial condition (Figure 1E) x(E;1,2)=1, x(E;3–8)=0, x(S;1–4)=0, x(S;5–8)=1, x(W;1–6)=0, x(W;7,8)=1, the network should reach the target steady state (Figure 1F) x(E;1)=1, x(E;2–8)=0, x(W;1–7)=0, x(W;8)=1 within a given time. We use a similar criterion as the one in previous studies (von Dassow et al, 2000; Ingolia, 2004) to judge if a pattern is acceptable to be the target pattern. Specifically, for node I in cell n, a score T is given to evaluate if its expression level is consistent with the target pattern:
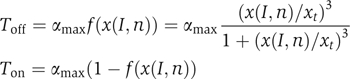
where x(I,n) is the concentration of node I in cell n, xt the threshold for x (we use 10% here) and αmax the worst-possible score (0.5 here). Toff is used when the target state requires that node I has a low value (0) in cell n. Ton is used when node I should have a high value (1) in cell n. All the individual scores are combined to give the total score:
![]()
If the total score is lower than 0.0125, the pattern is acceptable. This threshold is more stringent than that in the previous work (von Dassow et al, 2000; Ingolia, 2004). We check the pattern twice, at 600 and 800 min. If the scores are smaller than 0.0125 at both times, we accept the pattern.
Supplementary Material
Supplementary information
Acknowledgments
We thank Nicholas Ingolia, Morten Kloster, Edo Kussell, Patrick O'Farrell, Wendell Lim, Andrew Murray, Leslie Spector and members of the Center for Theoretical Biology at PKU for discussion, comments and/or critical reading of the manuscript. This work was supported by National Key Basic Research Project of China (2003CB715900) and National Natural Science Foundation of China. CT acknowledges support from the Sandler Family Supporting Foundation.
References
- Albert R, Othmer HG (2003) The topology of the regulatory interactions predicts the expression pattern of the segment polarity genes in Drosophila melanogaster. J Theor Biol 223: 1–18 [DOI] [PMC free article] [PubMed] [Google Scholar]
- Alexandre C, Jacinto A, Ingham PW (1996) Transcriptional activation of hedgehog target genes in Drosophila is mediated directly by the cubitus interruptus protein, a member of the GLI family of zinc finger DNA-binding proteins. Genes Dev 10: 2003–2013 [DOI] [PubMed] [Google Scholar]
- Barkai N, Leibler S (1997) Robustness in simple biomedical networks. Nature 387: 913–917 [DOI] [PubMed] [Google Scholar]
- Bhattacharyya RP, Reményi A, Yeh BJ, Lim WA (2006) Domains, motifs, and scaffolds: the role of modular interactions in the evolution and wiring of cell signaling circuits. Annu Rev Biochem 75: 655–680 [DOI] [PubMed] [Google Scholar]
- Buescher M, Svendsen PC, Tio M, Miskolczi-McCallum C, Tear G, Brook WG, Chia W (2004) Drosophila T box proteins break the symmetry of hedgehog-dependent activation of wingless. Curr Biol 14: 1694–1702 [DOI] [PubMed] [Google Scholar]
- Carroll SB (2005) Evolution at two levels: on genes and form. PLoS Biol 3: e245. [DOI] [PMC free article] [PubMed] [Google Scholar]
- DiNardo S, Heemskerk J, Dougan S, O'Farrell PH (1994) The making of a maggot: patterning the Drosophila embryonic epidermis. Curr Opin Genet Dev 4: 529–534 [DOI] [PMC free article] [PubMed] [Google Scholar]
- DiNardo S, Sher E, Heemskerk-Jongens J, Kassis JA, O'Farrell PH (1988) Two-tiered regulation of spatially patterned engrailed gene expression during Drosophila embryogenesis. Nature 332: 604–609 [DOI] [PMC free article] [PubMed] [Google Scholar]
- El-Samad H, Kurata H, Doyle JC, Gross CA, Khammash M (2005) Surviving heat shock: control strategies for robustness and performance. Proc Natl Acad Sci USA 102: 2736–2741 [DOI] [PMC free article] [PubMed] [Google Scholar]
- Galassi M, Davies J, Theiler J, Gough B, Jungman G, Booth M, Rossi F (2002) GNU Scientific Library Reference Manual. 2nd edn, 290–298 [Google Scholar]
- Galis F, van Dooren TJ, Metz JA (2002) Conservation of the segmented germband stage: robustness or pleiotropy? Trends Genet 18: 504–509 [DOI] [PubMed] [Google Scholar]
- Ingolia NT (2004) Topology and robustness in the Drosophila segment polarity network. PLoS Biol 2: e123. [DOI] [PMC free article] [PubMed] [Google Scholar]
- Kirschner M, Gerhart J (2005) The Plausibility of Life. New Haven and London: Yale University Press [Google Scholar]
- Klingensmith J, Nusse R (1994) Signaling by wingless in Drosophila. Dev Biol 166: 396–414 [DOI] [PubMed] [Google Scholar]
- Kollmann M, Lovdok L, Bartholome K, Timmer J, Sourjik V (2005) Design principles of a bacterial signalling network. Nature 438: 504–507 [DOI] [PubMed] [Google Scholar]
- Lee HH, Frasch M (2000) Wingless effects mesoderm patterning and ectoderm segmentation events via induction of its downstream target sloppy paired. Development 127: 5497–5508 [DOI] [PubMed] [Google Scholar]
- Li F, Long T, Lu Y, Ouyang Q, Tang C (2004) The yeast cell-cycle network is robustly designed. Proc Natl Acad Sci USA 101: 4781–4786 [DOI] [PMC free article] [PubMed] [Google Scholar]
- Li H, Helling R, Tang C, Wingreen N (1996) Emergence of preferred structures in a simple model of protein folding. Science 273: 666–669 [DOI] [PubMed] [Google Scholar]
- Lum L, Beachy PA (2004) The Hedgehog response network: sensors, switches, and routers. Science 304: 1755–1759 [DOI] [PubMed] [Google Scholar]
- Martizez Arias A (1993) In Development and Patterning of the Larval Epidermis of Drosophila. Bate M, Hartenstein V (eds) pp 517–608. Cold Spring Harbor, NY: Cold Spring Harbor Laboratory Press [Google Scholar]
- McKay MD, Beckman RJ, Conover WJ (1979) A comparison of three methods for selecting values of input variables in the analysis of output from a computer code. Technometrics 21: 239–245 [Google Scholar]
- Meir E, Munro EM, Odell GM, von Dassow G (2002) Ingeneue: a versatile tool for reconstituting genetic networks, with examples from the segment polarity network. J Exp Zool 294: 216–251 [DOI] [PubMed] [Google Scholar]
- Milo R, Shen-Orr S, Itzkovitz S, Kashtan N, Chklovski D, Alon U (2002) Network motifs: simple building blocks of complex networks. Science 298: 824–827 [DOI] [PubMed] [Google Scholar]
- Peel AD, Chipman AD, Akam M (2005) Arthropod segmentation: beyond the Drosophila paradigm. Nat Rev Genet 6: 905–916 [DOI] [PubMed] [Google Scholar]
- Perrimon N (1994) The genetic basis of patterned baldness in Drosophila. Cell 76: 781–784 [DOI] [PubMed] [Google Scholar]
- Prill RJ, Iglesias PA, Levchenko A (2005) Dynamic properties of network motifs contribute to biological network organization. PLoS Biol 3: e343. [DOI] [PMC free article] [PubMed] [Google Scholar]
- Raff RA (1996) The Shape of Life. Chicago: University of Chicago Press [Google Scholar]
- Sander K (1983) Development and Evolution. Goodwin BC, Holder N, Wylie CC (eds) pp 137–154. Cambridge: Cambridge University Press [Google Scholar]
- Schuster P, Fontana W, Stadler PF, Hofacker I (1994) From sequences to shapes and back: a case study in RNA secondary structures. Proc R Soc London B 255: 279–284 [DOI] [PubMed] [Google Scholar]
- Siegfried E, Wilder EL, Perrimon N (1994) Components of wingless signalling in Drosophila. Nature 367: 76–80 [DOI] [PubMed] [Google Scholar]
- Tabata T, Eaton S, Kornberg TB (1992) The Drosophila hedgehog gene is expressed specifically in posterior compartment cells and is a target of engrailed regulation. Genes Dev 6: 2635–2645 [DOI] [PubMed] [Google Scholar]
- Vincent JP, O'Farrell PH (1992) The state of engrailed expression is not clonally transmitted during early Drosophila development. Cell 68: 923–931 [DOI] [PMC free article] [PubMed] [Google Scholar]
- von Dassow G, Odell GM (2002) Design and constraints of the Drosophila segment polarity module: robust spatial patterning emerges from intertwined cell state switches. J Exp Zool 294: 179–215 [DOI] [PubMed] [Google Scholar]
- von Dassow G, Meir E, Munro EM, Odell GM (2000) The segment polarity network is a robust developmental module. Nature 406: 188–192 [DOI] [PubMed] [Google Scholar]
- Waddington CH (1957) The Strategy of the Genes. George Allen & Unwin Ltd: London [Google Scholar]
- Wagner A (2005) Circuit topology and the evolution of robustness in two-gene circadian oscillators. Proc Natl Acad Sci USA 102: 11775–11780 [DOI] [PMC free article] [PubMed] [Google Scholar]
- Wolpert L, Beddington R, Jessell T, Lawrence P, Meyerowitz E, Smith J (2002) Principles of Development. New York: Oxford Press [Google Scholar]
Associated Data
This section collects any data citations, data availability statements, or supplementary materials included in this article.
Supplementary Materials
Supplementary information