

Abstract
Different data support a role for brainstem noradrenergic inputs to the hypothalamic paraventricular nucleus (PVN) in the control of hypothalamus – pituitary – adrenocortical (HPA) axis. However, little is known regarding the functional adaptive changes of noradrenergic afferent innervating the PVN and supraoptic nucleus (SON) during chronic opioid exposure and upon morphine withdrawal.
Here we have studied the expression of Fos after administration of morphine and during morphine withdrawal in the rat hypothalamic PVN and SON. Fos production was also studied in brainstem regions that innervate hypothalamic nuclei: the nucleus of solitary tract (NTS – A2) and the ventrolateral medulla (VLM – A1) and combined with immunostaining for tyrosine hydroxylase (TH) for immunohistochemical identification of active neurons during morphine withdrawal. Male rats were implanted with s.c. placebo or morphine (tolerant/dependent) pellets for 7 days. On day 8 rats received an injection of saline i.p., morphine i.p., saline s.c. or naloxone s.c.
Acute morphine administration produced an increase in Fos expression at hypothalamic nuclei and in the brainstem regions, and tolerance developed towards this effect. Precipitated morphine withdrawal induced marked Fos immunoreactivity within the PVN and SON. Concomitantly, numerous neurons in the brainstem were stimulated by morphine withdrawal. Moreover, catecholaminergic-positive neurons in the brainstem showed a significant increase in Fos expression in response to morphine withdrawal.
These findings demonstrate that chronic activation of opioid receptors results in altered patterns of immediate-early genes (IEG) expression in the PVN and SON, which occurs concurrently with an increased activity of their inputs from the brainstem.
Keywords: PVN, SON, HPA axis, NTS-A2, VLM-A1, morphine, c-fos, tyrosine hydroxylase
Introduction
The immediate-early genes (IEG) are a class of genes that are rapidly expressed in response to an extracellular stimulus. Fos protein forms part of the activator protein 1 (AP-1) transcription factor, which regulates the expression of other delayed response genes (Morgan & Curran, 1991). Basal c-fos levels in brain are low, and c-fos is induced by a wide variety of stimuli (Morgan & Curran, 1991) including opioids (Hughes & Dragunow, 1995). This implies that c-fos could be a marker of neuronal activation leading to longer-term adaptive responses mediated by the regulation of gene expression (Kovács, 1998).
As a result of repeated drug use, adaptations in neurons can result in a cascade of cellular events that may ultimately lead to the formation of drug addiction (Nestler & Aghajanian, 1997). Many drugs of abuse induce IEG expression in the CNS. Previous studies from this laboratory and others have demonstrated that acute activation of μ- and k-opioid receptors caused induction of the IEG c-fos in localized areas of the brain (Curran et al., 1996; Gutstein et al., 1998; Laorden et al., 2000a). In addition, chronic morphine administration has been shown to alter the IEGs that are expressed in specific brain areas that are normally responsive to acute morphine treatment (Frankel et al., 1999).
Morphine withdrawal induces a state of neuronal hyperexcitability in the brain which has been linked to alteration in a number of second messenger systems and neurotransmitters. These changes may underlie altered mRNA levels of IEGs in different brain areas following morphine withdrawal (Beckmann et al., 1995). Morphine withdrawal also produces a complex endocrine alteration in rats, including the activation of the hypothalamus – pituitary – adrenocortical (HPA) axis. This alteration of the axis is characterized by an increased ACTH and corticosterone secretion, possibly due to the overproduction of CRF (Ignar & Kuhn, 1990; Gonzálvez et al., 1994; Vargas et al., 1997).
Noradrenergic neurons in the nucleus of the solitary tract (NTS, noradrenergic A2 neurons) have been shown to project to the parvocellular PVN, the primary location of CRF (Cunningham & Sawchenko, 1988; Everitt et al., 1992). The pattern of innervation of neurosecretory CRF neurons by A2 noradrenergic neurons clearly indicates an important role for noradrenergic neurotransmission in the regulation of CRF secretion and in the HPA axis activity. Recently, pharmacological findings from our laboratory indicate that morphine withdrawal is associated with an increase in hypothalamic noradrenaline (NA) turnover, which has been attributed to an enhanced NA secretion and suggests a stimulatory role of this neurotransmitter in CRF release during opioid dependence (Milanés et al., 1998; Fuertes et al., 2000a; Laorden et al., 2000b).
The study was focused on the influence of morphine administration and naloxone-induced morphine withdrawal on the neuronal activity in hypothalamic nuclei and in catecholaminergic brainstem areas innervating the hypothalamus. We have used the expression of the IEG c-fos, which is expressed in association with neuronal discharge, as a marker of neuronal excitation (Morgan & Curran, 1991; Kovács, 1998). We measured the expression of Fos protein in the parvocellular part of the PVN and in the SON (which is also involved in the neuroendocrine control of the HPA axis) after acute and chronic morphine treatment and during naloxone-precipitated morphine withdrawal. After the same treatments, we also studied Fos production in the ventrolateral medulla (VLM-A1) and NTS-A2 cell groups, which project to the SON and PVN (the primary location of tubero-infundibular CRF cells), to test the possible correlation between Fos expression in these areas vs that in the hypothalamic nuclei. In addition, double-label immunostaining was used to investigate Fos expression during morphine withdrawal in brainstem neurons positive for tyrosine hydroxylase (TH), the rate-limiting step in the biosynthesis of catecholamines.
Methods
Male Sprague-Dawley rats (220 – 240 g at the beginning of the experiments) were housed four to five per cage under a 12 h light/dark cycle (L: 8:00 – 20:00 h) in a room with controlled temperature (22±2°C), humidity (50±10%) and food and water available ad libitum. All surgical and experimental procedures were performed in accordance with the European Communities Council Directive of 24 November 1986 (86/609/EEC) and the local Committee.
Experimental procedure
For acute experiments, groups of rats were treated with placebo pellets subcutaneously (control) under light ether anaesthesia (n=6 – 8 rats per group): one pellet on day 1, two on day 3 and three on day 5. On day 8 rats received saline i.p. or morphine (30 mg kg−1 i.p.). The dose of morphine was selected according to previous studies which have shown that the opioid stimulates the HPA axis only after administration of higher doses (>20 mg kg−1) than those required to produce analgesia (for revision see Pechnick, 1993).
On the basis of previous studies (Gonzálvez et al., 1994; Vargas et al., 1997), rats were rendered tolerant/dependent on morphine by s.c. implantation of morphine base pellets (75 mg), one on day 1, two on day 3 and three on day 5, under light ether anaesthesia (n=4 – 6 per group). This procedure has repeatedly been shown to induce both tolerance and dependence as measured behaviourally and biochemically (Vargas et al., 1997; Fuertes et al., 2000b). Control animals were implanted with placebo pellets containing lactose instead morphine on the same time schedule (n=4 – 6 per group). On day 8 the animals pretreated with morphine or placebo pellets were injected with saline s.c. or naloxone (5 mg kg−1 s.c.). Withdrawal signs were observed before and for 30 min after administration of the opioid antagonist or saline. Body weight loss was determined as the difference between the weight determined immediately before saline or naloxone injection and a second determination made 30 min later.
Tissue preparation
Rats were sacrificed with a overdose of pentobarbital (100 mg kg−1 i.p.) 90 min after administration of saline i.p., morphine i.p., naloxone s.c. or saline s.c. The delay of 90 min after opioids antagonists or control injections was chosen since it was previously demonstrated that the peak effect of stimulated Fos in brain is 90 min (Morgan & Curran, 1991). Following anaesthesia, rats were perfused transcardially with 300 ml of phosphate buffered saline (PBS; pH 7.4) followed by 500 ml of cold, 4% paraformaldehyde in PBS (pH 7.4). Following perfusion, brains were removed, post-fixed in the same fixative and stored at 4°C overnight. Free floating coronal brain sections (150 μm in thickness) throughout the rostrocaudal extend of the hypothalamus were obtained on a Vibratome. A total of 16 hypothalamic sections were taken for each animal, corresponding to plates 23 – 26 in the atlas of Palkovits & Brownstein, (1988) which contain the hypothalamic SON and PVN (plane of sections posterior to bregma: 1.3 – 1.4 mm for SON; 1.8 – 2.12 mm for PVN (Paxinos & Watson, 1998). The brain sections chosen for analysis of Fos or Fos and TH in the NTS (A2 cell group) and in the VLM (A1 group) were as follows: sections corresponded to those at the level of plates 63 – 68 in the atlas of Palkovits & Brownstein (1988); since noradrenergic A1 and A2 neuronal groups in the VLM and NTS, respectively, extend from the level of area postrema (AP), rostrally, to upper cervical segment of spinal cord caudally (Sawchenko & Swanson, 1982; Cunningham & Sawchenko, 1988), analysis of Fos was made at various levels, ranging from the mid-extend of the AP, rostrally, to the pyramidal decussation, caudally (Palkovits & Brownstein, 1988) (plane of sections relative to bregma: −13.68 to −14.6 (Paxinos & Watson, 1998). The data for each the NTS and VLM were combined for the entire nucleus.
Immunohistochemistry
Expression of Fos protein was examined in free floating sections, which were collected serially in adjacent sets, shaken in PBS for at least 30 min to remove the fixative and processed for immunohistochemistry as described previously (Laorden et al., 2000a). Briefly, the sections were pre-incubated for 20 min in absolute methanol plus 10% H2O2 to block endogenous peroxidase activity. They were rinsed in PBS twice (15 min each) and treated with NSS – PBS (PBS containing 1% normal swine serum; Dako, Gostrup, Denmark; and 0.5% Triton X-100) for 30 min. All sections were then reacted with the primary polyclonal Fos antibody (dilution 1 : 3000 in NSS – PBS; sc253, Santa Cruz Biotechnology, Santa Cruz, CA, U.S.A.) for 36 h at 4°C. The bound primary antibody was then localized by biotinylated anti-rabbit IgG (dilution 1 : 200 in NSS – PBS, Vector, Burlingame, CA, U.S.A.), and subsequently with the avidin – biotin complex (ABC kits; Vector) at room temperature for 1 h each. Visualization of the antigen – antibody reaction sites used 0.033% 3,3′-diaminobenzidine (DAB; Sigma) and 0.014% H2O2 in 0.05 M Tris – HCl buffer for 7 min. The reaction was stopped in PBS.
For Fos and TH double-label immunohistochemistry, brainstem tissue sections from each rat in each treatment group were processed as follows: Fos was revealed with DAB intensified with nickel in the first position, and the enzyme revealed with DAB in the second position. Fos immunohistochemistry was performed as described previously and Fos antibody – peroxidase complex was visualized with a mixture of NiSO4.6H2O (33.2 mg ml−1), DAB (0.033%) and 0.014% H2O2 in 0.175 M sodium acetate solution (pH 7.5). When staining was appropriate, tissue sections were transferred into distilled water (Milli-Q water) to stop the colour reaction. Following the Fos staining, sections were rinsed in PBS twice (15 min each), treated with NSS – PBS for 30 min and then incubated in the mouse monoclonal anti-TH antibody (dilution 1 : 6000 in NSS – PBS; LNC1, Diasorin, Stillwater, MN, U.S.A.) overnight. The same immunohistochemistry procedures described above were followed except that horse anti mouse IgG (1 : 400, 1 h; Vector) was used as a secondary antibody. The TH antibody – peroxidase complex was stained in 0.033% DAB and 0.014% H2O2 in 0.05 M Tris – HCl buffer. The reaction was stopped in PBS. The sections were mounted onto glass slides coated with gelatine, air dried, dehydrated through graded alcohols, cleared in xylene and cover-slipped with DPX.
Quantification of Fos – IR
Evidence of Fos-like immunoreactivity (Fos – IR) was examined under a light microscope. Density of Fos-like immunopositive nuclei was performed with a computer-assisted image analysis system as described previously (Laorden et al., 2000a). This system consist of a Axioskop microscopy (Carl Zeiss, Germany) connected to a videocamera and a Imco 10 computer (Kontron Instrument Ltd., Bildanalyse, Germany) with Microm Image Processings software (Microm, Spain). The sections of each nuclei showing the highest level of Fos – IR were selected for quantitative image analysis. A square field (93.5 μm side) was superimposed upon the captured image (×40 magnification) to be used as reference area. The area of Fos-immunolabelling included in this square was used for estimating the immunoreactivity, and the percentage of Fos – IR was evaluated by means a division of the Fos immunoreactivity area per reference area, which is a square field (93.5 μm side). Based on orientation criteria, the medial parvicellular neurosecretory portion of the PVN was defined once having identified adjacent boundaries of the posterior magnocellular and periventricular parts (Swanson & Simmons, 1989). For this nucleus, density of Fos-like immunopositive nucleus at 3 – 4 rostrocaudal levels encompassing the parvicellular zone, the primary location of tubero-infundibular corticotropin-releasing factor (CRF) cells, was used for estimating Fos – IR. The percentage of Fos – IR of both the right and left sides of 3 – 4 correlative sections for each hypothalamic nuclei was averaged per animal. For the NTS-A2 and VLM – A1, the right and left sites of 5 – 6 sections of each were analysed and averaged per rat. Measures were also averaged in each experimental group for the PVN, SON, VLM-A1 and NTS-A2.
Quantification of Fos positive TH neurons
Nuclei positive for Fos immunoreactivity were detected using the same conventional light microscopy described above, and counted at ×20 magnification. Fos-positive TH cells were identified as cells with brown cytoplasmic deposits for TH-positive staining and blue – dark nuclear staining for Fos. A square field (260 μm side) was superimposed upon captured image to be used as reference area. The number of single- and double-labelled TH neurons observed bilaterally were counted in four to five sections from each animal in the NTS-A2 and the VLM-A1. Because TH positive neurons could only be counted as Fos positive if the nucleus was visible, the TH positive cells without a visible nucleus were excluded from the analysis. Data from Fos – TH double-labelled cells from NTS and VLM were expressed as the percentage of Fos-positive TH cells.
Drugs
Pellets of morphine base (Alcaliber Labs., Madrid, Spain) or lactose were prepared by the Department of Pharmacy and Pharmaceutic Technology (School of Pharmacy, Granada, Spain); Naloxone HCl (Sigma Chemical Co., St. Louis, MO, U.S.A.) and morphine HCl (Alcaliber Labs.) were dissolved in sterile 0.9% NaCl (saline) and administered in volumes of 0.10 ml 100 g−1 and 0.15 ml 100 g−1 body weight, respectively.
Statistical analysis
All values are expressed as means±s.e.mean. Data were analysed by analysis of variance (ANOVA) followed by the Newman – Keul's post hoc test. Two-tailed Student's t-test was used in the experiments in which two groups of animals were being monitored (control and experimental group). Differences with a P value less than 0.05 were considered significant.
Results
Administration of naloxone (5 mg kg−1 s.c.) to control rats did not significantly change the body weight when measured 30 min after the drug injection, as compared to control rats receiving saline s.c. (5.1±0.6 g vs 5.0±0.3 g; t-test). However, chronic morphine-treated animals showed a significant weight loss after naloxone injection (18.0±0.6 g) compared (t-test) with the morphine-pelleted group injected with saline (4.9±0.7 g) or placebo-pelleted group injected with naloxone (P<0.001; t-test). In addition, all animals undergoing morphine withdrawal displayed characteristic abstinence symptoms: wet dog-shakes, teeth chattering, tremor, piloerection, lacrimation, rhinorrea, ptosis, and spontaneous jumping. Signs of withdrawal were not observed in the placebo group receiving saline or naloxone. In addition, rats implanted with pellets of morphine receiving saline did not show any signs of abstinence.
Fos expression in hypothalamic nuclei after acute and chronic morphine administration
As stated earlier, quantitative analysis of labelling in the PVN was restricted to the parvicellular subdivision. In agreement with our previous investigations using the same anti-Fos serum (Laorden et al., 2000a), little but detectable Fos-IR was observed in the PVN and SON from control animals that received i.p. injection of isotonic saline vehicle. As previously reported (Laorden et al., 2000a), present data show that acute stimulation of μ-opioid receptor by morphine injection (30 mg kg−1 i.p.) elicited a significant increase in Fos – IR in the parvocellular (CRF- and AVP-containing) subdivision of the PVN (5.3±1.2; P<0.001) and within the SON (3.9±0.8; P<0.01) compared with control rats receiving saline (1.5±0.1; 2.0±0.1, respectively).
Fos – IR in the PVN and SON from morphine-dependent rats given saline s.c. was not different from that found in the PVN and SON of naïve rats given saline s.c. or naloxone (5 mg kg−1 s.c.). However, compared with the rats pretreated with placebo and injected acutely with morphine, there was a significant decrease (P<0.001; t-test) in Fos – IR after administration of saline on day 8 to the rats dependent on morphine (PVN: 0.52±0.03; SON: 1.71±0.20), indicating the development of tolerance to the Fos – IR-increasing action of the μ-agonist.
Fos expression in hypothalamic nuclei after morphine withdrawal
Rats rendered dependent on morphine and injected with naloxone (5 mg kg−1 s.c.) showed extensive induction of nuclear Fos – IR in the PVN (Figure 1D). Similarly, the SON from morphine withdrawn rats showed a large number of Fos – IR cells (Figure 2D). Quantitative analysis showed that the Fos – IR in the parvocellular part of the PVN and in the SON from morphine withdrawn rats was significantly greater (P<0.001) than that of the naïve animals given naloxone or the dependent group injected with saline s.c. (Figure 3A,B). The Fos – IR in the PVN and SON of placebo-pelleted rats given saline s.c. was not different from that found in the PVN and SON, respectively, of placebo rats given naloxone (Figures 1, 2 and 3).
Figure 1.
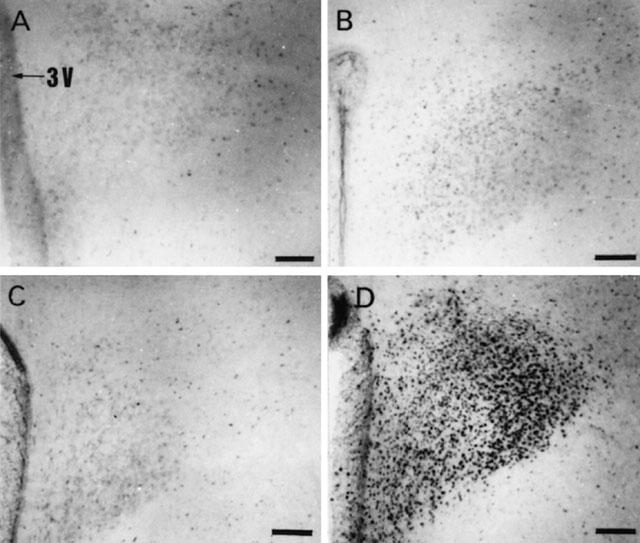
Representative photomicrographs of Fos immunoreactivity in the PVN 90 min after saline (s.c.) or naloxone (5 mg kg−1 s.c.) administration to rats pretreated with placebo or morphine pellets. (A) placebo+saline, (B) placebo+naloxone, (C) morphine+saline and (D) morphine+naloxone. Scale bar, 111 μm. 3V: third ventricle.
Figure 2.
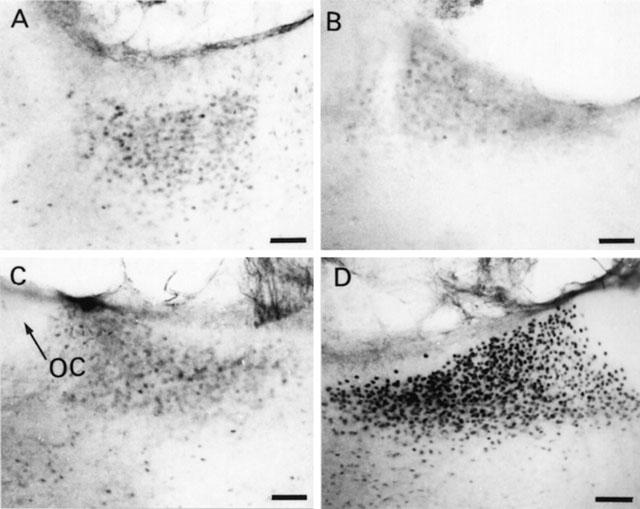
Representative photomicrographs of Fos immunoreactivity in the SON 90 min after saline (s.c.) or naloxone (5 mg kg−1 s.c.) administration to rats pretreated with placebo or morphine pellets. (A) placebo+saline, (B) placebo+naloxone, (C) morphine+saline and (D) morphine+naloxone. Scale bar, 87 μm. OC: optic chiasm.
Figure 3.
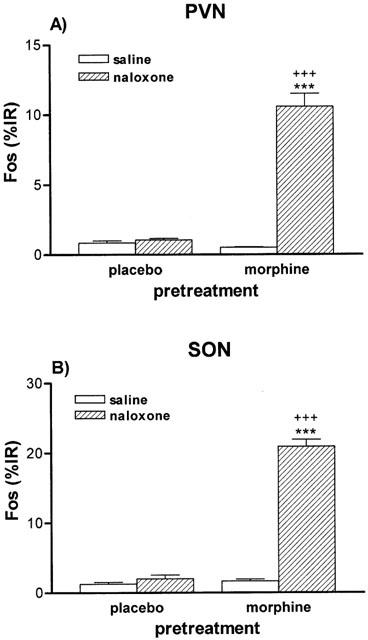
Quantitative analysis of Fos immunoreactivity (IR) in the PVN (A) and SON (B) 90 min after saline (s.c.) or naloxone (s.c.) administration to rats pretreated with placebo or morphine pellets. ***P<0.001 vs morphine+saline; +++P<0.001 versus placebo+naloxone. n=4 – 6 per group.
Effects of acute and chronic morphine administration on Fos expression in the brainstem
Quantitative analysis of labelling in the NTS – A2 and VLM – A1 was confined to coronal sections that included the rostrocaudal extent from AP to obex, the level at which catecholaminergic neurons are predominantly noradrenergic (Cunningham & Sawchenko, 1988).
In control rats injected with saline, few neurons with Fos – IR were found in the NTS – A2 (0.59±0.01). Acute administration of morphine (30 mg kg−1 i.p.) led to significant (P<0.01; t-test) increases in Fos – IR (1.44±0.01). The Fos – IR in the NTS – A2 from morphine dependent rats receiving saline was significantly (P<0.001; t-test) lower (0.42±0.05) than that found in placebo rats acutely injected with morphine, indicating the development of tolerance towards the Fos – IR-increasing action of the μ-opioid receptor agonist.
Stimulation of opioid receptors by acute morphine injection elicited a significant (P<0.01) increase in the Fos – IR (2.03±0.2) in the VLM – A1 region compared with control rats receiving saline i.p. (0.62±0.04). Fos – IR in this cell group from morphine dependent animals given saline s.c. on day 8 was not different from that found in naïve rats also receiving saline s.c. However, compared with placebo-pelleted rats injected acutely with morphine, there was a significant decrease (P<0.001; t-test) in Fos – IR after administration of saline s.c. on day 8 to rats dependent on morphine (0.55±0.01), indicating the development of tolerance to the Fos – IR-increasing action of the μ-agonist.
Effects of morphine withdrawal on Fos expression in the A1 and A2 cell groups
The majority of activated neurons (Fos positive) in the caudal medulla were clustered in the NTS and VLM. As Figure 4D depicts, rats dependent on morphine given naloxone showed induction of Fos – IR in the NTS. Similarly, the VLM from morphine withdrawn rats showed Fos positive cells (Figure 5B). Quantitative analysis indicated that there was a significant increase (P<0.001) in Fos – IR in the NTS in morphine withdrawn rats when compared with that observed in placebo animals receiving saline instead naloxone (Figure 6A). However, Fos – IR in morphine dependent rats given saline s.c. was not different from that found in naïve animals receiving saline s.c. or naloxone (5 mg kg−1 s.c.). Quantitative analysis demonstrated that administration of naloxone to morphine-pelleted animals led to a significant increase (P<0.001) in Fos – IR compared with the VLM from the corresponding control placebo-pelleted animals treated with naloxone, or with that in the dependent group receiving saline (Figure 6B). However, Fos – IR in morphine dependent rats given saline s.c. was not different from that found in naïve animals receiving saline s.c. or naloxone (5 mg kg−1 s.c.).
Figure 4.
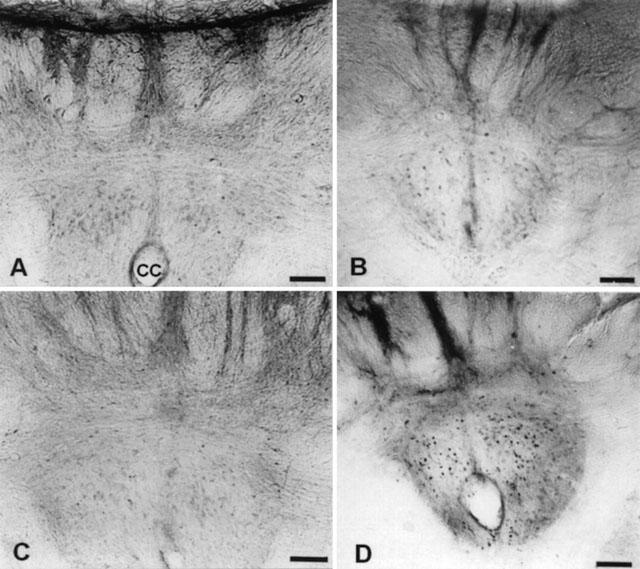
Fos immunoreactivity in the NTS – A2 cell group in morphine naïve and dependent rats treated with saline (s.c.) or naloxone (5 mg kg−1 s.c.). The microphotographs show coronal sections through the brainstem posterior to the area postrema from rats pretreated with placebo+saline (A), placebo+naloxone (B), morphine+saline (C) or morphine+naloxone (D). Scale bar, 118 μm. CC, central canal.
Figure 5.
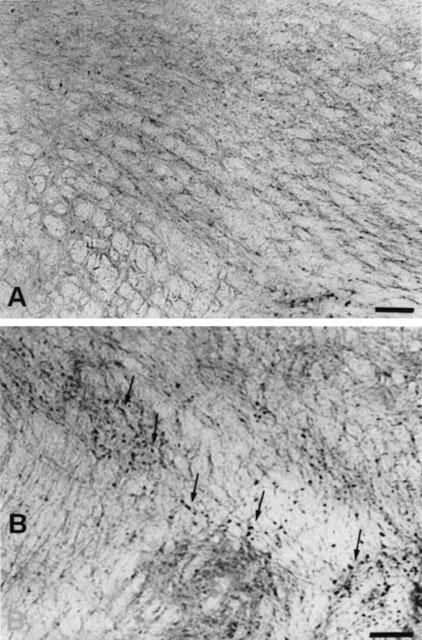
Fos immunoreactivity in the VLM-A1 cell group in morphine naive (A) and dependent rats (B). Photomicrographs of coronal sections posterior to the area postrema from rats pretreated with placebo (A) or morphine (B) pellets that were given with naloxone (5 mg kg−1 s.c.). Neurons positive for Fos-IR are marked by arrows. Scale bar, 118 μm.
Figure 6.
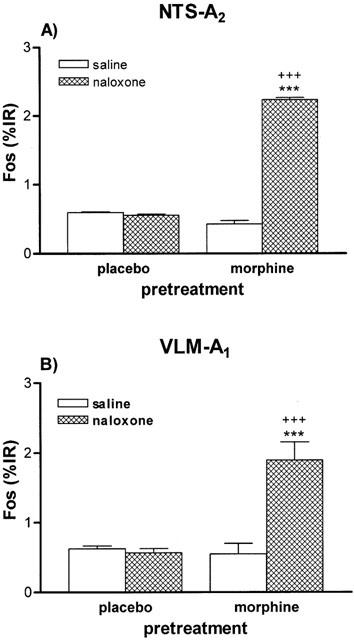
Quantitative analysis of Fos immunoreactivity (IR) in the A2 (A) and A1 (B) cell groups 90 min after saline or naloxone (5 mg kg−1 s.c.) administration to rats pretreated with placebo or morphine pellets. ***P<0.001 vs morphine+saline; +++P<0.001 vs placebo+naloxone. n=4 – 6 per group.
Effects of chronic morphine and naloxone-precipitated morphine withdrawal on Fos expression in catecholaminergic A1 and A2 cell groups
The NTS – A2 and VLM – A1 have substantial population of noradrenergic neurons. To determine the specificity and magnitude of morphine withdrawal activation of catecholaminergic neurons that innervate the PVN and SON, sections of the NTS – A2 and VLM-A1 cell groups were immunohistochemically double-labelled for both Fos and the rate-limiting catecholaminergic biosynthetic enzyme, TH. Figure 7 depicts the staining pattern of Fos-positive TH neurons in both regions from control rats and from dependent animals after naloxone injection (morphine withdrawal). Figure 8 shows the percentage of TH containing neurons expressing Fos, as a function of the treatment. In morphine dependent rats, both regions exhibited significant (P<0.001) increase in the percentage of TH-containing cells expressing Fos in response to naloxone injection. By contrast, dependent rats receiving saline instead naloxone showed no modification in Fos-positive TH neurons, compared with basal expression.
Figure 7.

Representative photomicrographs of double-labelled cells in the NTS-A2 (A, B) and VLM-A1 (C, D). Double immunohistochemical staining for Fos (black nuclear staining) and TH (cytoplasm) in sections from placebo control rats injected with naloxone (A and C) and from rats subject to morphine withdrawal (B and D). Fos-positive catecholaminergic cells were seen in the two groups, but naloxone-induced morphine withdrawal resulted in a large increase of Fos+/TH+ neurons. Arrows, Fos+/TH+ neurons. Open arrow, TH+ neuron, arrowhead, Fos+ nuclei Scale bar: 46 μm.
Figure 8.
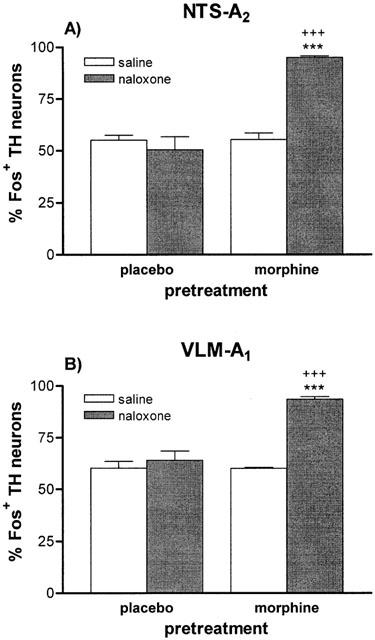
Effects of morphine withdrawal on Fos expression in TH-positive neurons in NTS-A2 (A) and VLM-A1 (B). The data are expressed as the percent of Fos-positive TH cells. ***P<0.001 vs morphine+saline; +++P<0.001 vs placebo+naloxone. n=4 – 6 per group.
Discussion
According to previous results from this laboratory and others (Gutstein et al., 1998; Laorden et al., 2000a), the present immunohistochemical study shows that the acute administration of morphine induces the neuronal expression of Fos protein within neurons of the parvocellular division of the PVN, which regulates the hypothalamus – pituitary – adrenal (HPA) axis, and in hypothalamic nuclei adjacent to the PVN, such as SON, which is also implicated in neuroendocrine functions (Blake et al., 1996). Concomitantly, an increase in Fos production was seen in the A1 and A2 cell groups, which indicates that hypothalamic nuclei are activated after opioid administration concomitantly with an activation of the brainstem noradrenergic regions that innervate those nuclei. The parvocellular neurosecretory neurons of the hypothalamic PVN serve as the origin of a cascade of events by delivering the two main corticotropin releasing factor, CRF and arginine vasopressin (AVP), resulting in the ACTH-mediated release of corticosterone. A primary component of the rat response to acutely administered μ-opioid agonists is known to involve activation of the HPA axis, which is the consequence of an increased NA turnover in the PVN (Pechnick, 1993; Milanés et al., 1997; Fuertes et al., 2000b). Chronic exposure to these agonists results in the development of tolerance to opioid-induced both endocrine secretion and increase in NA turnover (Milanés et al., 1997; Fuertes et al., 2000b). The induction of IEG, in particular c-fos, has been widely used as an indicator of cellular activity in the central nervous system (Morgan & Curran, 1991). Therefore, the Fos production within the parvocellular PVN can be taken as an index of the HPA axis activity and as an indicator of the degree of activation of the medial parvocellular cell populations, as has been proposed previously (Swanson et al., 1983; Li & Sawchenko, 1998; Dayas et al., 1999). Present data also demonstrate that tolerance develops towards the activation of Fos protein induced by morphine in both the hypothalamic nuclei and the NTS – A2 and VLM – A2. Our results are consistent with previous findings, using immunocytochemical staining of Fos, showing that chronic exposure to morphine attenuates the cellular responsiveness to this opioid agonist in hypothalamic nuclei (Chang et al., 1996). Taken together, these results could indicate that the alteration in transcription factors after opioids could be involved in the cellular adaptive changes in the hypothalamic neurosecretory neurons that control the HPA axis activity.
Morphine withdrawal induces a state of neuronal hyperexcitability in the brain which has been linked to alteration in a number of second messenger systems. These changes may underlie altered mRNA levels of IEGs in different brain areas of the central nervous system (Blendy & Maldonado, 1998). Present results show that morphine withdrawal induce the neuronal expression of Fos protein within neurons of the parvocellular division of the PVN and in the SON. Currently, the consequences of Fos expression in these nuclei are uncertain. Elevation of Fos in the PVN could contribute to the expression of target genes within this nucleus. Previous studies from our laboratory have demonstrated that morphine withdrawal induces changes in the CRF content in the PVN correlated with simultaneous changes in plasma corticosterone concentration (Milanés et al., 1998). Genes encoding hypothalamic neuropeptides or neurotransmitter, which contain AP-1 sites in their promoter regions (e.g. AVP), could be putative target of c-fos mediated gene expression in the PVN and SON induced by morphine withdrawal (Kovács, 1998). In addition, CRF has also been suggested as a potential target of AP-1 transcription factor, and it has been proposed a role for c-fos modulating the gene expression for that neuropeptide (Imaki et al., 1992). Although there is an apparent absence of the AP-1 binding site in the promoters of the oxytocin and CRF gene, it has been proposed that the link between c-fos induction and CRF and oxytocin gene (in the PVN and SON, respectively) regulation might be indirectly through other genes or transcription factors (Costa et al., 1999).
The exact neurocircuitry involved in the effects of opioids on the HPA axis has not been clarified, and little information is available regarding the functional adaptive changes of catecholaminergic afferents innervating the PVN during chronic opioid exposure and upon drug withdrawal. The present study shows that, concurrently with increased activity of PVN and SON neurons, as determined by c-fos expression, morphine withdrawal induced an increase in Fos production in brainstem sites that project to these hypothalamic nuclei, including the A1 and A2 noradrenergic cell groups in the VLM and NTS, respectively. Furthermore, the present study revealed an enhanced Fos expression in catecholaminergic neurons in the A2 and A1 cell groups after naloxone-induced morphine withdrawal. These results are in agreement with previous studies showing morphine-withdrawal excitation in the A1 and A2 cell groups (Murphy et al., 1997). Previous anatomical and electrophysiological data have implicated a number of forebrain regions in the regulatory control of the HPA axis, including the A1, A2 and, to a lesser extent, the A6 noradrenergic neurons (Sawchenko & Swanson, 1983; Plotsky, 1987; Cunningham & Sawchenko, 1988; Everitt et al., 1992). The hypothalamus contains high concentrations of NA, and the parvocellular PVN and the SON are densely innervated by noradrenergic afferents from the medulla oblongata. The A2 inputs are most heavily distributed in the parvocellular part of the PVN, a region rich in CRF and AVP cells, whereas both the A1 and A2 groups innervate the SON (Sawchenko & Swanson, 1982; Cunningham & Sawchenko, 1988; Daftary et al., 2000). On the other hand, NA synapses have been founded to contact CRF neurons directly (Itoi et al., 1994). Together, all these data suggest that morphine withdrawal may activate populations of noradrenergic neurons that innervate the PVN and SON.
Support for a role for noradrenergic pathways in morphine withdrawal-induced HPA axis hyperactivity has come from recent studies from our laboratory which have demonstrated that morphine withdrawal increases the turnover of NA in the rat PVN concomitantly with an enhanced corticosterone secretion and a decrease in CRF content (Vargas et al., 1997; Milanés et al., 1998; Fuertes et al., 2000a). These effects were dependent on adrenoceptor activation, which indicates that the hyperactivity of the axis during morphine withdrawal is mediated via a stimulatory noradrenergic pathway (Laorden et al., 2000b). These findings are consistent with the results obtained in the present study, which revealed an increase in Fos expression in PVN- and SON-projecting catecholaminergic neurons in the A1 and A2 cell groups, further implicating these catecholaminergic pathway in the neuroendocrine effects of morphine withdrawal. It has been demonstrated the critical importance of the AP-1 site in regulating constitutive and enhanced expression of the TH gene (Gizang & Ziff, 1994). In addition, the TH promoter is strongly activated by Fos (Ghee et al., 1998). Therefore, present results suggest the existence of a possible link between Fos induction in NTS/VLM and a noradrenergic hyperactivity after naloxone precipitated morphine withdrawal.
In summary, our results show that activation of opioid receptor by morphine triggers the expression of c-fos in hypothalamic nuclei, particularly in parvocellular region of the PVN, which confirms that opioids activate neurosecretory neurons implicated in the activity of the HPA axis. This effect was accompanied by an increase in Fos – IR in the NTS – A2 and VLM – A1 noradrenergic cell groups. Present data demonstrate that tolerance develops towards the increasing c-fos expression induced by morphine. In addition, Fos – IR was increased after morphine withdrawal in the PVN and SON in parallel to an increase in Fos production in the noradrenergic neuronal groups in the brainstem, which project to hypothalamic nuclei. Furthermore, NTS – A2 and VLM – A1 exhibited significant increases in the percentage of TH containing-neurons expressing Fos in response to morphine withdrawal, which indicate an activation of catecholaminergic neurons in both areas. Present results add support to the conclusion that morphine withdrawal is accompanied by activation of noradrenergic neurons, which innervate the PVN and SON. The results of the present work give additional information about the cellular events that occur in the hypothalamus and brainstem after opioid withdrawal and may contribute to understand why withdrawal from morphine induces a stimulatory effects on the pituitary – adrenal axis.
Acknowledgments
This work was supported by DGICYT (Grants PM 96-0095; PM 99-0140) and CICYT SAF 99-0047.
Abbreviations
- HPA
hypothalamo-pituitary-adrenocortical axis
- IR
immunoreactivity
- NTS-A2
nucleus tractus solitarius-A2
- TH
tyrosine hydroxylase
- VLM-A1
ventrolateral medulla-A1
References
- BECKMANN A.M., MATSUMOTO I., WILCE P.A. Immediate early gene expression during morphine withdrawal. Neuropharmacology. 1995;34:1183–1189. doi: 10.1016/0028-3908(95)00089-o. [DOI] [PubMed] [Google Scholar]
- BLAKE A.D., BOT G., REISINE T. Structure-function of the cloned opiate receptors: peptide and small molecule interactions. Chemistry Biology. 1996;3:967–972. doi: 10.1016/s1074-5521(96)90163-5. [DOI] [PubMed] [Google Scholar]
- BLENDY J.A., MALDONADO R. Genetic analysis of drug addiction: the role of cAMP response element binding protein. J. Mol. Med. 1998;76:104–110. doi: 10.1007/s001090050197. [DOI] [PubMed] [Google Scholar]
- CHANG S.L., PATEL N.A., ROMERO A.A., THOMPSON J., ZADINA J.E. FOS expression induced by interleukin-1 or acute morphine treatment in the rat hypothalamus is attenuated by chronic exposure to morphine. Brain Res. 1996;736:227–236. doi: 10.1016/0006-8993(96)00698-1. [DOI] [PubMed] [Google Scholar]
- COSTA A.P.C., DE LA RIVA C., GUEVARA-GUZMAN R., KENDRICK K.M. C-fos and c-jun in the paraventricular nucleus play a role in regulating peptide gene expression, oxytocin and glutamate release, and maternal behaviour. Eur. J. Neurosci. 1999;11:2199–2210. doi: 10.1046/j.1460-9568.1999.00637.x. [DOI] [PubMed] [Google Scholar]
- CUNNINGHAM E.T., SAWCHENKO P.E. Anatomical specificity of noradrenergic inputs to the paraventricular and supraoptic nuclei of the rat hypothalamus. J. Comp. Neurol. 1988;274:60–76. doi: 10.1002/cne.902740107. [DOI] [PubMed] [Google Scholar]
- CURRAN E., AKIL H., WATSON S. Psychomotor stimulant- and opiate-induced c-fos mRNA expression patterns in the rat forebrain: comparisons between acute drug treatment and a drug challenge in sensitized animals. Neurochem. Res. 1996;21:1425–1435. doi: 10.1007/BF02532384. [DOI] [PubMed] [Google Scholar]
- DAFTARY S.S., BOUDABA C., TASKER J.G. Noradrenergic regulation of parvocellular neurons in the rat hypothalamic paraventricular nucleus. Neuroscience. 2000;96:743–751. doi: 10.1016/s0306-4522(00)00003-8. [DOI] [PubMed] [Google Scholar]
- DAYAS C.C., BULLER K.M., DAY T.A. Neuroendocrine responses to an emotional stressor: evidence for involvement of the medial but not the central amygdala. Eur. J. Neurosci. 1999;11:2312–2322. doi: 10.1046/j.1460-9568.1999.00645.x. [DOI] [PubMed] [Google Scholar]
- EVERITT B.J., MEISTER B., HÖKFELT T.The organization of monoaminergic neurons in the hypothalamus in relation to neuroendocrine integration Neuroendocrinology 1992Boca Raton: CRC Press; 87–127.ed. Nemeroff, C.B. pp [Google Scholar]
- FRANKEL P.S., HARLAN R.E., GARCIA M.M. Chronic administration of morphine alters immediate-early gene expression in the forebrain of post-dependent rats. Brain Res. 1999;835:204–212. doi: 10.1016/s0006-8993(99)01579-6. [DOI] [PubMed] [Google Scholar]
- FUERTES G., LAORDEN M.L., MILANÉS M.V. Noradrenergic and dopaminergic activity in the hypothalamic paraventricular nucleus after naloxone-induced morphine withdrawal. Neuroendocrinology. 2000a;71:60–67. doi: 10.1159/000054521. [DOI] [PubMed] [Google Scholar]
- FUERTES G., MILANÉS M.V., RODRÍGUEZ-GAGO M., MARÍN M.T., LAORDEN M.L. Changes in hypothalamic paraventricular nucleus catecholaminergic activity after acute and chronic morphine administration. Eur. J. Pharmacol. 2000b;388:49–56. doi: 10.1016/s0014-2999(99)00829-8. [DOI] [PubMed] [Google Scholar]
- GHEE M., BAKER H., MILLER J.C., ZIFF E.B. AP-1, CREB and CBP transcription factors differentially regulate the tyrosine hydroxylase gene. Mol. Brain Res. 1998;55:101–114. doi: 10.1016/s0169-328x(97)00370-7. [DOI] [PubMed] [Google Scholar]
- GIZANG E., ZIFF E.B. Fos family members successively occupy the tyrosine hydroxylase gene AP-1 site after nerve growth factor or epidermal growth factor stimulation and can repress transcription. Mol. Endocrinol. 1994;8:249–262. doi: 10.1210/mend.8.2.7909583. [DOI] [PubMed] [Google Scholar]
- GONZÁLVEZ M.L., MILANÉS M.V., MARTÍNEZ-PIÑERO M.G., MARÍN M.T., VARGAS M.L. Effects of intracerebroventricular clonidine on the hypothalamic noradrenaline and plasma corticosterone levels of opiate naïve rats and after naloxone-induced withdrawal. Brain Res. 1994;647:199–203. doi: 10.1016/0006-8993(94)91318-8. [DOI] [PubMed] [Google Scholar]
- GUTSTEIN H.B., THOME J.L., FINE J.L., WATSON S.J., AKIL H. Pattern of c-fos mRNA induction in rat brain by acute morphine. Can. J. Physiol. Pharmacol. 1998;76:294–303. [PubMed] [Google Scholar]
- HUGHES P., DRAGUNOW M. Induction of immediate-early genes and the control of neurotransmitter-regulated gene expression within the nervous system. Pharmacol. Rev. 1995;47:133–178. [PubMed] [Google Scholar]
- IGNAR D.M., KUHN C.M. Effects of specific Mu and Kappa opiate tolerance and abstinence on hypothalamo-pituitary-adrenal axis secretion in the rat. J. Pharmacol. Exp. Ther. 1990;255:1287–1295. [PubMed] [Google Scholar]
- IMAKI T., SHIBASAKI T., HOTTA M., DEMURA H. Early induction of c-fos precedes increased expression of corticotropin-releasing factor mRNA in the paraventricular nucleus after immobilization stress. Endocrinology. 1992;131:240–246. doi: 10.1210/endo.131.1.1612001. [DOI] [PubMed] [Google Scholar]
- ITOI K., SUDA T., TOZAWA F., DOBASHI I., OHMORI N., SAKAI Y., ABE K., DEMURA H. Microinjection of norepinephrine into the paraventricular nucleus of the hypothalamus stimulates corticotropin-releasing factor gene expression in conscious rats. Endocrinology. 1994;135:2177–2182. doi: 10.1210/endo.135.5.7956940. [DOI] [PubMed] [Google Scholar]
- KOVÁCS K. c-Fos as a transcription factor: a stressful (re)view from a functional map. Neurochem. Int. 1998;33:287–297. doi: 10.1016/s0197-0186(98)00023-0. [DOI] [PubMed] [Google Scholar]
- LAORDEN M.L., CASTELLS M.T., MARTÍNEZ M.D., MARTÍNEZ P.J., MILANÉS M.V. Activation of c-fos expression in hypothalamic nuclei by mu- and kappa-receptor agonists. Correlation with catecholaminergic activity in the hypothalamic paraventricular nucleus. Endocrinology. 2000a;141:1366–1376. doi: 10.1210/endo.141.4.7407. [DOI] [PubMed] [Google Scholar]
- LAORDEN M.L., FUERTES G., GONZÁLEZ-CUELLO A., MILANÉS M.V. Changes in catecholaminergic pathways innervating paraventricular nucleus and pituitary-adrenal axis response during morphine dependence: implication of α1- and α2-adrenoceptors. J. Pharmacol. Exp. Ther. 2000b;293:578–584. [PubMed] [Google Scholar]
- LI H.Y., SAWCHENKO P.E. Hypothalamic effector neurons and extended circuitries activated in ‘neurogenic' stress: a comparison of footshock effects exerted acutely, chronically, and in animals with controlled glucocorticoids levels. J. Comp. Neurol. 1998;393:244–266. [PubMed] [Google Scholar]
- MILANÉS M.V., LAORDEN M.L., CHAPLEUR-CHATEAU M., BURLET A. Differential regulation of corticotropin-releasing factor and vasopressin in discrete brain regions after morphine administration: correlations with hypothalamic noradrenergic activity and pituitary-adrenal response. Naunyn-Schmiedeberg's Arch. Pharmacol. 1997;356:603–610. doi: 10.1007/pl00005096. [DOI] [PubMed] [Google Scholar]
- MILANÉS M.V., LAORDEN M.L., CHAPLEUR-CHATEAU M., BURLET A. Alterations in corticotropin-releasing factor and vasopressin content in rat brain during morphine withdrawal. Correlation with hypothalamic noradrenergic activity and pituitary-adrenal response. J. Pharmacol. Exp. Ther. 1998;285:700–706. [PubMed] [Google Scholar]
- MORGAN J.I., CURRAN T. Stimulus-transcription coupling in the nervous system: involvement of the inducible proto-oncogenes fos and jun. Ann. Rev. Neurosci. 1991;14:421–451. doi: 10.1146/annurev.ne.14.030191.002225. [DOI] [PubMed] [Google Scholar]
- MURPHY N.P., ONAKA T., BROWN C.H., LENG G. The role of afferent inputs to supraoptic nucleus oxytocin neurons during naloxone-precipitated morphine withdrawal in the rat. Neuroscience. 1997;80:567–577. doi: 10.1016/s0306-4522(97)00142-5. [DOI] [PubMed] [Google Scholar]
- NESTLER E.J., AGHAJANIAN G.K. Molecular and cellular basis of addiction. Science. 1997;278:58–63. doi: 10.1126/science.278.5335.58. [DOI] [PubMed] [Google Scholar]
- PALKOVITS M., BROWNSTEIN M.J. Maps and guide to microdissection of the rat brain. New York: Elsevier; 1988. [Google Scholar]
- PAXINOS G., WATSON C. The rat brain in stereotaxic coordinates. San Diego: Academic Press; 1998. [DOI] [PubMed] [Google Scholar]
- PECHNICK R.N. Effects of opioids on the hypothalamo–pituitary – adrenal axis. Ann. Rev. Pharmacol. Toxicol. 1993;32:353–382. doi: 10.1146/annurev.pa.33.040193.002033. [DOI] [PubMed] [Google Scholar]
- PLOTSKY P.M. Facilitation of immunoreactive corticotropin-releasing factor secretion into the hypophysial-portal circulation after activation of catecholaminergic pathways or central norepinephrine injection. Endocrinology. 1987;121:924–930. doi: 10.1210/endo-121-3-924. [DOI] [PubMed] [Google Scholar]
- SAWCHENKO P.E., SWANSON L.W. The organization of noradrenergic pathways from the brainstem to the paraventricular and supraoptic nuclei in the rat. Brain Res. Rev. 1982;4:275–325. doi: 10.1016/0165-0173(82)90010-8. [DOI] [PubMed] [Google Scholar]
- SAWCHENKO P.E., SWANSON L.W. The organization of forebrain afferents to the paraventricular and supraoptic nuclei of the rat. J. Comp. Neurol. 1983;218:124–144. doi: 10.1002/cne.902180202. [DOI] [PubMed] [Google Scholar]
- SWANSON L.W., SAWCHENKO P.E., RIVIER J., VALE W.W. Organization of ovine corticotropin-releasing factor immunoreactive cells and fibers in the rat brain: an immunocitochemical study. Neuroendocrinology. 1983;36:165–186. doi: 10.1159/000123454. [DOI] [PubMed] [Google Scholar]
- SWANSON L.W., SIMMONS D.M. Differential steroid hormone and neural influences on peptide mRNA levels in CRH cells of the paraventricular nucleus: a hybridization histochemical study in the rat. J. Comp. Neurol. 1989;285:413–435. doi: 10.1002/cne.902850402. [DOI] [PubMed] [Google Scholar]
- VARGAS M.L., MARTÍNEZ-PIÑERO M.G., MILANÉS M.V. Neurochemical activity of noradrenergic neurons and pituitary-adrenal response after naloxone-induced withdrawal: the role of calcium channels. Naunyn-Schmiedeberg's Arch. Pharmacol. 1997;355:501–506. doi: 10.1007/pl00004975. [DOI] [PubMed] [Google Scholar]