Abstract
Several biologically active derivatives of the cardiotonic steroid ouabain have been made containing NMR isotopes (13C, 2H, and 19F) in the rhamnose sugar and steroid moieties, and examined at the digitalis receptor site of renal Na+/K+-ATPase by a combination of solid-state NMR methods. Deuterium NMR spectra of 2H-labeled inhibitors revealed that the sugar group was only loosely associated with the binding site, whereas the steroid group was more constrained, probably because of hydrogen bonding to residues around the K+-channel region. Crosspolarization magic-angle spinning NMR showed that chemical shifts of inhibitors 13C-labeled in the sugar group moved downfield by 0.5 ppm after binding to the digitalis site, suggesting that the sugar was close to aromatic side groups. A 19F, 13C- rotational-echo double-resonance NMR strategy was used to determine the structure of an inhibitor in the digitalis receptor site, and it showed that the ouabain derivatives adopt a conformation in which the sugar extends out of the plane of the steroid ring system. The combined structural and dynamic information favors a model for inhibition in which the ouabain analogues lie across the surface of the Na+/K+-ATPase α-subunit with the sugar group facing away from the surface of the membrane but free to move into contact with one or more aromatic residues.
The Na+/K+-ATPase is found in the cells of higher eukaryotic organisms and is the well-known pharmacological receptor for digitalis compounds, including the cardiac glycosides (1, 2). Cardiac glycosides such as ouabain are plant-derived steroids that bind to the extracellular face of the Na+/K+-ATPase α subunit with high affinity (kD ≅ 5 nM) and remarkable selectivity, and thereby inhibit nucleotide hydrolysis and ion transport (3). Notwithstanding their toxicity, low levels of digitalis compounds have been used as inotropic drugs for over 200 years and remain a clinically recommended therapy for first-line treatment of congestive heart failure and cardiac arrhythmia.
The Na+/K+-ATPase exchanges three cytosolic Na+ for two extracellular K+, which is facilitated by the 1024-residue catalytic α-subunit and involves what are probably large-scale conformational changes of the protein, exposing, in turn, active sites to ions on each side of the membrane (4, 5). Results of topological analysis suggest that the Na+/K+-ATPase α-subunit contains 10 membrane-spanning regions, H1–H10, which is substantiated by the two-dimensional electron density maps of the homologous Ca2+-ATPase and Neurospora H+-ATPase (6, 7). Affinity labeling experiments and site-directed mutagenesis studies have given information about the digitalis receptor site. These have shown that ouabain interacts with both the N-terminal and C-terminal regions of the α-subunit (8–10) and suggest that the drug may exclude K+ from the ligation site within the membrane-spanning regions H4, H5, H6, and H8 (11, 12). To date, however, there exists no detailed model for cardiac glycoside binding that reconciles both drug structure and binding location.
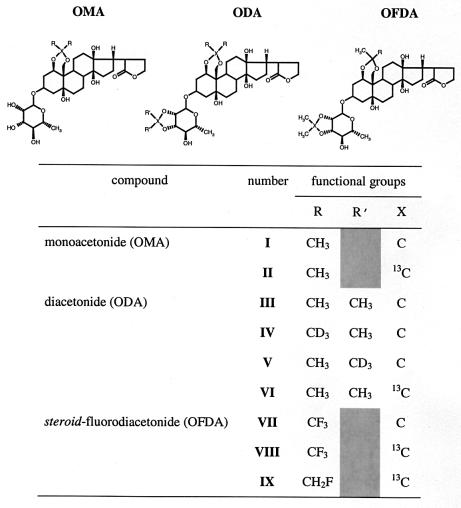
Solid-state NMR spectroscopy has emerged in recent years as a powerful technique for examining the structure and dynamics of small molecules at their binding sites within membrane proteins (13, 14), such as retinal in rhodopsin (15) and inhibitors of the H+/K+-ATPase (16). Here, a number of ouabain derivatives containing NMR-visible reporter groups have been tested for inhibitory activity against renal Na+/K+-ATPase and examined at the digitalis binding site by solid-state NMR methods. Ouabain was modified either by forming an acetonide bridge between two hydroxyl groups in the ouabagenin steroid (ouabain monoacetonide, OMA), by forming acetonide bridges in the steroid and rhamnose sugar moieties (ouabain diacetonide, ODA), or by forming a fluorodiacetonide bridge in the steroid and an acetonide bridge in the sugar group (ouabain fluorodiacetonide, OFDA). Ouabain derivatives (I–IX) containing combinations of NMR-visible isotopes (2H, 13C, and 19F) in the steroid group, the sugar group, or both are shown in Table 1. Isotope labeling enabled us to examine the molecular conformation, dynamics, and location of cardiac glycoside analogues in the native digitalis receptor site.
Table 1.
Chemical structures and numbering system (I–IX) for the acetonide derivatives of ouabain used in these studies, showing the positions of 2H,19F, and 13C isotopes
Materials and Methods
Materials.
Ouabain hexahydrate, fluoroacetone, and [13C]acetone were obtained from Sigma. [3H]Ouabain was purified by chromatography on Na+/K+-ATPase as described by Hansen (17). Na+/K+-ATPase was prepared from pig kidney as described by Jørgensen (18) by using SDS as the activating detergent.
Synthesis of Ouabain Acetonide Derivatives.
OMA, ODA, and OFDA derivatives (I–IX) were synthesized from ouabain (Table 1). Ouabain hexahydrate (0.05 g) was dissolved in acetone (1 ml), and copper sulfate (0.2 g) was added. The solution was stirred in a sealed flask in the dark at room temperature. After 2 days, TLC (3:1 ethyl acetate-methanol) confirmed that all of the starting material had reacted and two products had formed in an approximate ratio of 1:1, with Rf values of 0.5 and 0.75. The solution was filtered to remove copper sulfate and the filtrate evaporated to dryness. The mixture was dissolved in methanol and purified by silica chromatography using 3:1 ethyl acetate-methanol as the eluting solvent. The two products were identified as OMA (II) (0.025 g; 58%) and ODA (III) (0.016 g; 35%) by NMR and mass spectrometry.
The deuterated compound [steroid-2H6]ODA (IV) was prepared as described above using 1 ml [2H6]acetone with the following modification. When the starting material had all converted to the [steroid-2H6]OMA, the product was isolated and dissolved in a suspension of 0.2 g copper sulfate and 1 ml acetone. The reaction proceeded as above until the diacetonide had fully formed. Synthesis of [rhamnoside-2H6]ODA (V) was carried out similarly, but using acetone as the starting solvent and then dissolving the monoacetonide in [2H6]acetone. Synthesis of the 13C-labeled OFDA compounds [rhamnoside-13C,steroid-19F3]OFDA (VIII) and [rhamnoside-13C,steroid-19F]OFDA (IX) was carried out as for [steroid-2H6]ODA, substituting fluoroacetone in place of [2H6]acetone and [2-13C]acetone in place of acetone.
Na+/K+-ATPase Activity and Ligand Binding.
The specific Na+/K+-ATPase activity was about 1,700 μmol/mg/h at 37°C (see ref. 19 for details).
The inhibitory potencies of ouabain, OMA (I), ODA (III), and OFDA (VII) were determined as the IC50 (the inhibitor concentration causing 50% enzyme inactivation) for ATP hydrolysis. Na+/K+-ATPase (51 μg protein/ml) was preincubated in incubation medium (3 mM MgCl2, 3 mM Pi, 40 mM Tris, pH 7.3) and 0–100 μM of ouabain or diacetonide derivative. After the incubation at 20°C for 60 min, an aliquot was transferred to hydrolytic assay medium, whereby the enzyme and glycoside was diluted 40-fold and incubated for a further 10 min before determining the liberated Pi.
The selectivity and binding affinity of the ouabain derivatives were determined from competition experiments using [3H]ouabain (17). Na+/K+-ATPase membranes (25 μg protein/ml) were added to incubation medium containing 5–280 nM ouabain with 3,000 Bq/ml [3H]ouabain and either I or III to a final concentration of 0–5 μM. The mixture was incubated for 37°C for 3 h and filtered to determine the amount of free ouabain left in the solution. The amount of bound ouabain was calculated as the difference between the radioactivity of the initial incubation medium and the filtrate. Displacement of [3H]ouabain by OMA and ODA was followed by incubating Na+/K+-ATPase (23 μg protein/ml) in incubation medium containing 30 nM [3H]ouabain for 60 min at 37°C. Ouabain, OMA, or ODA was added to a final concentration of 50 μM, and the release of bound [3H]ouabain was followed for up to 25 h by filtration as described above.
Sample Preparation for NMR.
Na+/K+-ATPase membranes (30 mg protein) were prepared as a pellet by centrifugation at 100,000 × g for 30 min at 4°C, resuspended in 1 ml incubation medium, and incubated with 0–300 μM of labeled inhibitor (II, IV–VI, VIII, and IX) for 60 min at 25°C. It was assumed that 1 mg of total protein contained 2.5–3.0 nmol ouabain binding sites (19). The suspension was centrifuged (100,000 × g at 4°C) for 30 min, and the pellet was transferred to a 6-mm external diameter zirconia MAS rotor fitted with Kel-F inserts to confine the sample to the center of the rotor. In some experiments, the membranes were first prepared as a pellet and the desired concentrations of the ouabain derivative were added.
NMR Experiments.
All solid-state NMR experiments were performed on a Varian Infinity spectrometer operating at a magnetic field of 11.7 T at temperatures between 5°C and −50°C.
Wide-line 2H NMR experiments were carried out in a probe-head fitted with single-tuned 7-turn 5-mm coil, using the quadrupole echo sequence with a pulse length of 3.5 μs. In crosspolarization magic-angle spinning (CP-MAS) experiments, samples were rotated at a MAS frequency (νr) of 3–6 kHz. Hartmann–Hahn crosspolarization from 1H to 13C was achieved over a 1-ms contact time at a field of 65 kHz for both nuclei, and protons were decoupled during signal acquisition at a field of 65 kHz. Rotational-echo double-resonance (REDOR) experiments (13C-observe, 19F-dephase) were conducted at a MAS frequency of 4.5 kHz using a standard pulse sequence (20). The number of rotor cycles (Nc) was 8 or 16 at a spinning frequency νR of 4500 Hz, and the π pulse length for both 19F and 13C frequencies was 9 μs in both cases.
Results and Discussion
Binding and Activity of Ouabain Derivatives.
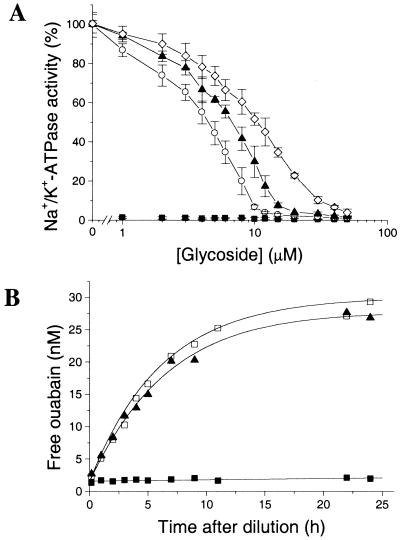
The inhibitory potencies of ouabain and its derivatives were determined from curves of Na+/K+-ATPase hydrolytic function over a range of drug concentrations (Fig. 1A). Ouabain is a highly potent inhibitor and inactivated the enzyme with an IC50 of <0.08 μM, whereas OMA (I), ODA (III), and OFDA (VII) all exhibited IC50 values of between 5 and 15 μM. Hence, modification of the steroid group of ouabain led to a reduction in inhibitory potency compared with that of the parent compound, whereas modification of the sugar had little additional effect on inhibitory potency. The acetonide fluoromethyl groups had no extra consequences for activity (Fig. 1A), indicating that the electronegative properties of fluorine were not important characteristics for inhibitor binding. It is known that the sugar group is not crucial for inhibition because aglycones, such as ouabagenin, exhibit inhibitory potencies only slightly lower than those of the cardiac glycosides (21). The role of the sugar, which alone has no inhibitory effect, is unclear, although it increases the water solubility of cardiac glycosides relative to aglycones and thereby may influence uptake and distribution of the inhibitor.
Figure 1.
Binding and activity data for ouabain and its acetonide derivatives in renal Na+/K+-ATPase membranes at 37°C. (A) Dose-response curve showing the ATPase activity remaining at the specified concentrations of ouabain (■), OMA (○), ODA (▴), and OFDA (◊) relative to the total activity in the absence of inhibitors. (B) The time course of release of [3H]ouabain from Na+/K+-ATPase after addition of 50 μM nonlabeled ouabain (□) or ODA (▴) was followed for up to 25 h. The stability of the enzyme-[3H]ouabain complex is also indicated (■).
The selectivity of ouabain derivatives for the digitalis site was determined from time-course studies of [3H]ouabain release from the Na+/K+-ATPase membranes (Fig. 1B). In the absence of the derivatives, [3H]ouabain remained bound to the membrane fraction for up to 25 h, but was displaced after addition of either unlabeled ouabain or ODA to the membranes. Fig. 1B shows that displacement of [3H]ouabain by unlabeled ouabain and by ODA followed the same time course, a strong indication that the derivative binds to the same site as ouabain in a fully competitive manner. Dissociation constants for the derivatives, calculated from Scatchard plots of [3H]ouabain binding (not shown), were on the order of 600 nM compared with <10 nM for the parent compound. Hence, the derivatives retained considerable inhibitory potency despite having a lower binding affinity than ouabain.
Formation of acetonide bridges across the steroid and rhamnose hydroxyl groups reduces the hydrogen-bonding capacity of the derivatives; moreover, mutation of transmembrane residues having hydrogen-bonding potential has been shown to alter the sensitivity of Na+/K+-ATPase to ouabain binding (22). Hence, the diminished affinity of the ouabain analogues may arise from a reduction in the ability of the steroid group to form hydrogen bonds with conserved residues. Lowering the hydrogen-bonding capacity of the functionally less important rhamnose group appears to have less of an effect on inhibitory potency.
Dynamics of Inhibitors in the Digitalis Site.
Information on the binding characteristics of ouabain analogues was obtained from 2H NMR studies on the dynamics of 2H-labeled ODA (compounds IV and V) titrated into Na+/K+-ATPase membranes. In the case of small deuterated ligands bound to large proteins undergoing slow anisotropic reorientation in the membrane, protein rotation alone is insufficient to completely average the 2H quadrupolar interaction, and the 2H spectral line shape is influenced by the local dynamics of the deuterated ligand (e.g., ref. 23).
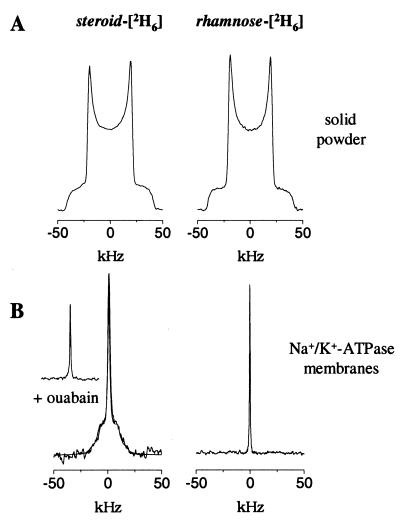
The 2H NMR spectra of ODA with deuterons placed either in the methyl groups of the steroid acetonide (IV) or in the rhamnose acetonide methyls (V) are shown in Fig. 2. Spectra of powder samples of the two inhibitors were very similar to each other, and their line shapes and quadrupole couplings indicated that rapid unrestricted deuteriomethyl rotation was the dominant motion in the solid state (Fig. 2A). The spectral similarity was lost, however, when IV and V were titrated into the Na+/K+-ATPase membranes (Fig. 2B). The spectrum from the rhamnoside deuterons of V consisted of a single narrow line (Fig. 2B Right), indicating that the 2H quadrupolar interaction was reduced to close to the isotropic limit by molecular motion. The sugar group therefore must interact only very loosely with the digitalis site to be consistent with such a high degree of motional freedom.
Figure 2.
Deuterium NMR spectra (recorded at 0°C) of [steroid-2H6]ODA (IV) and [rhamnose-2H6]ODA (V) in solid powder form (A) and when added to renal Na+/K+-ATPase membranes in molar equivalence to the digitalis sites (B). The spectrum after addition of an excess of ouabain is shown (Inset). The spectrum of IV in the membrane preparation (B Left) was simulated (using algorithms described in ref. 26) by superposition of a Lorenztian line shape and an axially symmetrical powder pattern with a residual quadrupole splitting of 17 kHz. The powder component represented >70% of the total signal.
By contrast, the 2H NMR spectrum from the steroid deuterons of IV in the membranes exhibited a broad powder line shape superimposed on a narrow central line (Fig. 2B Left). The broad component disappeared after titrating an excess of ouabain into the membranes (Fig. 2B Inset) and hence corresponded to inhibitor in the digitalis site, whereas the central line was attributed to a much smaller fraction of nonbound IV in the aqueous medium. The residual quadrupole splitting of about 17 kHz observed for the bound inhibitor indicates that the steroid fragment of the molecule was much more restrained than the sugar group. Intermediate rate motions (on the microsecond time scale), such as rotational diffusion of the protein-inhibitor complex in the membrane, might be responsible for the partial averaging of the effective quadrupolar interaction.
The motional restraint experienced by the modified steroid moiety at the binding site might arise from stabilizing hydrogen bond interactions with surface residues (24), constraining interactions with hairpin loops (10), or by intercalation into the protein interior (25). The latter case is unlikely, because raising the temperature by 5°C caused the two-component 2H NMR line shape in Fig. 2B (Left) to collapse to a single line (data not shown). If the steroid were fully restrained by intercalation into the protein interior (25), 2H NMR line shape simulations (26) predict that the observed line narrowing would be consistent with over a 100% increase in the protein rotational rate on raising the temperature to 5°C. Saturation-transfer EPR studies of spin-labeled Na+/K+-ATPase indicate that the actual increase in the rate of protein rotation is <20% on raising the temperature from 0°C to 5°C (figure 4 in ref. 27).
Interaction of Inhibitors with the Digitalis Site.
The local environment of cardiac glycoside analogues in the digitalis site was probed by 13C CP-MAS NMR of 13C-labeled OMA (II) and ODA (VI) titrated into Na+/K+-ATPase membranes.
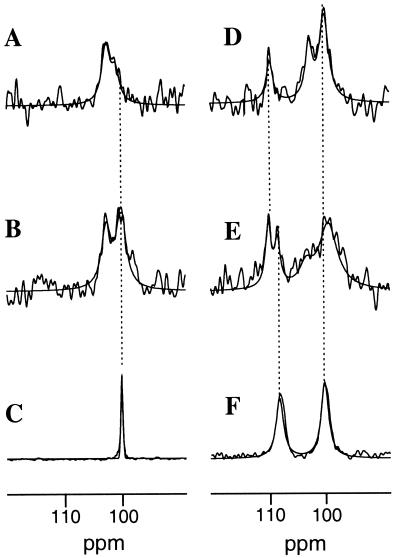
A series of CP-MAS NMR spectra was obtained (Fig. 3) from frozen Na+/K+-ATPase membranes before and after the addition of 13C-labeled OMA (II) and ODA (VI). The 13C labels resonate in a region of the spectrum in which a small natural abundance resonance is present at 103.5 ppm (Fig. 3A). Titration of a molar equivalence (with respect to the digitalis sites) of [13C]OMA (II) into the Na+/K+-ATPase membranes was marked in the spectrum by the emergence of a resonance peak at 100.4 ppm (Fig. 3B). From the results of the 2H NMR experiments (Fig. 2), it was expected that over 70% of the peak intensity corresponded to OMA bound to the digitalis site. The resonance frequency of II titrated into the Na+/K+-ATPase membranes was identical to that of an equal concentration of OMA in buffer solution (Fig. 3C), indicating that binding of the inhibitor did not perturb the electronic distribution around the steroid-13C acetonide group.
Figure 3.
Region of 13C CP-MAS NMR spectra of renal Na+/K+-ATPase membranes and 13C-labeled ouabain derivatives. Membrane spectra were recorded (at −50°C) in the absence of inhibitors (A) and after addition of [13C]OMA (II) in molar equivalence to the digitalis sites (B), and the spectrum was recorded of II in aqueous solution (C). Spectra also were recorded of membranes after the addition of [rhamnose-13C, steroid-13C]ODA (VI) in molar equivalence (D) and in a 2-fold excess (E) with respect to the digitalis site concentration, and of VI in aqueous solution (F). The dashed lines highlight the chemical shifts of II and VI in solution and II and VI in Na+/K+-ATPase membranes. Spectra resulted from the accumulation of 8192 scans with a repetition rate of 2 s.
Titration of [13C2]ODA (VI) into the digitalis site was marked by the appearance of two resonance lines, one at 100.4 ppm from the steroid 13C-acetonide as before, the other at 110.9 ppm from the rhamnose 13C-acetonide (Fig. 3D). The steroid-13C chemical shift from VI in the binding site was again identical to that of the inhibitor alone in buffer solution (Fig. 3F), whereas the rhamnose 13C peak had moved downfield to 110.9 ppm from its solution chemical shift of 109.1 ppm. After titration of a 2-fold excess of VI into the Na+/K+-ATPase membranes (Fig. 3E), a new resonance peak from the rhamnoside-13C emerged at the same position as that for VI in buffer solution (Fig. 3F). Hence, the two peaks were assigned to inhibitor VI free in solution (at 109.4 ppm) and at the digitalis site (110.9 ppm), and the spectra therefore indicated that all of the inhibitor was bound when present in molar equivalence to the binding sites (Fig. 3D).
The downfield shift of the rhamnose-13C peak occurring after binding of VI to the digitalis site can be ascribed to the deshielding effects of local electron-withdrawing groups of polar residues, ring currents of aromatic side-chains, or contributions from both mechanisms. It is likely that the polarity of the acetonide substituent on the sugar group is too low to favor an interaction with polar residues, and it is more probable that the sugar group comes into contact with aromatic residues.
Structures of Inhibitors in the Digitalis Site.
Fluorinated 13C-labeled OFDA was examined by using the CP-MAS NMR method REDOR (20). Distances between isotope labels are measured by following the loss of signal intensity from the observed nuclear spin (e.g., 13C) after reintroducing its distance-dependent dipolar coupling with a heteronuclear spin (e.g., 19F). After Nc rotor cycles at a given sample spinning frequency (νR), the distance between the observed and the coupled atomic nuclei (up to 10 Å for 19F-13C) can be calculated from the fraction of signal remaining (20).
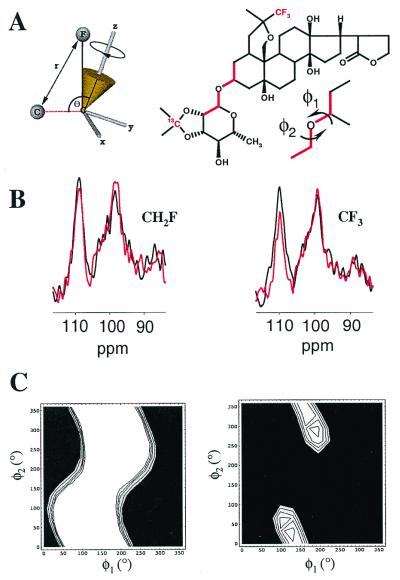
A strategy was used in which fluorinated analogues with a 13C label placed in the rhamnoside moiety, and either a -CF3 group (VIII) or -CH2F group (IX) in the steroid acetonide, were examined at the digitalis receptor site. Comparing the dipolar dephasing of the rhamnoside 13C signal by the combined effect of three equivalent 19F nuclei and also by the weaker effect of a single 19F permitted two independent constraints to be placed on the inhibitor binding conformation. In both experiments, the distance separating the rhamnoside 13C and the centroid defining the time-averaged position of the axially rotating fluorine atom(s) is related to two flexible torsional angles (φ1 and φ2) in the molecule (Fig. 4A). All other angles and bond lengths are known, and hence, by measuring the distance-dependent dipolar coupling between 13C and 19F, it is possible to deduce combinations of φ1 and φ2 that are consistent with the experimental data.
Figure 4.
Strategy for structure determination of VIII and IX at the digitalis site, from REDOR measurements of rhamnose-13C signal dephasing by the steroid-19F. (A) First, dephasing S/S0 was calculated for the time-dependent distance r between 13C and 19F (shown in red), for molecular conformations covering the entire conformational space of the rhamnose group. The calculations took into account the torsional angles φ1 and φ2, the coordinates defining the 19F rotational trajectory in a fixed molecular reference frame (x, y, z), angle θ between the C-F rotational axis and the 13C-C vector, the number of 19F atoms (three in compound VIII and one in compound IX), and the experimental NMR conditions. (B) Second, values of S/S0 were measured experimentally (at −50°C) from the resonance line at 110.4 ppm in the full-echo (black) and dephased-echo (red) spectra from either VIII (Left) or IX (Right) in the digitalis site. Spectra resulted from the accumulation of 54,000 scans. (C) Third, molecular conformations were determined by comparing the calculated S/S0 values with the experimental values. Torsional angles φ1 and φ2 giving the best fit of the calculated S/S0 to the experimental dephasing are identified from the light-colored regions of contour plots for VIII (Left) and IX (Right).
The results of REDOR experiments on VIII and IX in the digitalis site are shown in Fig. 4B. Two 13C spectra were obtained, one a full-echo spectrum that serves as a control, and the other a 19F dephased-echo spectrum after reintroduction of the 13C-19F dipolar interaction that carries the distance information. The intensity of the full-echo spectrum divided by the intensity of the dephased echo spectrum (S/S0) is proportional to the 13C-19F interatomic distance. In Na+/K+-ATPase membranes containing VIII, which has a CH2F group, the intensities of the full-echo and dephased-echo spectra were almost identical after 16 rotor cycles (i.e., S/S0 = 0.97 ± 0.03) (Fig. 4B Left). In Na+/K+-ATPase membranes containing IX, which has a CF3 group, S/S0 was slightly lower at 0.90 ± 0.05 under the same conditions (Fig. 4B Right).
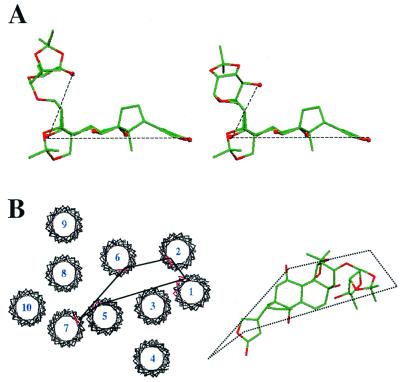
The molecular conformation of OFDA in the digitalis site was determined by comparing the measured S/S0 with values computed (28) for combinations of angles φ1 and φ2 covering the entire conformational space of the sugar group (Fig. 4). Combinations of angles consistent with the observed dephasing for VIII and IX in the digitalis site are given by the white regions of the contour plots shown in Fig. 4C. In the case of the monofluoro-compound (IX), angle φ1 was found to range between 10° and 290°, whereas angle φ2 could take all possible values between 0° and 360° (Fig. 4C Left). These angles rule out a significant number of conformations. In the case of VIII, the combined coupling of three equivalent fluorine nuclei to the sugar 13C produced greater dephasing, consistent with two clusters of φ1 and φ2 values. The clusters corresponded to two groups of closely related low-energy molecular conformations (Fig. 4C Right). In both clusters, the inhibitor adopts a conformation with the sugar group extending approximately 5 Å out of the plane defined by the steroid hydroxyl groups (Fig. 5A).
Figure 5.
Structural features of cardiac glycosides and the digitalis site. (A) Representatives of the two groups of closely related structures of OFDA at the digitalis site determined by 13C,19F-REDOR NMR. Carbon atoms are shown in green, oxygen atoms in red, and hydroxyl groups are represented as spheres for clarity. (B) The 10 putative transmembrane regions of the Na+/K+-ATPase α subunit were fit to the electron density map of Ca2+-ATPase (6), showing in red the mutation sites conferring ouabain resistance to HeLa cells. One possible structure of OFDA is shown alongside the protein model to illustrate the comparative dimensions of the cardiac glycosides and the surface of the α subunit, and a possible docking orientation.
Models for the Docking of Cardiac Glycoside Analogues.
Current understanding of the digitalis site is owed largely to phenomenological observations of mutated residues conferring ouabain resistance to HeLa cells (10). Here, direct observation of the dynamics, structure, and local environment of labeled ouabain derivatives, using a combination of solid-state NMR methods, has shed light on the dimensions of the digitalis receptor site and the orientation of inhibitors within it.
Ouabain-resistance of the rat Na+/K+-ATPase α1 subunit has been attributed to differences in the residues of the H1-H2 region compared with the ouabain-sensitive sheep α1-subunit (29), and mutations of Cys104, Tyr108, and Asp121 in this region all confer ouabain resistance on the enzyme (22, 30). In addition, ouabain resistance is observed after substitutions of residues toward the C-terminal end of the α-subunit, in the H5 (Phe786), H6 (Thr797), and H7 (Phe863) transmembrane regions, as well as in the short H5-H6 hairpin loop (Leu793) and the H7-H8 loop (Arg880) (10). Moreover, Cys104 in H1 is modified by ouabain derivatives containing a photoactivatable site on the sugar group (9) and therefore must lie close to the sugar recognition site. It has been proposed, therefore, that the N-terminal H1-H2 region forms a recognition site for cardiac glycosides, whereas the C-terminal region forming the putative K+-channel (H4-H6, H8) is the inhibitory site, because K+ antagonizes ouabain binding (10, 24).
The seemingly disperse distribution of ouabain-sensitive residues form a feasible interaction site if the putative membrane helices H1-H10 are arranged according to the structure of skeletal muscle Ca2+-ATPase (Fig. 5B and ref. 6). In this arrangement, the binding site stretches across the extracellular face of the enzyme, and the helices forming the outer extremes of the site (H1 and H5) are separated by about 20 Å. This distance is approximately the same as the separation of the two ends of the ouabain derivatives in the digitalis site (Fig. 5B).
The ouabain derivatives exhibit rather less inhibitory potency than the parent compound (Fig. 1A), but bind to the Na+/K+-ATPase competitively with respect to ouabain (Fig. 1B) and are thereby valid probes of the digitalis site. At this stage it would be ambitious to use the information on the analogues to draw many firm conclusions about natural cardiac glycosides in the binding site, because of the lower binding affinity of the analogues and their unique chemical structures. Some suggestion of how natural cardiac glycosides are oriented within the digitalis site might be provided by the analogues, however. The high mobility of the sugar group of bound ODA (Fig. 2B) indicates that this part of the inhibitor molecule is much less restrained by interactions with the protein than is the steroid moiety. From the binding conformation of OFDA (Fig. 5A), it is anticipated that the mobility of the sugar would be highest if the orientation of the steroid ring system allows the sugar to extend away from the surface of the protein. The steroid moiety then could be restrained by hydrogen bonds between the hydroxyl groups (shown in red in Fig. 5A) and the binding surface. If, on the other hand, the steroid group were flipped over so that the sugar faces toward the protein surface, the sugar would penetrate into the transmembrane region of H1 and H2. This would allow interaction of the sugar with ouabain-sensitive transmembrane residues (Cys104, Tyr108, and Glu111, but also would confer extra stability on the sugar that is inconsistent with the observed high mobility. Hence, the 2H NMR data argues in favor of a sugar group in loose association with the periphery of the protein, and against a mechanism in which protein residues secure the sugar.
The downfield shift of the rhamnoside 13C resonance peak upon binding of ODA to the digitalis site (Fig. 3) gives more indication of the sugar group environment. Such a shift might be caused by the ring currents of neighboring aromatic residues and one candidate is Tyr108, because substitutions at this position are known to reduce ouabain affinity (22). Tyr108 is located in the transmembrane region H1 according to the hypothetical membrane topology of Na+/K+-ATPase (31), and to attain a close proximity to the aromatic side-group the sugar therefore must be oriented toward the membrane interior. As discussed above, however, this inhibitor orientation is not consistent with the high mobility of the sugar, and it is necessary to seek alternative candidates in the extracytoplasmic regions. These include Trp310 in the H3-H4 loop, which has been labeled with a photoactivatable ouabain derivative (8), and a number of aromatic residues in the H7-H8 loop, although the latter possibility would necessitate the sugar group facing toward the C-terminal end of the protein.
In conclusion, using a combination of solid-state NMR methods and existing site-directed mutagenesis information (10), we have gained insights into the digitalis receptor site and its interaction with active ouabain analogues. This work has laid important foundations for further experiments to measure direct interactions between labeled inhibitors and the digitalis site.
Acknowledgments
We thank Birthe Bjerring Jensen and Angielina Damgaard for expert technical assistance and Dr. Richard Kemp-Harper for assistance with NMR instrumentation. The Biotechnology and Biological Sciences Research Council is acknowledged for a Senior Research Fellowship (to A.W.) and for equipment awards (with Higher Education Funding Council for England) under the Joint Research Equipment Initiative. This work was supported by Grant 511/95 M from the Human Frontier Science Program.
Abbreviations
- OMA
ouabain monoacetonide
- ODA
ouabain diacetonide
- OFDA
ouabain fluorodiacetonide
- CP-MAS
crosspolarization magic-angle spinning
- REDOR
rotational-echo double-resonance
Footnotes
Article published online before print: Proc. Natl. Acad. Sci. USA, 10.1073/pnas.250471997.
Article and publication date are at www.pnas.org/cgi/doi/10.1073/pnas.250471997
References
- 1.Lingrel J B, Kuntzweiler T A. J Biol Chem. 1994;269:19659–19662. [PubMed] [Google Scholar]
- 2.Thomas R, Gray P, Andrews J. Adv Drug Res. 1990;19:311–562. [Google Scholar]
- 3.Jewell E A, Shamraj O I, Lingrel J B. Acta Physiol Scand. 1992;146:161–169. [PubMed] [Google Scholar]
- 4.Bamberg E, Schoner W, editors. The Sodium Pump: Structure, Mechanism, Hormonal Control, and its Role in Disease. New York: Springer; 1994. [Google Scholar]
- 5.Stokes D L, Auer M, Zhang P, Kuhlbrandt W. Curr Biol. 1999;9:672–679. doi: 10.1016/s0960-9822(99)80307-8. [DOI] [PubMed] [Google Scholar]
- 6.Toyoshima C, Nakasako M, Nomura H, Ogawa H. Nature (London) 2000;405:647–655. doi: 10.1038/35015017. [DOI] [PubMed] [Google Scholar]
- 7.Auer M, Scarborough G A, Kuhlbrandt W. Nature (London) 1998;392:840–843. doi: 10.1038/33967. [DOI] [PubMed] [Google Scholar]
- 8.Rossi B, Lazdunski M. Methods Enzymol. 1988;156:323–333. doi: 10.1016/0076-6879(88)56033-0. [DOI] [PubMed] [Google Scholar]
- 9.Antolovic R, Linder R, Hahnen J, Schoner W. Eur J Biochem. 1995;227:61–67. doi: 10.1111/j.1432-1033.1995.tb20359.x. [DOI] [PubMed] [Google Scholar]
- 10.Lingrel J B, Argüello J M, Van Huysse J, Kuntzweiler T A. Ann NY Acad Sci. 1997;834:194–206. doi: 10.1111/j.1749-6632.1997.tb52251.x. [DOI] [PubMed] [Google Scholar]
- 11.Kuntzweiler T A, Argüello J M, Lingrel J B. J Biol Chem. 1996;271:29682–29687. doi: 10.1074/jbc.271.47.29682. [DOI] [PubMed] [Google Scholar]
- 12.Argüello J M, Lingrel J. J Biol Chem. 1995;270:22764–22771. doi: 10.1074/jbc.270.39.22764. [DOI] [PubMed] [Google Scholar]
- 13.Watts A, Ulrich A S, Middleton D A. Mol Membr Biol. 1995;12:233–246. doi: 10.3109/09687689509072423. [DOI] [PubMed] [Google Scholar]
- 14.Watts A, Burnett I J, Glaubitz C, Gröbner G, Middleton D A, Spooner P J R, Watts J A, Williamson P T F. Nat Prod Rep. 1999;16:419–423. doi: 10.1039/a801189c. [DOI] [PubMed] [Google Scholar]
- 15.Grobner G, Glaubitz C, Burnett I, Mason J, Watts A. Nature (London) 2000;405:810–813. doi: 10.1038/35015604. [DOI] [PubMed] [Google Scholar]
- 16.Middleton D A, Robins R, Feng X, Levitt M H, Spiers I D, Schwalbe C, Watts A. FEBS Lett. 1997;410:269–274. doi: 10.1016/s0014-5793(97)00525-5. [DOI] [PubMed] [Google Scholar]
- 17.Hansen O. Biochim Biophys Acta. 1976;433:383–392. [Google Scholar]
- 18.Jørgensen P L. Biochim Biophys Acta. 1974;356:36–52. doi: 10.1016/0005-2736(74)90292-2. [DOI] [PubMed] [Google Scholar]
- 19.Esmann M. Methods Enzymol. 1988;156:105–115. doi: 10.1016/0076-6879(88)56013-5. [DOI] [PubMed] [Google Scholar]
- 20.Pan Y, Gullion T, Schaefer J. J Magn Reson. 1990;90:330–340. [Google Scholar]
- 21.Thomas R C, Boutagy J, Gelbert A. J Pharmacol Sci. 1974;63:1649–1683. doi: 10.1002/jps.2600631102. [DOI] [PubMed] [Google Scholar]
- 22.Schultheis P J, Lingrel J B. Biochemistry. 1993;32:544–550. doi: 10.1021/bi00053a020. [DOI] [PubMed] [Google Scholar]
- 23.Zhang H, Bryant R G. Biophys J. 1997;72:363–372. doi: 10.1016/S0006-3495(97)78675-2. [DOI] [PMC free article] [PubMed] [Google Scholar]
- 24.Palasis M, Kuntzweiler T A, Argüello J M, Lingrel J B. J Biol Chem. 1996;271:14176–14182. doi: 10.1074/jbc.271.24.14176. [DOI] [PubMed] [Google Scholar]
- 25.Repke K R, Megges R, Weiland J, Schön R. FEBS Lett. 1995;359:107–109. doi: 10.1016/0014-5793(95)00020-a. [DOI] [PubMed] [Google Scholar]
- 26.Greenfield M S, Ronemus A D, Vold R L, Vold R R, Ellis P D, Raidy T E. J Magn Reson. 1987;72:89–95. [Google Scholar]
- 27.Esmann M, Hideg K, Marsh D. Biochim Biophys Acta. 1992;115:951–959. doi: 10.1016/0005-2736(92)90394-2. [DOI] [PubMed] [Google Scholar]
- 28.Goetz J M, Schaefer J. J Magn Reson. 1997;127:147–154. doi: 10.1006/jmre.1997.1198. [DOI] [PubMed] [Google Scholar]
- 29.Price E M, Lingrel J B. Biochemistry. 1988;27:8400–8408. doi: 10.1021/bi00422a016. [DOI] [PubMed] [Google Scholar]
- 30.Canessa C M, Horisberger J-D, Louvard D, Rossier B C. EMBO J. 1992;11:1681–1687. doi: 10.1002/j.1460-2075.1992.tb05218.x. [DOI] [PMC free article] [PubMed] [Google Scholar]
- 31.Schull G E, Schwartz A, Lingrel J B. Nature (London) 1985;31:6691–695. [Google Scholar]


